Introduction
Dairying is crucial to India's agriculture and economy, supporting rural livelihoods and contributing significantly to economic growth. It complements traditional crop cultivation, providing a stable income year-round and mitigating risks from seasonal fluctuations and climate uncertainties (Saxena et al., Reference Saxena, Choudhary and Joshi2019). The dairy industry contributes 5% to the national economy and directly supports over 800,000 farmers. Despite India's global leadership in milk production, with a 23% share of the world's output, low productivity among farm animals remains a pressing challenge, threatening the sustainability of milk production and the livelihoods of millions of farmers (Sharma et al., Reference Sharma, Choudhary, Singh, Kumar, Gupta and Dev2021; Choudhary and Sirohi, Reference Choudhary and Sirohi2022).
The productivity of dairy animals depends on the timely availability of sufficient, high-quality fodder (Sharma et al., Reference Sharma, Choudhary, Singh, Kumar, Gupta and Dev2021). This is particularly critical for small and marginal farmers in India, who rely heavily on livestock rearing for their livelihoods. Shortages of adequate fodder, compounded by rising prices, severely hinder these farmers' ability to maintain optimal nutrition levels for their livestock, directly impacting milk production (Ghosh et al., Reference Ghosh, Palsaniya and Srinivasan2016; Choudhary et al., Reference Choudhary, Sharma, Singh, Kumar, Gupta, Kantwa, Upadhyay, Wasnik, Prasad and Sharma2022). Instability of fodder availability complicates efforts to secure stable incomes from livestock, exacerbating economic vulnerability and perpetuating cycles of poverty. Addressing the link between fodder scarcity and animal productivity is crucial to protecting the livelihoods of small and marginal farmers, necessitating targeted interventions for sustainable access to quality fodder resources.
Empirical evidence on the impact of fodder technology adoption on milk productivity and income is limited but growing. Tesfaye and Gutema (Reference Tesfaye and Gutema2022) found that households in Northern Ethiopia using improved forage technologies saw a 29.32% increase in milk yield and a 19.56% rise in farm income. Maina et al. (Reference Maina, Ritho, Lukuyu and Rao2020) reported a 27.6% increase in milk production in Kenya from adopting Brachiaria grass, while Ayuko et al. (Reference Ayuko, Lagat, Hauser, Ouko and Midamba2024) found that feeding Napier grass boosted milk productivity by around 25% in western Kenya. Studies in the Indian context have also reported the impact of adopting forage-based technologies on improving milk productivity (Sharma et al., Reference Sharma, Choudhary, Singh, Kumar, Gupta and Dev2021; Choudhary et al., Reference Choudhary, Sharma, Singh, Upadhyay, Kumar, Gupta, Kantwa, Wasnik and Prasad2024a) and enhancing the technical efficiency of dairy farmers (Choudhary et al., Reference Choudhary, Sharma, Singh, Kumar, Gupta, Kantwa, Upadhyay, Wasnik, Prasad and Sharma2022). However, a significant gap remains in understanding how increased fodder resources directly influence the livelihoods of dairy farmers. Understanding the impact of any farm based technologies on farmer's livelihoods is essential, as livelihoods go beyond income to include key aspects like food security, health, and social well-being. This broader perspective is crucial for assessing the overall economic, social, and ecological effects of these technological interventions.
This study examines the impact of improved forage technologies on the livelihood security of dairy farmers in Aadarsh Chara Gaon (ACG) – model fodder villages in Datia (Garera and Dhobiya) and Shivpuri (Awas) districts, Madhya Pradesh. These villages were developed under the Aadarsh Chara Gaon (ACG) – model fodder villages program by the ICAR-Indian Grassland and Fodder Research Institute (ICAR-IGFRI), Jhansi (India) between 2013 and 2018. The program implemented strategic interventions aimed at promoting sustainable livestock production and improving rural livelihoods in these regions, which face challenges due to arid and semi-arid climatic conditions that affect agricultural productivity and rural economies (Kumar et al., Reference Kumar, Sharma, Satyapriya, Singh, Kumar, Halli, Choudhary and Bagavathiannan2022; Choudhary et al., Reference Choudhary, Singh, Dev, Sharma, Singh and Chand2024b). In response to the risks posed by climate change on crop production, livestock-based mixed farming has become essential for the local economy, providing a sustainable livelihood for rural communities. The study area reflects typical smallholder dairy farming regions in India's semi-arid tropics (Sharma et al., Reference Sharma, Choudhary, Singh, Kumar, Gupta and Dev2021).
Key interventions under the Model Fodder Village program included: identifying and utilizing suitable land for fodder cultivation, implementing improved practices for forage production with varieties like cereals, legumes, and perennial grasses such as Bajra-Napier hybrid grass, adopting agronomic management techniques for fodder crops, integrating horti-pasture systems by combining fodder crops with fruit trees in farmers' fields, and establishing e-Chara Kendras for community-based fodder management initiatives. Additionally, farmers were trained in fodder conservation practices (timely harvest and use of silage additives for maintaining forage quality during storage) and utilization techniques (balancing rations with different types of fodder and integrating supplementary feeding with stored forages). This holistic approach aimed to address challenges like fodder scarcity, enhance milk productivity, and increase income, making it an ideal setting for investigating the ex-post impact of forage-based technological interventions on rural livelihoods.
Materials and methods
Selection of control villages
The selection of control villages for the impact analysis of technological interventions conducted between 2013–18, assessed during 2023–24, was a critical step to ensure the reliability and validity of the findings. To minimize bias, six neighboring villages were initially identified that did not receive forage-based interventions, located at least 15 km away from the treated villages. This distance helped minimize potential spillover effects, ensuring that any observed differences between treated and control villages could be attributed to the forage interventions rather than external influences. This approach is in line with best practices in impact evaluation, as used in similar studies, such as those by Marwa et al. (Reference Marwa, Mburu, Elizaphan, Oburu, Mwai and Kahumbu2020) and Sharma et al. (Reference Sharma, Choudhary, Singh, Kumar, Gupta and Dev2021), which emphasize the importance of selecting geographically distant and non-intervened villages to avoid contamination of results.
Further strengthening the robustness of the control group, a Village Development Index (VDI) was developed for both treated and control villages. The VDI incorporated key indicators such as physical infrastructure, human resources, village autonomy, and economic progress (Yudha et al., Reference Yudha, Juanda, Kolopaking and Kinseng2020), ensuring that the selected control villages had comparable development profiles to the treated villages. The three villages (Sanora, Rajpur, and Ataa) were selected as control villages based on their similar VDI scores (see Annexure -1), ensuring a balanced comparison. This approach effectively isolated the effects of the forage-based interventions from other development programs and regional influences, providing a more accurate assessment of their impact on the livelihoods of farmers in the treated villages.
The study used purposive and random sampling techniques to select respondents. While selection of treated and control villages was purposive, dairy households were randomly chosen within these villages. Probability proportional to size method was used to draw sample households from each village. A total of 437 respondents were surveyed, comprising 183 from treated villages and 254 from control villages. The survey took place over two visits, spanning from June 2023 to March 2024. Each farmer was visited twice to collect data on their livelihood outcomes, minimizing recall bias.
Construction of livelihood security index
Indicators for studying livelihood security should be location specific and be constructed based on the socio-economic particulars of the location under examination (Bhandari and Grant, Reference Bhandari and Grant2007; Mishra and Debata Reference Mishra and Debata2021). The present study considered six dimensions of livelihood security: habitat, health, economic, educational, food, nutrition and social security. Based on the broad literature review (Singh et al., Reference Singh, Goyal, Choudhary and Guleria2021; Mishra and Debata Reference Mishra and Debata2021; Choudhary and Sirohi Reference Choudhary and Sirohi2021), indicators of the each dimension were chosen (Annexure -2). Among various methods of normalization, mean of each indicator was used for scale-free transformation of the data as it does not affect the dispersion of indicators and satisfies the basic axioms (Choudhary and Sirohi Reference Choudhary and Sirohi2021). Since all the indicators cannot be of equal importance in explaining the vulnerability, they need to be attached different weights. Principal component analysis (PCA) – a reliable and objective approach (Choudhary and Sirohi Reference Choudhary and Sirohi2021; Singh et al., Reference Singh, Goyal and Choudhary2022) was used to assign weights to indicators of each dimension of livelihood security. Finally the Livelihood Security Index (LSIs) for each household was calculated by weighted average method, where weights were determined by the number of indicators used to construct index of each dimension. Based on the LSI value, the households were categorized as high, medium and low using mean and standard deviation as follows:
 \begin{equation*}High\!\!:\,LSI\, \gt \left( {Mean\, \pm 0.5\,SD} \right)\end{equation*}
 \begin{equation*}Medium\!\!:\,\left( {Mean\, - 0.5\,SD} \right) \lt LSI\, \lt \left( {Mean + 0.5\,SD} \right)\end{equation*}
 \begin{equation*}Low\!\!:\,LSI\, \lt \left( {Mean\, \pm 0.5\,SD} \right)\end{equation*}
Impact evaluation
Impact can be measured by calculating the average treatment effect on the treated (ATT) as follows
 \begin{equation}ATT = E\left\{ {{Y_{iA}} - {Y_{iNA}}|\,{T_i} = 1} \right\}\end{equation}
Where, E{.} is the expectation operator.  ${Y_{iA}}$ Indicates potential outcome for ith adopter (treated) household (
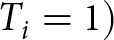 ${T_i} = 1)\,$and
 ${Y_{iNA}}$ is potential outcome for ith non-adopter (control) household (
 ${T_i} = 0)$. The key estimation problem in the above equation (1) is that it is not possible to observe the outcome of adopters had they not adopted, i.e., E
 $\left( {{Y_{iNA}}{\text{|}}{T_i} = 1} \right)$. Takahashi and Barrett (Reference Takahashi and Barrett2013) further opined that replacing these unobserved counterfactuals by outcomes of non-adopters may result in biased ATT estimates.
We used inverse-propensity-weighting regression adjustment (IPWRA) method – a double robust estimator of ATT (Wooldridge, Reference Wooldridge2010), as our prime estimator. IPWRA combines matching and outcome modeling in one framework, improving treatment effect estimation by addressing selection bias and post-treatment differences through weighting and regression adjustment.
For constructing IPWRA estimator, we first specified the outcome equation as  ${Y_i} = {\alpha _i} + \mathop \sum \limits_{j = 1}^n {\beta _{ij}}{X_{ij}} + {{{\varepsilon }}_i}$, (where, i = 1 for adopters and 0 for non-adopters, X is as defined in equation 1) and estimated propensity scores i.e. the probability of receiving treatment
 $P\left( {X,\,\hat Y} \right)$ using probit model. The ATT was then computed as
 \begin{equation}AT{T_{IPWRA}} = \,n_A^{ - 1}\mathop \sum \limits_{i = 1}^n {T_i}\,\left[ {\,{r_A}\left( {X,\,{\delta _A}} \right) - {r_{NA}}\left( {X,\,{\delta _{NA}}} \right)} \right]\end{equation}
Where nA is the number of adopters (A), rA(X) and rNA(X) is the postulated regression model for the adopters (A) and non-adopters (N) based on observed covariates X, respectively. The parameter  ${\delta _A} = \left( {{\alpha _A},{\beta _A}} \right)\,$ in the above equation (2) is obtained using inverse-probability-weighted least squares procedures as follows:
 \begin{equation}\mathop {\min }\limits_{{\alpha _A}{\beta _A}} \mathop \sum \limits_{i = 1}^N {T_i}{(\,{y_i} - {\alpha _A} - X{\beta _A})^2}\,/\,\hat p\left( {X,\,\hat \gamma } \right)\end{equation}
Similarly,  ${\delta _{NA}} = \;\left( {{\alpha _{NA}},{\beta _{NA}}} \right)\,$ is computed as:
 \begin{equation}\mathop {\min }\limits_{{\alpha _{NA}}{\beta _{NA}}} \mathop \sum \limits_{i = 1}^N \left( {1 - {T_i}} \right){\left( {{y_i} - {\alpha _{NA}} - X{\beta _{NA}}} \right)^2}\,/\,(1 - \hat p(X,\,\hat \gamma ))\end{equation}
Imbens and Wooldridge (Reference Imbens and Wooldridge2009) advocated for employing multiple methodologies to estimate treatment effects, ensuring the robustness of findings, given the availability of diverse techniques. As a pivotal robustness check, our study also incorporated propensity score matching (PSM) and coarsened exact matching (CEM): the two widely utilized techniques in impact evaluation that offer a potent means of addressing missing data by matching individuals according to their propensity scores.
Results and discussion
Covariates and descriptive statistics
The systematic dissimilarities in observed characteristics between households from treated and control villages are clearly apparent (Table 1). Specifically, relative to control villages, household-heads of treated villages are better educated and have a larger land holding. Moreover, households in the treated villages had on average more adult livestock unit, better market access and are better exposed to training and demonstrations. The significant differences in outcome indicators clearly indicate that adopters of improved forage technology are systematically better off than their non-adopters counterpart in terms of overall livelihood security and also in four dimension of the LSI (Table 1). However, caution must be exercised in drawing causal claims about the impact of technological interventions on these indices, as confounding factors have not been accounted for.
Definitions and sample averages of selected variables

* p < 0.01, **p < 0.05.
Estimation of propensity score, matching quality and balancing test
We have previously motioned that IPWRA estimator for ATT requires estimation of propensity scores. The present study employed probit model to estimate propensity scores for the IPWRA estimator (Table 2). The results show that the education level of the household head significantly influences the adoption of forage technologies. Educated farmers have better access to technical advice, training sessions, and farm demonstrations, which facilitate adoption. This finding is consistent with existing literature emphasizing the role of education in technology adoption (Singh et al., Reference Singh, Choudhary, Dwivedi, Arunachalam, Kumar and Dev2023). Additionally, larger farm sizes are associated with higher adoption rates of improved forage technologies, as they provide greater capacity to manage risks (Kumar et al., Reference Kumar, Takeshima, Thapa, Adhikari, Saroj, Karkee and Joshi2020). The number of livestock units also correlates positively with adoption, reflecting that households with more livestock are more likely to adopt technologies that enhance forage production (Sharma et al., Reference Sharma, Choudhary, Singh, Kumar, Gupta and Dev2021).
Probit estimates of propensity score

Source: Authors’ estimates based on survey data.
† Matched sample size from treated villages.
Moreover, off-farm income emerges as a significant factor in technology adoption. Off-farm income of the farmers alleviates liquidity constraints enabling monetary investments in technology adoption and also minimizes risks in adopting any new technological interventions. The greater adoption intensity of agricultural technology among households with off-farm income, compared to those without such income, is widely acknowledged (Choudhary and Singh, Reference Choudhary and Singh2019). Finally, access to training and markets shows a positive and significant influence on the adoption of forage technologies among farmers. For small dairy farmers in resource-limited semi-arid regions, cultivating forage is economically difficult (Choudhary et al., Reference Choudhary, Singh, Dev, Sharma, Singh and Chand2024b). Market volatility and price fluctuations increase the risk, while the lack of economies of scale in small operations further complicates matters. Consequently, many farmers overlook forage cultivation despite its potential advantages. Training programs and extension services play a crucial role in addressing these challenges by offering farmers valuable knowledge about appropriate forage species, water-efficient techniques, and agronomic practices, empowering them to make more informed decisions and better manage risks. Training sessions and demonstrations build trust among farmers towards new technologies and mitigate the impact of limited formal education on adoption decisions. Access to output markets is also correlated with the household's ability to bear risks and encourages the adoption of new technologies (Ghimire et al., Reference Ghimire, Huang and Shrestha2015; Choudhary et al., Reference Choudhary, Sharma, Kumar, Gupta and Patil2023).
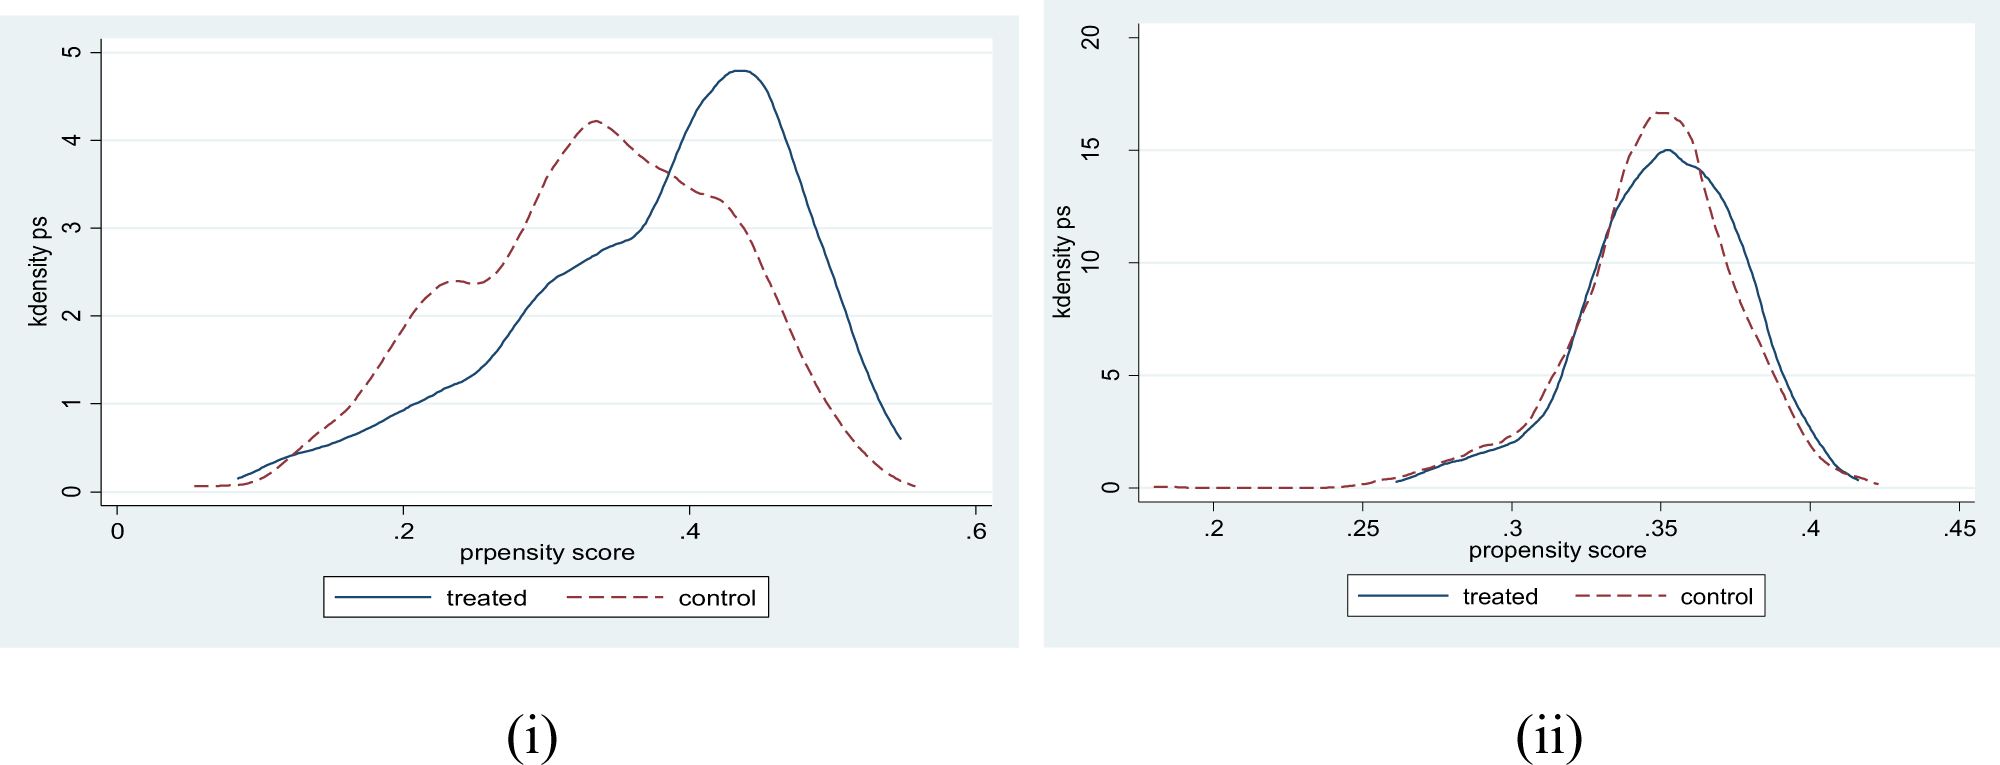
It is important to note that propensity score estimation is solely employed to achieve covariate balance between adopters and non-adopters. Visual observation of the Fig. 1 clearly indicate that there is considerable overlap of the distributions of the propensity scores for adopters and non-adopters of improved forage technology after matching suggesting that the assumption of common support firmly holds.
Propensity score distribution and common support. (i) unmatched sample. (ii) matched sample.

The balancing property test was carried out to assess the matching quality using Pseudo R2 and the likelihood ratio test (LRχ2). The matching quality is said to be good when the Pseudo R2 value decreases (Sianesi, Reference Sianesi2004) and the likelihood ratio test becomes insignificant (Smith and Todd, Reference Smith and Todd2005). In the present study, the Pseudo R2 drops significantly to 0.7, 1.7 and 1.1 % for nearest neighbour matching (NNM), kernel based matching (KBM) and radius matching (RM) respectively, from around 12 % before matching (Table 3).
Indicators of matching quality before and after matching

Source: Authors’ estimates based on survey data.
NNM, Nearest neighbour matching; KBM, Kernel based matching; RM, Radius matching.
The higher and significant likelihood-ratio (LR) before matching signifies the presence of systematic differences between the treatment and comparison groups. The insignificant p-value for LR after matching indicates that these differences have been removed making the two groups comparable.
Causal impact on livelihood security
Table 4 illustrates the distribution of households across different levels of livelihood security in both treated and control villages. The higher percentage of beneficiaries in the medium and high levels of livelihood security within the model fodder village suggests that interventions or support systems implemented there have effectively enhanced livelihood outcomes. In contrast, the larger proportion of households in the low-level security category among control villages indicates disparities in access to resources or support, resulting in poorer livelihood conditions compared to those in the model fodder village.
Livelihood security among sample households

Notes: Figures in the parenthesis are in the % of the column total.
The average treatment effects of forage based interventions in the targeted villages on the indices of various livelihood security are positive, however statistically significant for habitat, economic and food security parameters (Table 5). The magnitude of the estimated ATTs suggests that, relative to their counterparts, adopters have 14–19% higher likelihoods of experiencing improvement in their habitat security. Further, the impact on economic and food security ranges from 19–21 % and 13–16 % respectively.
Impact sof technological interventions on livelihood security indices (LSI) of farmers

* p < 0.01; **p < 0.05.
Integrating improved fodder production, conservation and utilization technologies into existing farming practices play crucial role in improving productivity potential of dairy animals. According to Sharma et al. (Reference Sharma, Choudhary, Singh, Kumar, Gupta and Dev2021), adopting improved forage technologies led to a notable rise in annual milk production (exceeding 950 litres) and daily milk yield (from 1.15 to 2.04 litres). This increase not only meets the self-consumption needs of farmers but also generates surplus milk for sale or processing into high-value dairy products such as ghee or khowa.
The e-Chara Kendra established in the targeted villages plays a key role in lowering transaction costs by facilitating access to resources, services, and information related to fodder production and milk marketing. By enhancing access to these essential elements, digital technologies greatly improve the efficiency and income of farmers in the treated villages. Choudhary et al. (Reference Choudhary, Sharma, Singh, Kumar, Gupta, Kantwa, Upadhyay, Wasnik, Prasad and Sharma2022) also highlighted the importance of improved fodder cultivation practices in increasing the technical efficiency of dairy farmers. The additional income thus generated has key role in improving economic as well as habitat security. Furthermore, the adoption of horti-pasture technologies in treated villages not only fulfills the demand for green fodder but also enhances the availability of seasonal fruits for consumption and sale, further augmenting food security and income levels. This finding is in congruence with Kumar et al. (Reference Kumar, Shukla, Singh and Satyapria2012). Together, these factors play a pivotal role in enhancing habitat, economic, and food security among farmers in the treated villages.
The study did not find significant impacts on health, education, and social security. These dimensions typically require long-term, cumulative interventions that extend beyond agricultural practices. While improvements in economic stability resulting from agricultural interventions can indirectly enhance access to healthcare and education, the effects are not immediate. For instance, health improvements, such as reduced morbidity or increased life expectancy, rely on broader healthcare infrastructure and sustained nutritional enhancements, which agricultural practices alone cannot fully address (Birkhaeuser et al., Reference Birkhaeuser, Evenson and Feder1991; Duflo, Reference Duflo2003). Similarly, educational outcomes like higher enrollment or literacy rates require changes in educational policies and infrastructure that are not directly influenced by farming practices (Basu and Van, Reference Basu and Van2012). Social security improvements, such as better access to safety nets or social protection programs, are often tied to broader government policies, which agricultural interventions may not directly impact (Ravallion, Reference Ravallion2013). Thus, while the immediate benefits of improved fodder technologies enhance economic and food security, the broader effects on health, education, and social security will likely emerge gradually as these economic gains contribute to wider social and policy changes.
Conclusions and policy implication
The study empirically analyzed the impacts of developing model fodder villages on the livelihoods of dairy farmers in the Bundelkhand region of Madhya Pradesh. It identified that the adoption of improved forage technologies is positively influenced by the education level of the household head and various farm and institutional characteristics. This underscores the need for a holistic approach to promote the uptake of improved forage practices among livestock keepers. Enhancing farmers' education can have multiplier effects on the economy, emphasizing the importance of strengthening rural public education systems. Additionally, initiatives like farmer field schools (FFS) and frontline demonstrations by local research institutes are essential for training dairy farmers in improved fodder production, conservation, and utilization. Promoting farmer coalition through fodder-based farmer producer organizations (FPOs) is crucial to safeguarding the interests of small dairy farmers. Strengthening market access and input support for dairy farmers will also be pivotal in increasing the adoption of improved forage technologies. For this, developing local and regional fodder markets for affordable, high-quality forage seeds and conserved fodder is important. Governments and NGOs should support small-scale fodder farmers through subsidies and financial aid, while incentivizing private investment in fodder production and storage. Partnerships between dairy organizations and input suppliers can ensure a steady supply chain. Additionally, offering affordable credit and digital platforms for market access will boost the adoption of improved forage technologies, improving dairy productivity and sustainability.
The model fodder village approach has significant potential for scalability and replicability across different regions, especially in areas facing similar challenges in fodder production and dairy farming. By creating localized hubs where farmers can access quality forage seeds, technical training, and storage solutions, this model can be adapted to diverse agro-ecological conditions. The approach's success in one region could be replicated by tailoring it to specific local needs, whether through regional partnerships, public-private collaborations, or leveraging digital platforms for market linkages. The scalability lies in the flexibility of the model to integrate various stakeholders, including government bodies, NGOs, farmer cooperatives, and agribusinesses, making it adaptable to both small-scale and large-scale dairy farming systems. Furthermore, with proper policy support and funding, the model can expand to other areas with similar socio-economic contexts, contributing to improved fodder availability, dairy productivity, and overall rural development.
Supplementary material
The supplementary material for this article can be found at https://doi.org/10.1017/S0022029925101040.