


Introduction
Democratic politics often confront citizens with undemocratic behavior (Banner Reference Banner2019). Recent examples include Donald Trump attempting to overturn the US 2020 presidential election, the Fidesz government’s closure of various Hungarian media outlets, and the Law and Justice party’s packing of the Polish Supreme Court. Although various democratic institutions can counter such actions, ordinary citizens are ultimately the final arbiters of democracy through their power to reject and remove undemocratic politicians.
Yet, according to existing research, citizens are willing to accept undemocratic behavior if they stand to gain from it politically. When asked in abstract terms, they profess to hold sincere democratic values (Sniderman et al. Reference Sniderman1989; van Ham and Thomassen Reference van Ham and Thomassen2017; Wuttke, Gavras, and Schoen Reference Wuttke, Gavras and Schoen2020; Reference Wuttke, Schimpf and Schoen2022), but when asked in more specific terms, they merely act as “questionnaire democrats” (Dalton, Shin, and Jou Reference Dalton, Shin and Jou2007): they are not willing to tolerate groups they dislike (Lawrence Reference Lawrence1976; Marcus et al. Reference Marcus, Theiss-Morse, Sullivan and Wood1995; Prothro and Grigg Reference Prothro and Grigg1960; Stouffer Reference Stouffer1955; Sullivan, Piereson, and Marcus Reference Sullivan, Piereson and Marcus1982), they are willing to restrict civil liberties for those they disagree with politically (Chambers, Schlenker, and Collisson Reference Chambers, Schlenker and Collisson2013; Crawford and Pilanski Reference Crawford and Pilanski2014; Lindner and Nosek Reference Lindner and Nosek2009; Wetherell, Brandt, and Reyna Reference Wetherell, Brandt and Reyna2013), and they are likely to vote for an undemocratic candidate as long as that candidate offers policies they desire (Carey et al. Reference Carey2020; Eggers Reference Eggers2014; Graham and Svolik Reference Graham and Svolik2020). When policy considerations conflict with democratic values, citizens often end up on the undemocratic side of the equation.
This begs the question, when citizens accept undemocratic behavior for political reasons, do they acknowledge that they are endorsing something undemocratic? Most studies seem to assume that citizens are aware that a given behavior is undemocratic, but due to general intolerance (Prothro and Grigg Reference Prothro and Grigg1960; Stouffer Reference Stouffer1955), lack of reflection (McClosky Reference McClosky1964), or calculated preference for a policy (Eggers Reference Eggers2014; Graham and Svolik Reference Graham and Svolik2020), deliberately accept such behavior with eyes wide open. Put simply, when citizens are confronted with undemocratic behavior they agree with politically, they are assumed to perceive the undemocratic behavior as undemocratic and still accept it to win politically.
This study advances an alternative argument. Citizens do not deliberately accept undemocratic behavior to gain politically but avoid this dilemma by rationalizing what they perceive to be democratic and undemocratic. Driven by the motivation to defend both their political views and their democratic values, citizens’ “perceptual screen” (Campbell et al. Reference Campbell, Converse, Miller and Stikes1960, 133) relieves them of unwanted conclusions about the state of democracy by altering how they understand democracy in a given situation. For example, a rationalizing citizen who favors stricter immigration policy might encounter a politician who acts undemocratically while implementing anti-immigration measures. But rather than accepting this as a necessary undemocratic cost to secure preferred policy, the citizen might simply perceive the behavior as complying with democratic principles. Reshaping democratic perceptions in such a selective fashion gives people leeway to align objectively undemocratic developments with subjective democratic values—or, as tellingly phrased, “a license to rationalize” (Gaines et al. Reference Gaines2007, 959). If this is indeed the case, previous studies still reach valid conclusions about citizens’ behaviors, but the underlying perceptual logic of such behavior would be very different from what we have assumed so far. People do not give up democracy in a calculating way to gain politically. Instead, they find ways to convince themselves that they are getting their desired policy and democracy. They still act as undemocratically as concluded in the literature; they just do not perceive it that way.
To test this claim, this study presents extensive evidence on the perceptual logic of democracy among ordinary citizens in democracies. A preregisteredFootnote 1 survey experiment on a representative sample of around 3,300 respondents in the United States directly examines how people perceive democracy and nondemocracy in situations where their policy preferences are at stake. The experimental design confronts respondents with fictional behaviors by politicians that randomly vary on both democratic behavior (regular versus undemocratic) and policy issues surrounding the behavior (e.g., pro-immigration or anti-immigration). Respondents then express, in various ways, how democratic they perceive the behavior to be, and they provide justifications for their answers in open-ended questions.
The results consistently demonstrate that many people rationalize their perceptions of democracy. When, say, right-wing respondents are confronted with regular right-wing behavior, they instinctively consider it to be much more democratic than identical left-wing behavior. Likewise, when confronted with undemocratic right-wing behavior, they do not seem to acknowledge that it is undemocratic, whereas identical undemocratic left-wing behavior is seen as highly undemocratic. Most astonishingly, right-wing respondents even consider undemocratic right-wing behavior equally democratic as (or more democratic than) regular left-wing behavior that does not violate democratic rules and norms. Importantly, democratic rationalization is consistent across the political spectrum from left to right, being equally strong among right-wing and left-wing citizens; it persists across individual characteristics such as age, gender, education, income, and vote choice; and it is robust to different prespecified understandings of democracy across respondents.
Moreover, lexical features in respondents’ open-ended answers show that the rationalization process follows the expected theoretical logic. Respondents bring democracy perceptions in line with their political views in two ways. First, they ignore the undemocratic behavior and transmit their policy agreement into their perceptions of democracy (termed “democratic transmission”). Second, they elevate their understanding of democracy from procedural rules and norms to what they think is good for the country (termed “democratic elevation”).
In order to ensure that such democratic rationalization is not simply an artifact of particular aspects of U.S. politics, the central part of the experiment was undertaken on representative samples of more than 28,000 total respondents in 22 democracies worldwide.Footnote 2 The results remain remarkably consistent across various political settings and cultures, revealing that democratic rationalization is a universal feature of modern democratic politics in today’s world. Yet the global results also reveal marked differences in the share of citizens in each country that engage in democratic rationalization. In troubled democracies with recent experiences of backsliding, people engage extensively in rationalization. In old, well-functioning democracies, people are less likely to do so.
In this day and age, when many democracies are facing challenges to core democratic institutions (Boese et al. Reference Boese2021; Foa and Mounk Reference Foa and Mounk2017; Hellmeier et al. Reference Hellmeier2021; Laebens and Lührmann Reference Laebens and Lührmann2021; Levitsky and Ziblatt Reference Levitsky and Ziblatt2018; Lührmann and Lindberg Reference Lührmann and Lindberg2019) and rising populist attitudes (Howell and Moe Reference Howell and Moe2020; Wuttke, Schimpf, and Schoen Reference Wuttke, Schimpf and Schoen2020), this is concerning news. If citizens do not agree on when a particular behavior crosses the “bright lines” (Carey et al. Reference Carey2019) of democratic rules and norms but rather identify undemocratic behavior based on their political views, we might face a markedly different democratic challenge than hitherto acknowledged. It is not simply about citizens’ low levels of tolerance, their inclination to accept restrictions on civil liberties for political opponents, or their willingness to trade off democracy for policy in the voting booth; it is more fundamentally about whether they even see themselves as supporting something undemocratic in the first place. Violations of democracy should, to quote Abraham Lincoln, “stink in the nostrils” (Oates Reference Oates1977, 275) of the citizenry in well-functioning democracies and induce people to reject such behavior. Unfortunately, this often does not happen because citizens let their political viewpoints color their democratic perceptions—allowing them to support violations of democracy without the odor of undemocratic behavior.
The Perceptual Logic of Democracy
Due to its status as an “essentially contested” concept (Gallie Reference Gallie1955), delimiting the borders of democracy—that is, outlining what types of behaviors are within and which are outside the bounds of democracy—is an intricate task. Democracy means different things to different people, and scholars have conceptualized various dimensions of democratic rule (Coppedge et al. Reference Coppedge2011; Reference Coppedge2020; Held Reference Held2006). Yet, as with many essentially contested concepts, democracy contains an undisputed core, or minimum definition, that is a part of virtually all existing competing understandings (Coppedge et al. Reference Coppedge2020, chap. 2; see also Munck, Møller, and Skaaning Reference Munck, Møller, Skaaning, Curini and Franzese2020). There is thus broad agreement on a set of core procedural rules and norms that must be respected in democratic politics (see Collier and Levitsky Reference Collier and Levitsky1997; Przeworski Reference Przeworski, Shapiro and Hacker-Cordón1999; Schmitter and Karl Reference Schmitter and Karl1991; Schumpeter Reference Schumpeter1942). This set of procedures has been summarized by Dahl’s (Reference Dahl1971; Reference Dahl1989) concept of polyarchy in a series of electoral and liberal attributes: (1) control over government by elected officials, (2) free and fair elections, (3) inclusive suffrage, (4) right to run for office, (5) freedom of expression, (6) freedom of information, and (7) freedom of association.
This is not to say that people cannot hold even more comprehensive understandings of democracy—for example, by including substantive aspects such as deliberation, participation, or effective governance. Yet even in these instances, there is broad consensus that Dahl’s (Reference Dahl1971; Reference Dahl1989) attributes constitute the procedural core to which additional elements can be added (see Coppedge et al. Reference Coppedge2020, chap. 2).Footnote 3 In other words, despite the prevalence of different conceptions of democracy, most would agree that Dahl’s (Reference Dahl1971; Reference Dahl1989) procedural attributes should be upheld in a democracy and that violating any of these is undemocratic.
Importantly, this definition is well in line with public understandings of democracy. Ferrín and Kriesi (Reference Ferrín and Kriesi2016) and Pérez (Reference Pérez, Ferrín and Kriesi2016) demonstrate that even though people hold various conceptions of democracy, almost all consider procedural attributes—such as free and fair elections—to be indispensable in their democracy definitions (see also Baviskar and Malone Reference Baviskar and Malone2004). Other survey findings suggest that most citizens can distinguish such procedural aspects of democracy from policy outcomes. For example, Knutsen and Wegmann (Reference Knutsen and Wegmann2016) conclude that the vast majority of the public consider democracy to be about free elections, civil rights, and gender equality rather than social policies such as subsidies for the poor or unemployment benefits. These findings suggest that despite holding various notions of democracy, citizens do agree on a core set of democratic procedures.
Rationalizing Regular and Undemocratic Behavior
In democracies, politicians engage in an array of activities: they hold press conferences, participate in public events, campaign for their candidacy, and put forth and vote for proposed laws, to name a few. Such behaviors are usually political in the sense that they seek to move the country in a particular policy direction—for example, by proposing to raise taxes or reduce immigration—and they usually comply with democratic procedures. An unbiased citizen should therefore see such behaviors as perfectly within the bounds of democracy—regardless of whether she agrees or disagrees with the political content of these actions. On the other hand, politicians could also engage in activities that violate procedural attributes of democracy. For example, they could restrict the right to run for office for a specific group or prevent them from speaking and assembling freely. An unbiased democratic citizen should see such actions as undemocratic regardless of whether she agrees or disagrees with the political content of these actions.
However, citizens will not necessarily perceive political behavior in such an objective and impartial manner. Research on cognitive dissonance has long recognized that when confronted with two incongruent cognitions, people can bring them into line with each other by changing their beliefs on one of these cognitions (Festinger Reference Festinger1957). When challenged with incongruent information, people often act as motivated reasoners and “rationalize the facts, figures, and arguments that they cannot effortlessly discount, depreciate, denigrate, or deny” (Lodge and Taber Reference Lodge and Taber2013, 59). They can do this through selective perception (Ceci and Williams Reference Ceci and Williams2018; Kahan Reference Kahan, Scott and Kosslyn2016), altering their perceptions of a given event in ways that fit better with their initial beliefs and motivations (see also Anduiza, Gallego, and Muñoz Reference Anduiza, Gallego and Muñoz2013; Hastorf and Cantril Reference Hastorf and Cantril1954; Kahan et al. Reference Kahan, Hoffman, Braman and Evans2012; Kunda Reference Kunda1990; Walter and Redlawsk Reference Walter and Redlawsk2019).
When conflicts occur between democratic values and political preferences, rationalization can occur in two ways. One way is through democratic transmission, where citizens ignore the democracy dimension of a given behavior and instead transmit their policy approval/disapproval into their democratic perceptions. This process is similar to what has been termed “thought suppression” (Wilson and Brekke Reference Wilson and Brekke1994) or “fact avoidance” (Gaines et al. Reference Gaines2007) in which rationalizers ignore conditions that create mental discomfort (Festinger Reference Festinger1957, 3).
For example, imagine a situation where a politician hosts a dinner for a pro-immigration advocacy group that works to increase the number of immigrants entering the country. This is not unusual behavior by a politician, and it violates no democratic rules or norms. Yet a rationalizing right-wing citizen would ignore the fact that the behavior is perfectly regular, transmit her disapproval of the left-wing immigration policy into her evaluation, and conclude that the behavior is undemocratic.
On the other hand, suppose instead that a politician hosts a dinner for an anti-immigration group. In this case, the same right-wing citizen would ignore the fact that the behavior is no more or less democratic than before, focus on the anti-immigration policy stance, and conclude that the event improves democracy in her country. The same logic would apply in a situation where a politician hosts a dinner for an anti-immigration group and acts undemocratically. In this case, the right-wing citizen would ignore the undemocratic behavior, focus on her approval of the anti-immigration policy, and not consider the behavior undemocratic.
In a nutshell, when rationalizing citizens are confronted with a given behavior, they can ignore whether or not it violates democratic rules and norms and instead transmit their approval or disapproval of the surrounding policy issue into their perception of how democratic the behavior is.
Another way citizens can justify their rationalizations is through democratic elevation, where they change the analytical level on which they evaluate democracy. Instead of assessing a given political behavior with respect to how it complies with one’s democratic principles, rationalizers can use more abstract yardsticks to form their judgments.Footnote 4 To understand how this works for perceptions of democracy, take Norris’s (Reference Norris2011) conceptual framework on political support as a point of origin. Norris (Reference Norris2011) divides political support into five different levels, from the most general to the most specific:
-
1. National identities (e.g., am I proud of my country?)
-
2. Approval of core regime principles and values (e.g., how important is democracy to me?)
-
3. Evaluations of regime performance (e.g., is democracy working well?)
-
4. Confidence in specific regime institutions (e.g., do I trust our politicians?)
-
5. Approval of incumbent officeholders (e.g., is our Prime Minister doing a good job?)
Usually, one should evaluate the democraticness of behaviors by focusing on the third and second levels: How democratic is this particular behavior (third level) and how does it compare to my democratic values (second level) (for application of this approach, see Carey et al. Reference Carey2019; Ferrín and Kriesi Reference Ferrín and Kriesi2016). Yet a rationalizing citizen might assess the behavior based on her feelings about her country (first level) instead.
For example, suppose a right-wing citizen is confronted with the hosting of a regular pro-immigration dinner. In that case, she might evaluate the behavior based not on democratic principles but instead on how the behavior makes her feel about her country. She might conclude that the behavior makes her country worse off—even though it is perfectly democratic—and what is bad for her country is bad for democracy. Likewise, suppose she is confronted with an anti-immigration politician acting undemocratically. In that case, she might rationalize that restrictive immigration policies—even if secured through undemocratic means—are good for her country and therefore good for democracy.
What takes place in this rationalization process is an elevation of principles in which political events are no longer evaluated based on specific democratic rules and norms but on abstract societal preferences. Instead of asking, “How does this behavior live up to my democratic principles?” a rationalizing citizen might ask, “How does this behavior change the political direction of my country?” By elevating their understanding of democracy from procedural rules and norms to what they think is good for the country, rationalizers can find a way to reach the desired conclusion of whether a particular behavior is democratic or not.
Observable Implications
Citizens thus find ways to bring democracy perceptions in line with their political views by ignoring undemocratic behavior and transmitting their policy agreement into their perceptions of democracy (democratic transmission) and/or by elevating their understanding of democracy from procedural rules and norms to being about what is good for the country (democratic elevation). This rationalization process is likely to lead to three types of observable perceptual biases.
First, we should expect a bias in how democratic/undemocratic citizens view regular behaviors. When a right-wing citizen is confronted with a regular right-wing policy behavior, she will perceive it as improving democracy. If faced with a similarly regular left-wing behavior, she will perceive it as worsening democracy. A left-wing citizen would react similarly in the opposite direction. In general terms, we should expect a regular behavior bias.
Regular behavior bias: Citizens consider a regular behavior they agree with politically to be more democratic than a regular behavior they disagree with—even though both behaviors are equally democratic.
Second, we should expect an undemocratic behavior bias as well. When a rationalizing right-wing citizen is confronted with an undemocratic right-wing policy behavior, she will not see it as worsening democracy, at least not to the same extent as if she were faced with a similarly undemocratic left-wing policy behavior. A left-wing citizen would react similarly in the opposite direction. In general terms, we should expect an undemocratic behavior bias.
Undemocratic behavior bias: Citizens consider an undemocratic behavior they agree with politically to be less undemocratic than an undemocratic behavior they disagree with—even though both behaviors are equally undemocratic.
Finally, taking the perceptual logic of rationalizers to its most far-reaching implication, we will likely see a comparability bias as well. That is, we should expect a right-wing citizen to perceive an undemocratic right-wing behavior to be as democratic or even more democratic than a regular left-wing behavior. Again, a left-wing citizen would react similarly in the opposite direction.
Comparability bias: Citizens consider an undemocratic behavior they agree with politically to be as democratic as, or more democratic than, a regular behavior they disagree with—even though the former is less democratic than the latter.
Alternative Understandings of Democracy
The argument put forward above rests on the assumption that policy is neutral for democracy. That is, whether a politician proposes to tighten or loosen immigration policy, favors higher or lower taxes, or works to implement or abolish Obamacare, these stances are all equally democratic—and citizens should consider them as such.
However, this is not necessarily a prudent assumption. Suppose a politician puts forward a perfectly regular policy proposal that seeks to tighten immigration. In that case, one could argue that curbing immigrants’ opportunities to enter the country violates inclusiveness and thereby hurts democracy. Likewise, suppose a politician puts forward a regular policy proposal that seeks to loosen restrictions on immigration. In that case, one could argue that welcoming more immigrants jeopardizes social order and the government’s ability to govern effectively and thereby worsens the functioning of democracy. In both cases, it would be possible to perceive one proposal as more democratic than the other without engaging in rationalization. Or put differently, citizens might not necessarily focus on whether a given behavior violates procedural aspects of democracy but rather base their perceptions on whether a given behavior is in line with other elements of democracy that they find essential.
Ultimately, this point hinges on a given citizen’s definition of democracy. If one understands democracy as, say, the presence of free and fair elections, both proposals above should be considered equally democratic. Yet if one understands democracy as inclusiveness or governing capacity, policy is often less neutral for democratic evaluations. Although existing research demonstrates that most citizens subscribe to procedural understandings of democracy (see e.g., Knutsen and Wegmann Reference Knutsen and Wegmann2016), rendering this alternative logic less applicable, some research still shows that different people hold different conceptions of democracy (Davis, Goidel, and Zhao Reference Davis, Goidel and Zhao2021; Oser and Hooghe Reference Oser and Hooghe2018) and that a minority of citizens understand democracy in more substantive terms (Baviskar and Malone Reference Baviskar and Malone2004; Pérez Reference Pérez, Ferrín and Kriesi2016). For example, substantive notions include a focus on majoritarian aspects of democracy (i.e., whether the electoral majority can govern effectively), participatory aspects of democracy (i.e., to what extent people participate in the political process), or deliberative aspects of democracy (i.e., whether people can engage in sober and considered public debate) (Coppedge et al. Reference Coppedge2011; Reference Coppedge2020; Held Reference Held2006; Mutz Reference Mutz2002). Such conceptions go beyond democratic procedures and emphasize the content of democracy, which, though still conceptually distinct from policy (see e.g., Coppedge et al. Reference Coppedge2020, 41–2), might make the fundamental distinction between democracy and policy less clear-cut for many citizens.
To account for such concerns, the empirical analysis below explicitly records how respondents understand democracy. This makes it possible to examine whether rationalizers hold particular conceptions of democracy, and it enables asking respondents to evaluate behaviors based on their predefined conceptions of democracy.
Research Design
The argument was tested in a preregistered survey experiment (Krishnarajan Reference Krishnarajan2022), administered through YouGov, on a representative sample (on gender, age, geography, education, and ethnicity) of around 3,300 respondents in the United States in October and November 2020. In addition, most important parts of the experiment were undertaken again in February 2021 on representative samples of between 900 and 1,500 respondents each in 22 democracies worldwide, totaling more than 28,000 respondents (see further below for a presentation of the global analysis). The following sections present the main experimental design undertaken in the United States.
The experiment randomly exposes respondents to different fictional events—presented in short vignettes—in which an unnamed senator has behaved in a specific manner. The behaviors take the form of either a concrete senator action or a senator policy proposal. The behaviors randomly vary on how democratic they are (regular behavior versus undemocratic behavior) and their political content (left-wing versus right-wing). That is, for a given political issue, the behavior can be (1) a regular left-wing behavior, (2) a regular right-wing behavior, (3) an undemocratic left-wing behavior, or (4) an undemocratic right-wing behavior. After reading the vignette, respondents answer how democratic they perceive the given behavior to be in general and how democratic they perceive it to be based on their individually prespecified understanding of democracy, and they provide justifications for their answers in open-ended questions.
Treatment Vignettes
In designing the vignettes, at least three crucial issues were addressed: realism, significance, and conceptual validity.
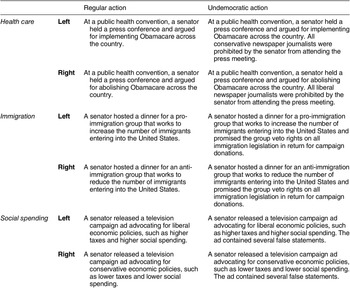
Realism: Respondents should be confronted with realistic behaviors that are likely to be experienced in everyday politics. For that reason, the vignettes include a diverse set of political issues—immigration, health care, and social spending—that are generally high on the political agenda. Moreover, current violations of democracy often take form as minor transgressions that in themselves do not destroy democracy but nonetheless constitute a clear breach of procedural rules and norms. The senator actions (see Table 1) are included in order to imitate such incremental violations that are frequently encountered in everyday politics. Across the three policy issues, the regular behaviors constitute typical events where the senator hosts a dinner for an interest group, holds a press conference, or runs a television campaign ad. The undemocratic versions add incremental violations of various procedural attributes of democracy: engaging in a corrupt quid pro quo transaction of money for political influence with an interest group, systematically excluding certain media outlets, and deliberately misinforming the public with false statements.
Treatment Vignettes, Senator Actions

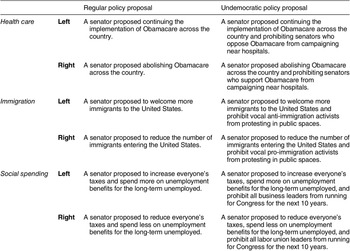
Significance: It is equally vital to include stimulus material that examines how citizens would react to attempts at full-fledged violations that might be rare today but could become a reality in the future. The senator policy proposals (see Table 2) are included to accommodate this goal. The regular versions are simple policy proposals that seek to move the three policy areas in a particular political direction. In contrast, the undemocratic versions add far-reaching violations of procedural attributes: systematic restrictions on peaceful protest, freedom to campaign, and the right to run for office.
Treatment Vignettes, Senator Policy Proposals

Conceptual validity: Regardless of how respondents initially understand democracy, it should be possible to make objective judgments about whether one type of behavior is more or less democratic than another. For that reason, differences between regular behaviors and undemocratic behaviors are made indisputably clear. All regular behaviors are within procedural democratic rules and norms: hosting a dinner for an interest group, discussing an issue at a press conference, releasing a campaign ad, or proposing certain immigration, health care, or public spending policies are not actions that change how democratic the country is. Likewise, all undemocratic behaviors in the vignettes are clear violations of various aspects of Dahl’s (Reference Dahl1971; Reference Dahl1989) seven procedural rules and norms. Engaging in a corrupt quid pro quo transaction with an interest group; systematically excluding certain media outlets; engaging in deliberative misinformation campaigns; or systematically preventing certain groups from peacefully protesting, campaigning, or running for office are all behaviors that move the country in a less democratic direction. The wide variety of undemocratic transgressions ensures that different aspects of Dahl’s (Reference Dahl1971; Reference Dahl1989) procedural attributes are covered. Table 3 summarizes these violations, and the Online Appendix provides a detailed discussion of each democratic violation (see Appendix H).
Undemocratic Behaviors in Vignettes and Violation of Procedural Attributes

Measuring Democratic Perception of Politicians’ Behaviors
After reading one of these vignettes, respondents are asked to answer a few questions. The first question is how much the respondent approves or disapproves of the senator’s behavior. This question is included as the first one to allow respondents to vent their appreciation of/frustration with the behavior before they are asked to consider its democratic merits. Had this question not been included, there might have been a risk that respondents would declare behaviors democratic/undemocratic not because they actively thought about the democraticness of the behavior but simply because they either liked or disliked it. With this initial question, respondents are more likely to think about democracy—and not something else—when answering the questions that follow.
The main outcome variable is measured by asking respondents whether they think the senator’s behavior makes the country more or less democratic. For senator actions, the question asks, “In your opinion, how does the senator’s behavior affect our democracy in the United States?” By asking in such general terms, it ensures that no matter how a given respondent understands democracy, she will answer the question based on her own democracy definition. After answering the question, respondents are asked to provide a brief explanation for their answer in an open-ended question, where they can freely write up their arguments. Such open-ended responses are crucial in examining how citizens muster up arguments that justify their democracy perceptions.
The final question directly accounts for respondents’ specific understanding of democracy by asking how the senator’s behavior affects their prespecified conception of democracy. That is, before reading any vignettes, respondents were asked to select the democratic attribute they find most important in a democracy. Inspired by the principles of democracy emphasized by Coppedge et al. (Reference Coppedge2011), respondents could choose one from among the following dimensions: (1) free and fair elections, (2) civil liberties, (3) the rule of law, (4) democratic equality, (5) public deliberation, (6) media freedom, (7) majority rule, or (8) democratic participation (see Appendix B2 for specific wordings). The selected democratic attribute then appears in the question wording of the final question. For example, suppose a respondent had selected “people can assemble and speak freely” as the most important aspect of democracy in their understanding. In that case, the question reads, “In your opinion, how does the senator’s behavior affect the extent to which people can assemble and speak freely in the United States?”
Each respondent goes through this process four times. That is, respondents read two senator actions—though not from the same political issue—and two policy proposals—again, not from the same political issue—and answer the above-described outcome questions after reading each vignette.
Measuring Political Opinions
Respondents’ political views were measured by recording their positions on social spending (increase or decrease taxes), immigration (loosen or restrict immigration), and health care (implement or abolish Obamacare). Answers on each policy issue were then combined into a left–right score ranging 0–12, where lower scores indicate more left-wing and higher scores more right-wing positions. The Online Appendix presents analyses with several alternative measurement strategies of respondents’ political opinions, all providing similar results (see Appendix C4). In addition, given that this variable is not randomly manipulated but rather observed (as is the case with most experiments examining the moderating effect of political opinions), the Online Appendix includes model specifications with controls for an array of potential individual-level confounders (see Appendix C6a). These yield very similar results as well.
Estimation Method
The main estimation strategy consists of ordinary least squares models and takes the following general form:
 $$ {D}_{i,k}={\displaystyle \begin{array}{l}{\unicode{x03B4}}_1{B}_{\mathsf{2}i,k}+{\unicode{x03B4}}_2{B}_{\mathsf{3}i,k}+{\unicode{x03B4}}_3{B}_{\mathsf{4}i,k}+{\unicode{x03C6} P}_i+{\unicode{x03B3}}_1{B}_{2\mathrm{i},\mathrm{k}}{P}_i\\ {}+\hskip2px {\unicode{x03B3}}_2{B}_{\mathsf{3}i,k}{P}_i+{\unicode{x03B3}}_3{B}_{\mathsf{4}i,k}{P}_i+{\unicode{x025B}}_{i,k}\end{array}} $$
for i = 1, … , n respondents and k = 1, …, n rounds, where
 $ {D}_{i,k} $
represents the outcome variable that contains respondents’ answers to how a given political behavior affects democracy in their country. It takes the form of a five-point variable, where 1 denotes that the behavior makes the country much less democratic and 5 denotes that it makes the country much more democratic. Otherwise,
 $ {\unicode{x03B4}}_1 $
is the coefficient for regular right-wing behavior (
 $ {B}_{2i,k} $
),
 $ {\unicode{x03B4}}_2 $
is the coefficient for undemocratic left-wing behavior (
 $ {B}_{3i,k} $
), and
 $ {\unicode{x03B4}}_3 $
is the coefficient for undemocratic right-wing behavior (
 $ {B}_{4i,k} $
). Regular left-wing behavior (
 $ {B}_{1i,k} $
) is not included and serves as the reference category. Additionally,
 $ \unicode{x03C6} $
is the coefficient for respondents’ left–right position
 $ {P}_i $
, ranging 0–12, where lower scores indicate more left-wing and higher scores more right-wing positions,
 $ {\unicode{x025B}}_{i,k} $
is the error term, and standard errors are clustered on respondents. Most importantly,
 $ {\unicode{x03B3}}_1 $
,
 $ {\unicode{x03B3}}_2 $
, and
 $ {\unicode{x03B3}}_3 $
are coefficients for the product terms
 $ {B}_{2i,k}{P}_i $
,
 $ {B}_{3i,k}{P}_i $
, and
 $ {B}_{4i,k}{P}_i $
, documenting how the effect of different vignettes varies across respondents with different policy positions. In other words, the product terms denote how the same political behaviors are perceived differently among respondents with different political views.
The main estimations include a total of 3,331 respondents and 12,043 observations. To ease interpretations, all results are presented graphically. The Online Appendix presents the full questionnaire (see Appendix B), documentation of preregistration (see Appendix A), and an array of robustness checks, which are discussed further below.
Main Results
Did people rationalize their understandings of democracy and nondemocracy? Figure 1 presents results from the main model—given in Equation 1—demonstrating how democratic perceptions of different behaviors gradually change conditional on political views.Footnote 5
Regular and Undemocratic Behavior Bias
Note: Upper panels present predicted values of democratic perceptions for regular (upper left panel) and undemocratic behaviors (upper right panel). Bottom panels show average marginal effects, i.e., the difference in democratic perceptions between left-wing and right-wing behaviors (frequency distributions given by bars).

Regular Behavior Bias
The upper left panel of Figure 1 provides clear evidence of regular behavior bias. Left-wing respondents perceive regular left-wing behaviors as markedly more democratic than regular right-wing behaviors—even though both behaviors are equally democratic—and right-wing citizens behave in a very similar manner in the opposite direction. Though strongest for respondents at the edges of each political spectrum, these biases are even present for moderates who lean either left or right.
The lower left panel of Figure 1 illustrates that these differences are substantial across the entire spectrum. For example, for both the most left-leaning respondents (which equals the bottom 10% on the left–right scale) and the most right-leaning ones (which equals the top 10% on the left–right scale), the perceptual difference in how democratic they consider the behavior they politically agree with to be compared with the behavior they disagree with is around 1. Given that the democratic perception measure ranges from 1 to 5—equaling a maximum potential difference of 4—the perceptual bias of these citizens is an estimated 25% of the potential difference. This is a substantial difference, especially when considering that this perceptual difference is between two almost identical behaviors that solely differ in terms of whether a left-wing or right-wing policy accompanies them (see Appendix I for various assessments of effect size).
Interestingly, such differences largely stem from variation in when people consider a behavior undemocratic. When confronted with a perfectly regular left-wing behavior, 48% of the right-wing citizens consider it to make the country “much less democratic” (see Appendix E). Conversely, when confronted with regular right-wing behavior, 46% of the left-wing citizens consider it to make the country “much less democratic.” In short, even though a given political behavior violates no democratic rules or norms, a substantial proportion of political opponents still consider it highly undemocratic.
Undemocratic Behavior Bias
The upper right panel of Figure 1 demonstrates the existence of undemocratic behavior bias. Citizens on average acknowledge that undemocratic behaviors are less democratic than regular behaviors. However, left-wing respondents perceive undemocratic left-wing behaviors as substantially less undemocratic than similar right-wing behaviors. Conversely, right-wing respondents perceive undemocratic right-wing behaviors as notably less undemocratic than similar left-wing behaviors.
The lower right panel of Figure 1 illustrates that these differences—though they might seem minor from first impressions—are substantial. For example, for both the group of most left-leaning respondents (bottom 10% on the left–right scale) and the most right-leaning ones (top 10% on the left–right scale), the difference in how they perceive an undemocratic behavior they agree with politically compared with undemocratic behavior they disagree with is around 0.5–0.6—that is, about 15% of the potential difference. Again, considering that the behaviors are almost identical and equally undemocratic, differing only in their political content, the magnitudes of these differences are noteworthy (see Appendix I for additional assessments of effect size).
Specifically, when leftists are confronted with undemocratic right-wing behavior, 62% of them perceive it to be highly undemocratic. When they are confronted with an identical left-wing undemocratic behavior, only 36% think so (see Appendix E). Conversely, when rightists are confronted with undemocratic left-wing behavior, 51% consider it very undemocratic, whereas only 27% perceive undemocratic right-wing behaviors as very undemocratic. Interestingly, when distinguishing between the incremental undemocratic behaviors in the senator action vignettes and the full-fledged violations of democracy of the senator policy proposal vignettes, it is evident that the perceptual biases between left-wing and right-wing respondents are markedly larger with respect to the policy proposal vignettes (see Appendices C2d–C2e). Seemingly, the more unambiguously clear the undemocratic violation, the more people polarize in their perceptions of how undemocratic it is.
Comparability Bias
To increase the visibility of the comparability bias, Figure 2 reports the same results as in Figure 1, with the only difference being that it compares undemocratic left-wing behaviors and regular right-wing behaviors (left panel) as well as undemocratic right-wing behaviors and regular left-wing behaviors (right panel).
Comparability Bias
Note: Same as Figure 1 with one difference: Upper left panel compares undemocratic left-wing behaviors and regular right-wing behaviors, and upper right panel compares regular left-wing behaviors and undemocratic right-wing behaviors.

The figure shows that citizens’ perceptual biases are so strong that they extend into a comparability bias. Left-wing respondents perceive undemocratic left-wing proposals as more democratic than or equally democratic as regular right-wing proposals. Conversely, right-wing respondents consider undemocratic right-wing proposals to be more democratic than or as democratic as regular left-wing proposals. These biases are not simply present at the poles of the political spectrum but exist even for citizens who simply lean either direction politically. Specifically, we see that left-wing respondents scoring between 0 and 3 on the left–right scale (totaling around 36% of all respondents) and right-wing respondents scoring between 9 and 12 (totaling around 30% of all respondents) do not acknowledge that an undemocratic behavior they agree with politically is less democratic than a regular behavior they disagree with politically. That is, an estimated 66% of all citizens engage in this extreme form of perceptual bias.
In summary, we see consistent support for all three perceptual biases. The Online Appendix presents an array of alternative specifications, including disaggregated results across each political issue and type of behavior (Appendices C2a–C2e); estimations with respondent random effects and round fixed effects (Appendix C3); alternative measures of left–right positions (Appendices C4a–C4e); models that do not assume linear interaction effects (Appendix C5); and models that both control for and undertake split-sample analyses across gender, age, education, income, and vote choice (Appendices C6a–C6f). All specifications yield similar conclusions.
The Rationalization Process
What arguments do respondents bring to bear when rationalizing democracy? As discussed above, respondents are asked to freely write up an explanation for why they find a particular behavior to be democratic/undemocratic after each round. These answers provide a unique opportunity to examine whether the rationalization process indeed follows the logic of the theoretical argument. Recall the two mechanisms: First, rationalizing citizens ignore democratic aspects of a behavior and transmit their policy disagreement/agreement into their democracy perceptions instead (democratic transmission); second, rationalizing citizens evaluate a given behavior based not on how it lives up to democratic rules and norms but instead on how it makes them feel about their country (democratic elevation).
Following the approach of Monroe, Colaresi, and Quinn (Reference Monroe, Colaresi and Quinn2008) for discovering lexical features of text, Figure 3 yields insights into how respondents muster up arguments for their democratic perceptions. Respondents’ complete sentences are broken up into single words, cleaned, lowercased, and stemmed. Higher values on the x-axis indicate that the word overall is used more frequently. The y-axis indicates a given word’s frequency difference between rationalizers (above the dashed line) and nonrationalizers (below the dashed line). The higher the values, the more a given word is used by rationalizers compared with nonrationalizers. The lower the value, the more a given word is used by nonrationalizers compared with rationalizers. Put simply, the upper right area shows more distinctive words for rationalizers; the lower right area depicts words that are more distinctive for nonrationalizers.
The Rationalization Process
Note: Horizontal axis denotes how frequently the word is used (also given by word size). Vertical axis denotes the difference in word usage between rationalizers (above the dashed line) and nonrationalizers (below the dashed line). The higher the values, the more a given word is used by rationalizers compared with nonrationalizers. The lower the value, the more a given word is used by nonrationalizers compared with rationalizers. Only words used more than 50 times in the sample are shown.

Figure 3 generally corroborates the perceptual argument put forward above. As is evident below the dashed line in Figure 3, nonrationalizers seem to focus on democracy by frequently invoking democratic procedural terms such as “senat,” “democraci,” “speech,” “campaign,” “prohibit,” “protest,” “freedom,” and “vote.” When respondents do not rationalize, they seem to focus on democratic procedural attributes and not much else.
In contrast, among rationalizers above the dashed line we see a remarkable absence of such democratic terms. Instead, rationalizers seem to do two things. First, following the logic of democratic transmission, they seem to fill the void by focusing on policy issues such as “immigr,” “tax,” “obamacar,” and “healthcar.” Second, following the logic of democratic elevation, they seem to elevate their evaluations to be about abstract societal principles such as “countri,” “people,” “citizen,” and “american.”
Despite providing only descriptive evidence, these patterns suggest that the thought process of rationalizers follows a consistent logic. Citizens rationalize by ignoring democratic aspects and transmitting their policy preferences into their democracy perceptions instead. In addition, they rationalize by comparing behaviors to abstract societal principles rather than democratic rules and norms.
Individual Democracy Definitions and Rationalization
Thus far, all analyses have examined how respondents perceive different behaviors with respect to their own implicit understandings of democracy. The main advantage of this approach is that it allows citizens to think of democracy as they wish, without forcing them to consider a specific democratic attribute. Still, as discussed above, one could argue that results can only credibly demonstrate rationalization of democratic perceptions if respondents explicitly do so based on their specific understandings of democracy.
Figure 4 presents the distribution of the attributes respondents found most important. The most selected attributes are free and fair elections,Footnote 6 civil liberties,Footnote 7 and political equality.Footnote 8 This suggests that most respondents conceive of democracy in procedural terms (though political equality can be seen as both a procedural and substantive dimension; see Appendix H). These findings are well in line with existing comparative survey research. They show that focusing primarily on procedural violations of democracy, as done in the vignettes, corresponds with most citizens’ predefined democracy understandings. Still, not all respondents conceive of democracy in such procedural terms, and even those who do might think of something other than democracy when answering the main outcome question. Rather than focusing on democracy, people might simply evaluate whether a given behavior is “normatively good” in their eyes. This section provides further examinations to ensure that citizens are actually thinking of democracy—particularly their understanding of democracy—when assessing the politicians’ behaviors.
Democratic Conceptions among Respondents
Note: Frequency distributions of respondents’ understanding of democracy given in percentages (see Appendix B2 for specific wordings).

Figure 5 used respondents’ prespecified understandings of democracy as the outcome variable, with everything else following the main specifications. To reiterate, if a respondent declares that she considers “elections are free and fair” to be the most important attribute for democracy, she will be asked how the given senator’s behavior affects the extent to which elections are free and fair in her country. Had she instead stated that “the media can report freely and without censorship” was the most important attribute, the survey would have asked how a senator’s behavior affects the extent to which the media can report freely and without censorship in her country. In many ways, this is a demanding test of the argument. One should think that explicitly mentioning a concrete democratic attribute induces respondents to focus more on democracy and less on the surrounding policy issues—ultimately reducing the propensity to rationalize.
Respondents’ Perceptual Bias Based on Their Democracy Definitions
Note: Same as Figure 1, with an alternative outcome variable.

However, as shown in Figure 5, these analyses produce robust conclusions. Even when respondents are questioned explicitly regarding their democracy understanding, they find ways to rationalize their democracy perceptions. This further corroborates that respondents evaluate politicians’ behaviors based on their democracy understandings rather than alternative yardsticks.
The Online Appendix (see Appendix D) provides additional analyses with various modifications to further assess the robustness of these conclusions. For example, it demonstrates that the results remain consistent when undertaking split-sample analyses for each specific democracy understanding. It also documents that the results even hold when respondents are exposed to violations of democracy on the democratic dimension they find most important. That is, when respondents who conceive of democracy as the presence of free and fair elections are exposed to behaviors that violate an electoral attribute of democracy, results are robust. Likewise, when respondents who conceive of democracy as the presence of civil liberties are exposed to behaviors that violate freedom of expression, information, and assembly, results remain consistent (for an overview of which behaviors violate which democratic attribute, see Table 3). This further affirms that citizens do focus on democracy—particularly their understanding of democracy—and when politicians violate those attributes, citizens still find ways to rationalize undemocratic behavior.
Rationalizing Democracy across the World
The most important parts of the main analysis were undertaken in 22 democracies worldwide, summarized in Table 4. These analyses serve various purposes. First and foremost, they provide a test of generalizability. Second, the global analyses provide yet another opportunity to assess whether rationalization occurs across respondents with various democracy conceptions. Finally, the global analyses enable examinations of how recent institutional developments on the country level affect rationalization. The included countries score “Free” on Freedom House’s combined democracy index (Freedom House 2021), with the exception of Hungary, India, and Mexico, which have all been relegated to “Partly free” status recently. Thus, this global sample provides a unique opportunity to examine the extent to which the main results can be found across a diverse set of democracies with various legacies, geography, culture, polarization, levels of populism, and recent instances of democratic backsliding.
Global Analysis Undertaken in the Following 22 Democracies

Note: Number of respondents included in the analyses are given in parentheses. All samples are representative on age, gender, and geography (as well as education in most countries). Survey responses were collected in February 2021.
The global analyses focus on two of the three issues studied above: social spending and immigration. Although the political conflict dynamics on these two issues vary from country to country, they are relatively salient in most democracies in the sample (compared with health care, which is more specific to American politics). Respondents were confronted with one randomly chosen senator’s policy proposal on immigration, one randomly chosen senator’s policy proposal on social spending, and one randomly chosen senator’s action on immigration (same vignettes as in Table 1 and Table 2 but with country-specific translations for each country). After reading each vignette, respondents answered how democratic they considered the behavior to be (same answer categories as above).
Before turning to the results, Figure 6 presents the distribution in democracy perceptions in the total sample of respondents across the 22 democracies. A clear majority of citizens across the various democracies understand democracy in procedural terms, particularly the presence of free and fair elections. In this particular analysis, respondents also had the opportunity to select two attributes regarding the political outcomes of democracy: that the economy is doing well and that the government redistributes wealth from the rich to the poor. These attributes were selected only among a small minority of citizens. In summary, these patterns further attest that citizens in democracies worldwide hold procedural understandings of democracy and can distinguish between democratic attributes and political outcomes (see Appendix F2 for distributions for each country separately).
Democratic Conceptions among Respondents in 22 Democracies
Note: Frequency distributions of respondents’ understandings of democracy across the 22 democracies given in percentages (see Appendix B3 for specific wordings).

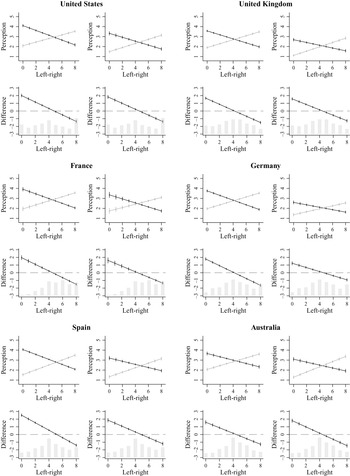
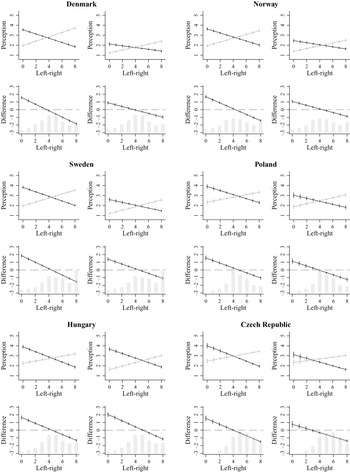
Despite these general patterns, citizens rationalize their democracy perceptions in the same manner as demonstrated above. Figures 7–10 show that the main results are remarkably consistent worldwide.Footnote 9 All three expectations—regular behavior bias, undemocratic behavior bias, and comparability bias (presented separately in Appendix F3)—are corroborated worldwide. The results are most substantial in large Western democracies (see Figure 7), and still consistent though slightly weaker in Eastern Europe and Scandinavia (see Figure 8) as well as Latin America and East Asia (see Figure 9). Notable exceptions are Taiwan and Tunisia, where results are statistically insignificant for right-wing citizens; India, where right-wing citizens consider both left-wing and right-wing behaviors less democratic; and Israel, where results are generally not consistent. We can only speculate why this is the case. One reason could be that the political issue of immigration is not only a domestic topic in these countries but instead holds geopolitical and security dimensions (e.g., the Israeli–Palestinian conflict), thereby lending additional complexities to the perceptual democracy-policy conflict.
Large Western Democracies
Note: Upper panels within each country-panel present predicted values of democratic perceptions for regular (upper left panel) and undemocratic behaviors (upper right panel). Black lines denote left-wing behaviors. Gray lines represent right-wing behaviors. Bottom panels show average marginal effects, i.e., the difference in democratic perceptions between left-wing and right-wing behaviors (frequency distributions given by bars).


Still, the overall pattern is consistent across various political settings. This suggests that the main results from the United States are not simply an artifact of specific political circumstances at the time of the experiment. Interestingly, the marginal effects are almost double in size (see bottom panels for each country in Figures 7–10) compared with the main analysis (see bottom panels in Figure 1). This further attests to the generalizability of the results, and at the same time, it highlights the conservative nature of the main experimental setup presented earlier. Note that the main analysis was undertaken in the United States during the 2020 presidential election—a period during which issues of election integrity, fake news, and freedom of speech were high on the agenda—perhaps leaving citizens more aware of violations of democracy than usual. The fact that effects seem significantly larger in other settings—including the additional analysis in the United States three months after the presidential election (see Figure 7)—suggests that potential biases in the main analysis are likely to have attenuated rather than inflated the results.
Figure 11 summarizes the global findings by presenting the share of citizens in each country who do not acknowledge that a behavior is undemocratic when exposed to undemocratic behavior they agree with politically. In many ways, this is the examination of the argument that has the most evident real-world implications. When confronted with the combination of democratic violation and political gain, people can show their consistency by acknowledging that the behavior is indeed undemocratic. Estimating the proportion of citizens who do not do so provides a concrete estimate of the size of the democratic challenge faced by each country.
Rationalization of Undemocratic Behavior across the World
Note: When respondents are exposed to undemocratic behavior they agree with politically, how many do not acknowledge that the behavior is undemocratic? Percentages across the world are given as circles, with 95% upper and lower confidence intervals.

Figure 11 shows that a worryingly high proportion of citizens in each country engage in rationalization. When faced with undemocratic behavior they agree with politically, more than half of the population in most countries does not acknowledge that the behavior is undemocratic. The estimated percentages are highest in countries with recent cases of democratic backsliding such as India,Footnote 10 the Czech Republic, Hungary, and Mexico (for studies on recent backsliding in these countries, see e.g., Csehi Reference Csehi2019; Ding and Slater Reference Ding and Slater2021; Pehe Reference Pehe2018). Still, even long-established Western democracies such as France and the United States have remarkably high proportions. More generally, there seems to be a clear correlation between the level of democracy in a given country and citizens’ propensity to rationalize undemocratic behaviors. In less democratic countries, citizens are more likely to rationalize undemocratic behaviors. In more democratic countries, citizens are less likely to do so (see Appendix F).
Discussion and Conclusion
This study presents concerning news for democracy: a significant proportion of ordinary citizens are inconsistent and biased when assessing politicians’ behaviors. They tend to rationalize their conceptions of what is democratic and undemocratic in order to gain politically and feel democratic at the same time—even in cases where the two are mutually exclusive. They do this to such an extent that they even consider an undemocratic behavior they agree with politically to be more democratic than a perfectly regular behavior they disagree with politically. These patterns are true not only in the United States but throughout the world. Democratic rationalization seems to be a universal feature of modern democratic politics.
The findings in this study also point to another important feature of democratic politics. People not only rationalize undemocratic behaviors; they even do so when confronted with perfectly regular behaviors. Citizens often consider regular behavior—which violates no democratic rules and norms—to be undemocratic if they disagree with it politically. Political disagreements are not just considered to be an expression of opposing political views but often penetrate our ideas of what constitutes the proper democratic rules of the game. In many ways, this is equally concerning from a democratic perspective. In today’s politics, we are seemingly so adamant in our political convictions that we tend to delegitimize opposing views by perceiving them as undemocratic—even when they are not.
Yet readers should also note important limitations of this study. First, the sole focus on how policy preferences induce citizens to rationalize their democracy perceptions leaves questions about whether the dynamics are similar with respect to partisan identities (see e.g., Dias and Lelkes Reference Dias and Lelkes2022; Mason Reference Mason2018; Tappin, Pennycook, and Rand Reference Tappin, Pennycook and Rand2020a; Reference Tappin, Pennycook and Rand2020b; Webster and Abramowitz Reference Webster and Abramowitz2017). Future studies are needed to further evaluate whether the dynamics are similar across partisan lines: Will partisans systematically perceive behaviors by their own party as being more democratic than those by other parties? Or do they use policy information as cues for partisan identity? Second, although this study delves into the thought process of respondents by examining how they justify their democratic perceptions, we still do not know whether the rationalization process occurs unconsciously or consciously. Perhaps democratic rationalization follows the logic of hot cognition (Lodge and Taber Reference Lodge and Taber2013) and is activated through unconscious thinking. It is also possible that citizens, given that democracy is an essentially contested concept, actively and systematically distort their democratic evaluations in specific situations where politics and democracy do not align. Third, despite all efforts to account for various understandings of democracy in this study, some people might hold more minimalistic notions of democracy and focus only on the competitiveness of elections (cf. Schumpeter Reference Schumpeter1942), whereas other people might think more expansively of democracy and include considerations regarding gender (see e.g., Funk, Paul, and Philips Reference Funk, Paul and Philips2022; Krizsan and Roggeband Reference Krizsan and Roggeband2018), race (see e.g., Jefferson Reference Jefferson2021), sexual orientation (see e.g., Barvosa Reference Barvosa2018), or religion (see e.g., Hajnal, Lajevardi, and Nielson Reference Hajnal, Lajevardi and Nielson2017; Hobbs and Lajevardi Reference Hobbs and Lajevardi2019). The focus on Dahl’s (Reference Dahl1971; Reference Dahl1989) procedural attributes in this study could thus potentially be either too minimalist or too maximalist to capture the perceptual democratic logics of all citizens (see Appendix H).
Despite these limitations, the findings in this study have far-reaching consequences for the functioning of today’s democracies around the world by providing an important alternative to understanding why citizens act the way they do. People often do not give up democracy in a calculating manner to gain politically. Instead, they find a way to convince themselves that they are getting democracy and their preferred policy. They accept undemocratic behavior because they do not perceive such behavior to be undemocratic. The challenges we face in many democracies are thus more formidable than hitherto acknowledged, as citizens do not even agree on when a particular behavior violates the democratic rules of the game. When violations of democracy are indisputably clear, many citizens find ways to not perceive undemocratic behavior as undemocratic if they agree with it politically. This might provide one explanation for why democratically elected leaders in today’s democracies are so often able to get away with violations of democracy without facing electoral backlash.
Supplementary Materials
To view supplementary material for this article, please visit http://doi.org/10.1017/S0003055422000806. Online Appendix can be found at the dataverse (see below).
DATA AVAILABILITY STATEMENT
Research documentation, Online Appendix, and data that support the findings of this study are openly available at the American Political Science Review Dataverse: https://doi.org/10.7910/DVN/WGPHFT.
ACKNOWLEDGMENTS
I thank Mathias Osmundsen, Kristina Jessen Hansen, Andrej Kokkonen, Jørgen Møller, Svend-Erik Skaaning, Annette Bruun Andersen, Kate Thulin, and Anne Pintz for valuable help and comments. Moreover, I thank participants at the following conferences and workshops: the Political Behavior Workshop in my department in 2021, the panel on Ordinary Citizens and Democratic Backsliding at the German Political Science Association’s biannual conference in 2021, the workshop Political Regimes and Their Correlates in 2020, the 2019 Berlin Democracy Conference, the 2019 ECPR workshop on State-Democracy Nexus, and the DPSA 2019 Comparative Politics Section. I am also grateful to the editors of the American Political Science Review and the four anonymous reviewers for their extensive and constructive comments.
FUNDING STATEMENT
This research was funded by the project Conflict and Democratization (Innovationsfonden, P-number: 1013137702), the Department of Political Science at Aarhus University, and the John Templeton Foundation.
CONFLICT OF INTEREST
The author declares no ethical issues or conflicts of interest in this research.
ETHICAL STANDARDS
The author affirms that this article adheres to APSA’s Principles and Guidance on Human Subject Research.






Comments
No Comments have been published for this article.