Implications
Plumage conditions reflect the actual health status of hens, as well as the outcome of their interaction with the housing environment and other birds. Feather cover quality is generally accepted as one of the animal-based welfare indicators. There is a continuous need to develop standardized methods of assessing animal welfare that are feasible for on-farm use. The IR thermography (IRT) represents one such tool. This study describes the experience with the assessment of plumage conditions in different housings using traditional feather scoring (FS) and IRT.
Introduction
Laying hens may lose a considerable proportion of their feathers because of feather pecking (Savory, Reference Savory1995) or abrasion and molting (Glatz, Reference Glatz2001). There is an increase in convective heat loss from birds with poor feather cover and thus an increase in heat production, feed consumption and decrease in egg production (Nichelmann et al., Reference Nicol, Caplen, Edgar and Browne1986; Mills et al., Reference Mills, Faure and Williams1988). Although plumage damage is an indirect measure of feather pecking, it is easier to assess than the behavior itself (Nicol et al., Reference Nicol, Bestman, Gilani, De Haas, De Jong, Lambton, Wagenaar, Weeks and Rodenburg2013). The quality of plumage may provide valuable information about the welfare status of laying hens in various housing systems. For example, significant differences in plumage condition have been shown in various cage systems by Tauson (Reference Tauson1984), who compared several conventional battery cage systems and found that cages with solid side partitions caused less feather abrasion compared with cage systems with wire mesh partitions. In cages, feather damage develops due to both abrasion and feather pecking, whereas in floor-kept birds, it is mostly caused by feather pecking (Tauson, Reference Tauson1984). Taylor and Hurnik (Reference Taylor and Hurnik1994) reported that caged hens had poorer feather cover and 39% of caged birds had denuded areas >5 cm2, whereas 68% of aviary hens had complete plumage. Mollenhorst et al. (Reference Mollenhorst, Rodenburg, Bokkers, Koene and De Boer2005) compared feather condition scores on 10 farms with battery cages and 10 farms with deep litter systems. The total feather condition score did not differ between housing systems. Analysis per body part, however, indicated that the wing and breast were more damaged in a battery cage system, and the head and underneck were more damaged in a deep litter system. Sherwin et al. (Reference Sherwin, Richards and Nicol2010) compared feather damage and other parameters in conventional cages, furnished cages, barn (indoor single-tier aviary) and free-range systems. Their study found that the prevalence of severe feather pecks received was highest in barn hens corresponding with barn hens with the highest feather damage score.
The commonly used method of feather cover assessment is FS, a visual evaluation of plumage on different parts of the body (Tauson et al., Reference Tauson, Ambrosen and Elwinger1984; Bilčík and Keeling, Reference Bilčík and Keeling1999; Welfare Quality®, 2009). Although this method is easy to use, it is relatively subjective, semi-quantitative and less repeatable. Two FS scorers may provide significantly different scores for the same bird despite both of the observers being trained under the same scheme (Tauson et al., Reference Tauson, Ambrosen and Elwinger1984). Another method used for feather damage evaluation is IRT. The principle of the IRT method is the direct measurement of heat loss in the IR spectrum resulting from poor feather cover. Cook et al. (Reference Cook, Smykot, Holm, Fasenko and Church2006) compared feather cover assessment by IRT and FS and concluded that the data derived from IRT provided a continuous variable that more accurately reflects either actual feather cover or areas of bare skin than the FS. Zhao et al. (Reference Zhao, Xin and Dong2013) also claimed that IRT is a promising tool providing more objective and quantitative evaluation of feather conditions of laying hens than FS. IRT was not only used for the assessment of feather cover in laying hens but also in broiler chickens. It was shown that featherless body regions reflected a higher surface temperature compared with feathered regions and the featherless areas responded faster to changes in air temperature (Nääs et al., Reference Nääs, Romanini, Neves, Nascimento and Vercellino2010).
The aim of our study was to validate the assessment of the feather cover quality of laying hens using IRT methods by evaluating plumage of hens kept under two housing conditions and compare the results with FS.
Material and methods
Animals
Dekalb White laying hens with trimmed beaks were obtained from a commercial supplier, where they had been kept in enriched cages at the age of 16 weeks. Half of the animals (n=15) were housed in enriched cages and the other half (n=15) were housed in deep litter pens. Enriched cages (STS Hostivice, Hostivice, Czech Republic) provided at least 750 cm2 space/hen and were equipped with a nesting area, dust bathing area, perches, feed trough, nipple drinkers and a claw-shortening device. Deep litter pens provided 1500 cm2 of floor space/hen covered with ~10 cm layer of wood shavings. Pens were fitted with the feed trough, nipple drinkers, metal nest box mounted on the wall (one of the pen walls was solid) and two perches installed at different levels. Plastic mesh walls had a bottom part that was covered by a black mat to prevent contact between animals from different pens. In all groups, water and food were provided ad libitum and the hens were kept under the 14 h light–10 h dark cycle (fluorescent tube, 15 lux).
Experimental design
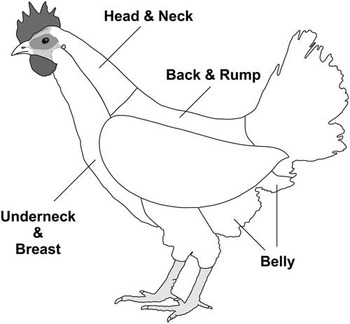
Feather assessment was performed regularly in 2-week intervals for 4 months after the start of the experiment (weeks 2, 4, 6, 8, 10, 12, 14 and 16 of the experiment) and one more single assessment nine and a half months after the start of the experiment (week 38 of the experiment). Each bird was scored using the FS system based on the Welfare Quality protocol (Welfare Quality®, 2009). Four body regions such as belly (B), back and rump (BR), head and neck (HN), and underneck and breast (UB) – were assessed (Figure 1). For each body region, a score was given on a three-point scale: 0 – no or slight wear, complete feather with only single feather missing; 1 – moderate wear, worn plumage or one or more featherless areas <5 cm in diameter; 2 – at least one featherless area ⩾5 cm in diameter at the largest extension.
Body regions used in feather cover quality assessment of laying hens (adapted from Bilčík and Keeling, Reference Bilčík and Keeling1999).

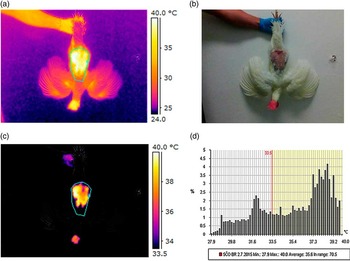
Feather cover was also estimated from the thermal images obtained by the IR camera (FLIR E5; FLIR System AB, Täby, Sweden). The thermal images of the frontal side, dorsal side (animals were held upside down) and ventral side of each bird were captured from a fixed distance of 1 m. The animals were held in front of a white wall without any sun reflections. The camera was fixed on a tripod, and the emissivity was set to 0.95 (Cangar et al., Reference Cangar, Aerts, Buyse and Berckmans2008; Nääs et al., Reference Nääs, Romanini, Neves, Nascimento and Vercellino2010). The actual room temperature was set on the basis of the thermo hygrometer (Klima Logger TFA 303015; TFA-Dostmann, Wertheim, Germany). IR images were analyzed using the FLIR Report Professional software. The regions of interest were delineated from the thermal image (corresponding to the regions defined for the FS) and the IRT mean temperature values were independently measured for each region. On the basis of IRT data, two parameters were used in further analyses: the temperature difference (ΔTB) and proportion of featherless areas (FL%). The ΔTB represents the difference in temperatures of the body region surface and ambient temperature. It was calculated to correct for the effect of ambient temperature (Cangar et al., Reference Cangar, Aerts, Buyse and Berckmans2008). The FL% was estimated as the number of pixels with the temperature above 33.5°C out of the total number of pixels in each of the selected regions (Figure 2).
Example of the IR image of laying hen from the dorsal view with the delineated back and rump region (a); corresponding digital image (b); IR image with the featherless areas selected by the software (c); and the histogram of the selected region and the calculation of the percentage of featherless areas in this region (percentage of pixels with temperature higher than 33.5°C in the selected region) (d).

Statistical methods
All of the statistical analyses were performed in SAS (version 9.04; SAS® University Edition, Cary, NC, USA). Data were analyzed using three-way repeated-measures ANOVA (Mixed procedure). Fixed effects included housing, body region, time spent in housing and all two- and three-way interactions. Time spent in housing was the repeated variable, with the individual hen nested in housing as the subject for the repeated statement. Tukey’s post hoc test was used to detect any pairwise differences between the variables across treatments. ΔTB and FL% parameters obtained by IRT were tested against the FS categories using two-way ANOVA. The Pearson’s coefficient of correlation was used to estimate the strength of the association between various feather damage parameters (FS, ΔTB and FL%).
Results
There was a significant effect of housing on the quality of feather cover, as measured by FS, as well as both parameters obtained from the IRT data – that is, ΔTB and FL% (Table 1). In general, the hens housed in the enriched cages had worse feather cover than the hens kept in the deep litter pens. There was also a strong effect of time on plumage deterioration as reflected by both of the methods used (Table 1). The effect of body region was highly significant in cases of all three parameters (Table 1). However, the amount of damage to various body regions differed as estimated by FS, ΔTB and FL%. All three parameters evaluated B as the most and HN as the least damaged region. Nevertheless, the B feather condition did not differ from the BR region as assessed by FS. However, while according to the ΔTB, the second most damaged area was the UB and then the BR. An estimate of feather cover condition by the FL% indicated that BR damage did not differ from the UB damage, but they both differed from the B and HN area.
Effects of housing, duration of housing treatment (weeks) and body region on plumage condition in laying hens as assessed using the feather score (FS) and IR thermography (mean temperature difference (ΔTB) and mean featherless area (FL%))

EC=enriched cages; DLP=deep litter pens; HN=head and neck; BR=back and rump; B=belly; UB=underneck and breast; RMSE=root mean square error that applies to the statistical model.
Values are least squares means.
a,b,c,d,e,f,gWithin row and within factor (housing, time in housing, body region) with different superscript letters differ (P<0.05).
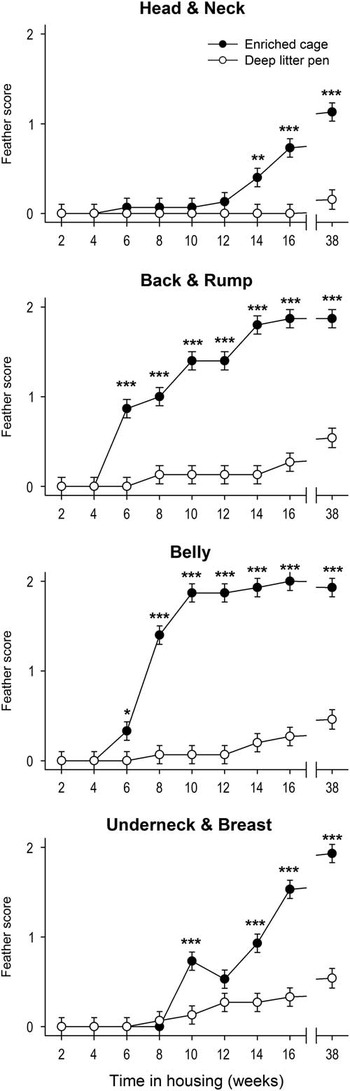
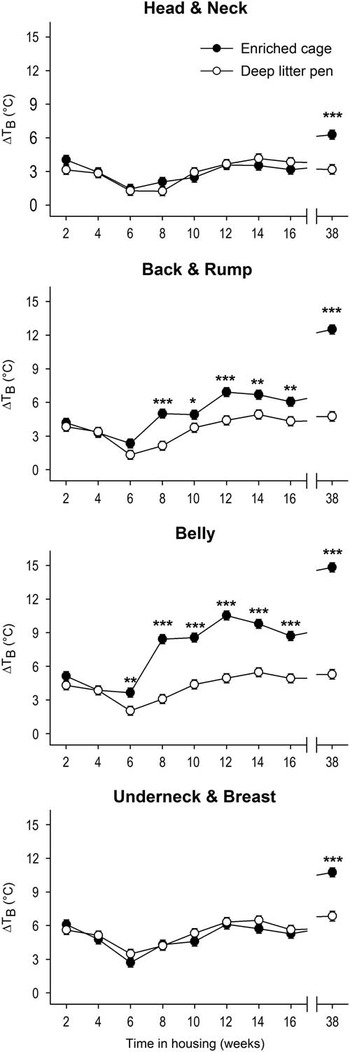
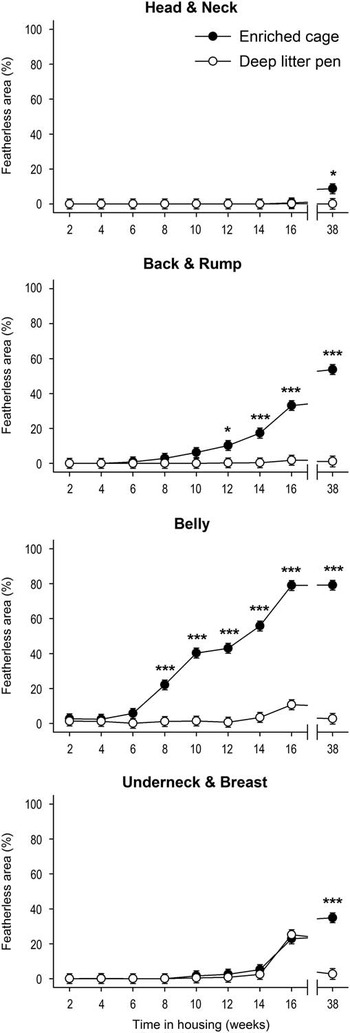
There was a significant effect of housing×time interaction on the FS, ΔTB and FL%. The feather damage of the B and BR region were significantly higher in caged hens from week 6 of the experiment as assessed by the FS, and the B from week 6 and the BR from week 8 as assessed by the ΔTB (Figures 3 and 4). Assessment of FL% areas by the IRT showed significant differences between the cage and deep litter environments in the B region from week 8 and in the BR from week 12 (Figure 5). The FS method indicated significant differences in feather cover between the housings in the HN region from week 14 until the end of the experiment and in the UB region from week 10 (except week 12, when only a trend was observed; Figure 3). Both IRT parameters showed minor damage and no significant differences between groups in the HN and UB regions. Only the last assessment in week 38 of the experiment based on the ΔTB and FL% showed the feather cover condition of the hens from enriched cages in the HN and UB region inferior to those of the deep litter kept hens (Figures 4 and 5).
The assessment of the feather cover quality of laying hens in enriched cages and deep litter pens in four body regions using feather scoring. Points represent the least squares means±SE. *P<0.05, **P<0.01, ***P<0.001.

The assessment of the feather cover quality of laying hens in enriched cages and deep litter pens in four body regions using the temperature difference between measured surface temperature and ambient temperature (ΔTB). Points represent the least squares means±SE. *P<0.05, **P<0.01, ***P<0.001.

The assessment of the feather cover quality of laying hens in enriched cages and deep litter pens in four body regions using the percentage of featherless areas calculated from the thermal images. Points represent the least squares means±SE. *P<0.05, ***P<0.001.

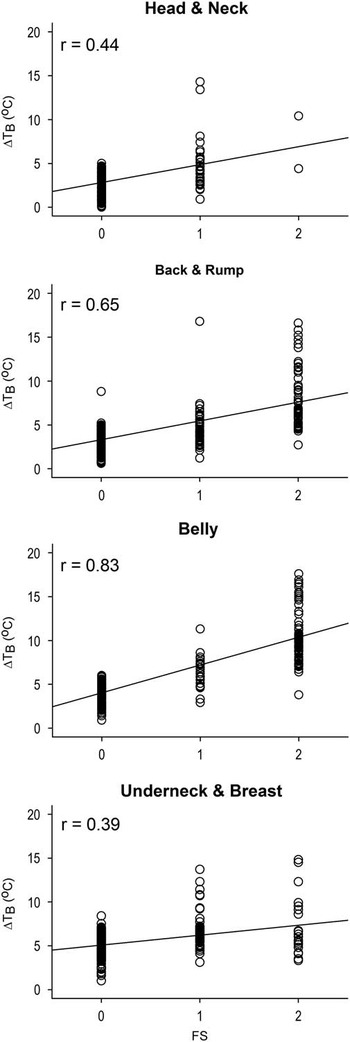
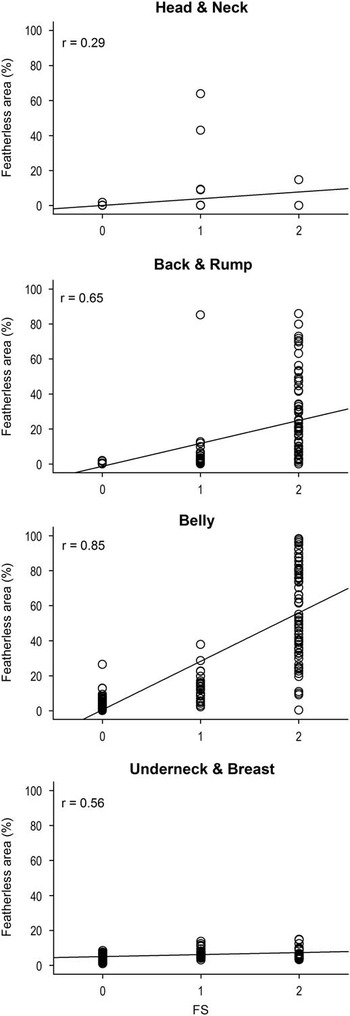
The distinct FS categories resembled the specific mean ΔTB. In case of the HN, BR and B there were clear differences between the mean ΔTB corresponding to each of the FS categories. In case of the UB, the mean ΔTB corresponding to the FS 0 did not differ from the FS 1, but they both differed from the FS 2. The ΔTB in all assessed body regions was positively correlated with the FS (HN, r=0.44; BR, r=0.65; B, r=0.83; UB, r=0.39; P<0.001 for all) (Figure 6). Again, there was lower correlation with the less damaged regions (HN and UB). The larger featherless areas in all body regions, as reflected by the FL%, were associated with a higher score. In this case, in the B and UB regions, there was a distinct proportion of featherless areas associated with each point of the FS scale, whereas in case of the HN and BR regions, FS 0 did not differ from FS 1. The FS and FL% were positively correlated (HN, r=0.29; BR, r=0.65; B, r=0.85; UB, r=0.56; P<0.001 for all) (Figure 7).
Association between the feather score (FS) and ambient temperature (ΔTB). Each circle represents ΔTB of an individual hen classified by the given feather damage score.

Association between feather score (FS) and the percentage of featherless areas. Each circle represents percentage of featherless areas of an individual hen classified by the given feather damage score.

Discussion
The results of our experiment demonstrated that IRT is an objective and feasible method for the feather cover assessment of laying hens kept in different housing systems. During the 1st month of the experiment, most of the hens had no or very little feather wear on all body regions. Low feather wear was caused by a short stay in a particular environment, as well as by the relatively low age of hens. Starting from week 6 of the experiment, rapid changes in the feather condition, particularly in the B and BR regions, were observed in hens kept in enriched cages. Quick progression of plumage deterioration in these regions was indicated by both the FS and ΔTB. The development of feather damage in these regions showed a similar pattern; in both regions, rapid feather cover worsening was observed in enriched cages and it was significantly faster than in hens from the deep litter pens. The time course of feather damage, as well as the most affected regions, are consistent with Bilčík and Keeling (Reference Bilčík and Keeling1999). Tauson et al. (Reference Tauson, Ambrosen and Elwinger1984) also described the B and BR as regions with early feather deterioration. Norgaard-Nielsen et al. (Reference Norgaard-Nielsen, Vestergaard and Simonsen1993) found that the back of laying hens were the most frequently affected by feather pecking.
Data on feather damage to different body regions differed between authors, reflecting variation in the number of assessed regions and their delineation, in the scoring system or in the details of the IRT measurement, breeds or housing. Surface temperature changes in time are dependent on the number and quality of the feathers in different places, which act as an insulation layer (Cangar et al., Reference Cangar, Aerts, Buyse and Berckmans2008). Zhao et al. (Reference Zhao, Xin and Dong2013) assessed the feather cover of laying hens by IRT independently in regions with excellent feather and no feather cover. Laying hens with excellent feather cover had higher surface temperature on the head, breast, belly, and front neck and crop, indicating a thinner insulating layer, and lower surface temperature on the dorsal neck and back, indicating a thicker layer. Temperatures of different body parts with no feather cover were relatively close. In contrast, Cangar et al. (Reference Cangar, Aerts, Buyse and Berckmans2008) using the IRT in broilers observed the lowest temperatures on the wings and breast, concluding that these are locations with the thickest feather cover. A potential explanation of the contradictory results (e.g. in case of breast) could be the difference between the laying hens and broilers.
Nevertheless, using the FS approach, Mills et al. (Reference Mills, Faure and Williams1988) found that the feather damage to different body regions in laying hens and broiler breeders at 52 weeks of age did not substantially differ. In both cases, the breast was the most damaged region, whereas the back was the least damaged region in laying hens and second least damaged region in broiler breeders. Using their specific FS system in a relatively small group of laying hens kept in experimental deep litter pens between 18 and 32 weeks of age, Bilčík and Keeling (Reference Bilčík and Keeling1999) identified significantly worsened feathering on the back, rump and belly, that closely resembled our results with birds kept in similar experimental deep litter pens. Conversely, Mollenhorst et al. (Reference Mollenhorst, Rodenburg, Bokkers, Koene and De Boer2005) used the same FS method of Bilčík and Keeling (Reference Bilčík and Keeling1999) in on-farm conditions. In laying hens kept on deep litter (median age 50 weeks, median flock size 4470 birds), the most damaged feathers were underneck, neck and tail. In battery cages (median age 41 weeks, median flock size 27 841 birds), the most damaged feathers were breast, tail and neck. The FL% parameter derived from the IRT measurement indicated significant differences between the housing groups in the B and BR regions from week 8 and week 12 of the experiment, respectively. The differences between FS and FL% were due to the FS, which includes all stages of feather damage, and the FL% parameter reflects only the completely defeathered areas. Thus, the ΔTB is another parameter obtained from the IRT measurements that provides results analogous to FS because it reflects the heat loss caused by a wider range of feather damage (including scruffy and sporadically missing feathers) compared with FL%.
In contrast to the FS method, the IRT-based parameters indicated only minor plumage differences between the housing groups in the HN and UB regions. There are several potential explanations for this finding. The first explanation can be the varying position of the head during the capture of IRT thermal images. Some positions of the hen neck could hide the less feathered areas. The second potential cause of a lower association between the FS and IRT measures of feather damage may be an overestimation of feather damage in the HN and UB regions by the assessors. Lower consistency of scoring between different assessors is one of the general disadvantages of FS method (Tauson et al., Reference Tauson, Ambrosen and Elwinger1984; Forkman and Keeling, Reference Forkman and Keeling2009). A slower decrease in the feather quality in the HN was not unexpected because the damage in this body region is usually described as a consequence of aggressive attacks aimed at the head (Savory, Reference Savory1995) or upper part of the body (Keeling, Reference Keeling1995). However, there was very little aggressive behavior observed in any of our groups.
Differences in time when feather damage in different regions became apparent may be the consequence of the accessibility of the body part to feather pecking (Leonard et al., Reference Leonard, Horn and Fairfull1995), which is also dependent on housing design. Abrasion of the plumage against cage walls may be a cause of lower feather quality in laying hens (Abrahamsson, Reference Abrahamsson1996). The loss of feathers due to wear against the environment was rather small in deep litter pens, which most likely contributed to the slower progress of plumage deterioration in these animals. Nevertheless, according to Hughes and Michie (Reference Hughes and Michie1982), even in cages, the most damage is caused by feather pecking by cage mates or hens from adjacent cages rather than by abrasion. In an environment where the animals are not able to perform the whole repertoire of their natural behavior (e.g. ground pecking or foraging behavior in cages with a wire mesh floor) may contribute to the occurrence of feather pecking and consecutive feather deterioration (Wood-Gush and Rowland, Reference Wood-Gush and Rowland1973). Nevertheless, birds with the possibility to behave more naturally might be negatively affected by their environment after a longer period of time (Nicol et al., Reference Nichelmann, Baranyiova, Goll and Tzschentke2009). Plumage condition can also be negatively affected by age and egg production (Hughes, Reference Hughes1983; Tauson, Reference Tauson1984).
The surface temperature ranges obtained in this study (data not shown) were higher than those reported by Cook et al. (Reference Cook, Smykot, Holm, Fasenko and Church2006) and lower than those reported by Zhao et al. (Reference Zhao, Xin and Dong2013). This variation presumably emerged from the differences in ambient temperature. The exposure to elevated ambient temperature increases blood flow to the skin, particularly to the non-feathered areas, as a result of vasodilatation (Wolfenson, Reference Wolfenson1986; Yahav et al., Reference Yahav, Luger, Cahaner, Dotan, Rusal and Hurwitz1998). To eliminate the effect of environmental temperature during IRT, measurements should be performed under thermoneutral conditions (air temperature 21°C±1°C, relative humidity 40%±5%) after at least 30 min of adaptation (Tao and Xin, Reference Tao and Xin2003). However, this is not possible under commercial conditions. Thus, to minimize the effect of ambient temperature on heat dissipation, we used the ΔTB, which represents the difference of measured surface temperature and the temperature, the measure used by several authors (Cangar et al., Reference Cangar, Aerts, Buyse and Berckmans2008; Nääs et al., Reference Nääs, Romanini, Neves, Nascimento and Vercellino2010).
Our data, similarly to those of Cook et al. (Reference Cook, Smykot, Holm, Fasenko and Church2006) and Zhao et al. (Reference Zhao, Xin and Dong2013), showed a strong association between the IRT and FS. Our data showed that the correlation between the FS and ΔTB in HN and UB regions was lower compared with other body regions, which was most likely caused by lower feather damage in these regions. Another source of differences between the FS and IRT parameters is the fact, that the relationship between temperature and the FS is quadratic (Cook et al., Reference Cook, Smykot, Holm, Fasenko and Church2006; Cook and Schaefer, Reference Cook and Schaefer2013). Cook et al. (Reference Cook, Smykot, Holm, Fasenko and Church2006) also found that the relationship between the mean image temperature obtained by the IRT and FS was dependent on the direction of the capture. They were statistically stronger for the dorsal and ventral views relative to the front view.
FS is an accepted animal-based indicator of the welfare of laying hens. We showed a highly significant positive relationship between the IRT (ΔTB and FL%) and FS assessment of feather cover. Our findings support the feasibility of IRT assessment of feather cover quality in laying hens. An adoption of thermal imaging technology enables the reliable measurement of plumage quality and avoids the problems of FS method such as the reliability of data obtained by different assessors. However, the use of IRT in commercial conditions requires further standardization of the methodology to obtain consistent data.
Acknowledgments
The authors gratefully thank Helena Rojcikova, Mariana Macajova, Monika Burikova, Maria Horvath and Daniela Blahutova for their technical assistance and help with animal care and Martin Valachovic for the critical reflections of this study. This work was funded by a grant obtained from the Scientific Grant Agency of the Ministry of Education of the Slovak Republic and of Slovak Academy of Sciences VEGA 2/0196/14.