INTRODUCTION
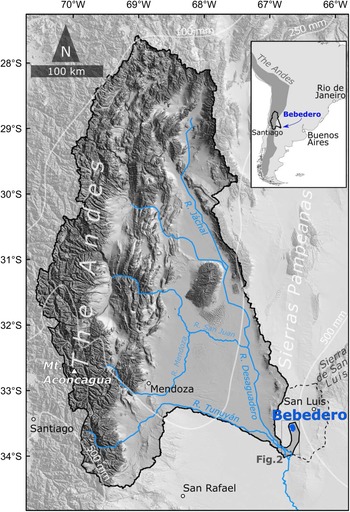
Salinas del Bebedero is located in central Argentina at 33.5°S and occupies the center of a shallow basin formed by recent intermontane thrust-faulting along the southern tip of the Sierras Pampeanas (Fig. 1). At present, the salt pan at the basin center is only seasonally wet, and it contains Argentina's largest commercially mined halite deposits. Surrounding the basin are vestiges of ancient shorelines (Fig. 2) that indicate water intermittently filled the basin, forming lakes up to ~30 m deep and ~550 km2 in area. These features attracted the attention of early workers (e.g., Déletang, Reference Déletang1929), but González (Reference González and Yrigoyen1981) was the first to study them systematically. Since then, there have been several shallow coring efforts (PEP 1 transect; Markgraf et al., Reference Markgraf, Baumgartner, Bradbury, Diaz, Dunbar, Luckman, Seltzer, Swetnam and Villalba2000; Rojo et al., Reference Rojo, Paez, Chiesa, Strasser and Schäbitz2012) and descriptions of the rich aquatic fauna and flora in the basin have been published (González and Maidana, Reference González and Maidana1998; García, Reference García1999; Rojo et al., Reference Rojo, Paez, Chiesa, Strasser and Schäbitz2012). Research is hampered, however, by sparse age control, lack of precise location and elevation information, and most importantly, the absence of a clear stratigraphic and paleohydrologic framework for the deposits. Our focus in this paper is on the surface exposures of lake and fluvial deposits, and we systematize the stratigraphy, improve the age control, and test hypotheses about the origins of water entering the basin, thereby creating a firmer basis for interpreting the deposits paleoclimatically.
Inset map in top right shows the general location of the study area within southern South America. Larger map shows the drainage basin of the Río Desaguadero outlined by a solid black line, and the catchment of the Salinas del Bebedero (dashed line) near the city of San Luis, Argentina, based on the SRTM 3-arc seconds DEM. Present-day isohyet contours (mm/year) are marked in white (modified from the WorldClim database v2, https://www.worldclim.org/data/;accessed on April 10, 2021; Hijmans et al., Reference Hijmans, Cameron, Parra, Jones and Jarvis2005). Water features indicated in blue. Location of Figure 2 framed in gray.

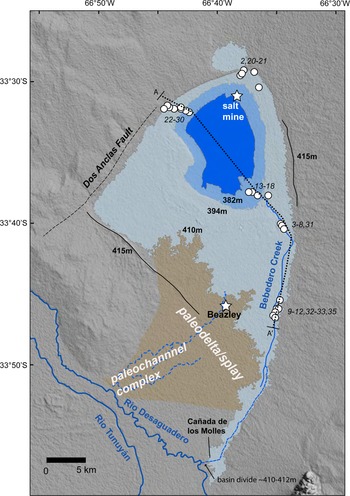
The Salinas del Bebedero study area showing: locations of the Dos Anclas salt mine, the small town of Beazley, stratigraphic section locations indicated by numbered circles (‘BD-##’ sections and samples in text), outlines of main shorelines (dark blue indicates modern playa at 380–381 m asl, light blue indicates up to the 394 m asl shoreline, gray marks the 410–412 m asl ‘high shoreline,’ solid black lines indicate 415 m asl shoreline remnants), paleodelta from overflow of the Río Desaguadero indicated in brown, active fault trace as a dashed line, and rivers and creeks discussed in text, indicated as solid and dashed blue lines. The location of the cross section found at the bottom of Supplemental Figure 3a is indicated as a dotted line labeled A–A'.

An unusual aspect of the Bebedero Basin is that at present, there are no major rivers feeding into the basin to support large lakes. Currently, local runoff from within the ~7500 km2 basin (Supplemental Figure 1) and springs formed by leakage from the shallow water table are only sufficient to support a seasonal lake that is a few meters deep. Previous authors (Déletang, Reference Déletang1929; González, Reference González and Yrigoyen1981) speculated that the source of moisture to Bebedero paleolakes was from periodic spillover from the nearby Río Desaguadero. The Río Desaguadero flows west and southwest of the Bebedero Basin, and the two are separated by a drainage divide that is presently 4–5 m above the Río Desaguadero channel bottom. (Fig. 2). The possibility of natural flooding across the drainage divide is important because, if correct, the main source for major inflow into the Bebedero Basin is not from local rainfall but from discharge from the midlatitude (28–34°S) Andes, which the Río Desaguadero drains. The true source of water and sediment in the Bebedero Basin through time is a key issue that we test using several methods in this paper.
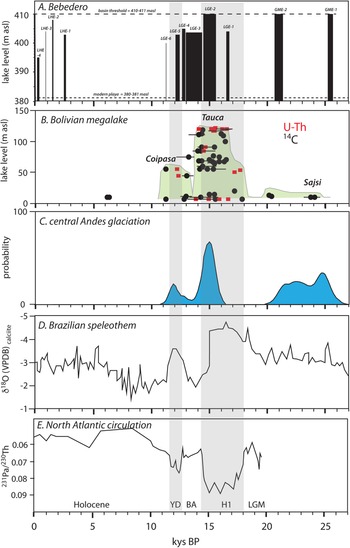
Whatever the exact source of the water and sediment at Salinas de Bebedero, documentation of the basin history would fill a major geographic gap in paleoclimate records from midlatitudes east of the Andes and serve as a comparison to records from other desert regions to the north and south. For example, deserts to the north of Bebedero in southern Bolivia (19–21°S) periodically hosted large water bodies and witnessed major flooding, probably the result of southward displacement of the subtropical rainfall belt partly related to North Atlantic cooling events (e.g., Placzek et al., Reference Placzek, Quade and Patchett2013; Baker and Fritz, Reference Baker and Fritz2015). Careful study of the deposits at Bebedero provides the opportunity to test whether these displacements of the rainfall belt were synchronous with other subtropical records, and therefore extended as far as 33°S.
Geological and hydrological setting
The Bebedero Basin is located at the southern edge of the Sierras Pampeanas, a series of block uplifts mainly bounded by east-verging thrust faults. The basin lies off the southwest tip of one of these basement-cored blocks, the Sierra de San Luis. Rocks in the Sierra de San Luis are Neoproterozoic and Paleozoic metamorphic and granitoids (Sims et al., Reference Sims, Ireland, Camacho, Lyones, Pieters, Skirrow, Stuart-Smith, Miró, Pankhurst and Rapela1998; Steenken et al., Reference Steenken, Wemmer, Martino, López de Luchi, Guereschi and Siegesmund2010). The grusy derivatives of these rocks form a broad alluvial apron that extends across the northern end of the Bebedero Basin. The basin itself appears to be a structural downwarp and is partially bounded by the Dos Anclas fault, which is marked by a prominent scarp bounding the northwest side of the basin (González, Reference González and Yrigoyen1981; Fig. 2).
The Bebedero Basin is shallow and broad, with surface exposures mainly limited to young fluvio-lacustrine deposits and capping eolianites. The northeast corner of the basin includes a small area of the southwest portion of the Sierra de San Luis that is underlain by Devonian granite (Supplemental Figure 1). The hydrographic basin covers a comparatively small area of 7750 km2, and the modern playa in the basin bottom covers ~70 km2 (Supplemental Figures 1, 2) and is seasonally inundated in water. The only perennial inflow to the basin is from Bebedero Creek, which enters the basin in the southeast corner. Bebedero Creek drains the low-lying area to the south of the playa and is largely fed by springs supported by a shallow water table across the area. Bebedero Creek almost continuously dissects older lake and alluvial deposits along its ~40 km length. The 3–5 m-deep exposures along the creek walls are the main focus of our study (Fig. 2). The lake and wetland deposits exposed in the canyon walls of Bebedero Creek are rich in a variety of preserved aquatic mollusk shells that provide excellent material for radiocarbon dating.
The neighboring Río Desaguadero is major source of potential discharge into the basin if flood flow in the past periodically overtopped the low drainage divide between it and the Bebedero Basin to the west and north (Figs. 1, 2). The Río Desaguadero basin extends almost 800 km north of this area, draining the east face of the Andes between ~28°S to 34°S. The highest points in the catchment reach >5500 m asl (including Mt. Aconcagua, the highest peak in the Andes at 6,961 m asl), primarily in the Eastern Cordillera of the Andes. In its headwaters, the Río Desaguadero drains many late Cenozoic volcanic rocks in the Andean magmatic arc, as well as Paleozoic igneous and sedimentary rocks of the frontal and pre-Cordillera. Older (Precambrian through Devonian) basement rocks exposed in the Sierras Pampeanas shed sediment into the Río Desaguadero. This same type of basement rock is also found in the Sierra de San Luis (Fig. 2) and dominates local sediment inputs into the northern side of the Bebedero Basin itself.
Climate and vegetation
Salinas del Bebedero and its potential recharge areas from 28–34°S lie in the subtropics, a region of generally semi-arid to arid climate. In the nearby city of San Luis, mean annual daily average temperature is 16.8°C (range 9–24.1°C), and mean annual rainfall is 580 mm/yr. Most rain falls in the austral summer months from November–March and is borne by the easterlies under the influence of the South Atlantic anticyclone (Prohaska, Reference Prohaska and Schwerdtfeger1976). Lake evaporation rates are ~1.2 ± 0.2 m/yr estimated using an average of four evaporation models (Harbeck, Reference Harbeck1962; Kutzbach, Reference Kutzbach1980; Brutsaert, Reference Brutsaert1982; Hastenrath and Kutzbach, Reference Hastenrath and Kutzbach1983). Vegetation in the area is Monte-Espinal thorn-scrub and grassland, with shrublands dominated by the genus Larrea and interspersed with open forest dominated by the genus Prosopis and Acacia (Rojo et al., Reference Rojo, Paez, Chiesa, Strasser and Schäbitz2012).
In the early twentieth century, a canal, the Cañada de los Molles, was built across the low drainage divide that diverted the Río Desaguadero into Salinas del Bebedero (Fig. 2), creating up to a ~20 km2 lake. This canal was abandoned sometime in the mid-twentieth century, and shallow surface water that accumulates on the salt pan at present is solely derived from local run-off and groundwater discharge. The water is salty and precipitates a salt layer in the dry season that is harvested and processed at the Dos Anclas S.A. plant on the northeast side of the basin (Fig. 2) for table salt and other condiments.
The Río Desaguadero drains the dry central Andes, which encompass the semiarid Altiplano and high Andes > ~3600 m. Flow in the Río Desaguadero is fed by springtime snowmelt and summer rain supplied by large Andean tributaries between 28–34°S, including the Jáchal, San Juan, Mendoza, and Tunuyán rivers (Fig. 1). At present, the Río Desaguadero is an extensively modified river (UBAFI, 2009) and only flows intermittently.
More than 80% of mean annual rainfall occurs during the austral summer, with two different upper air circulation patterns causing an anti-phased pattern in the northern and southern expanses of this region on interannual and decadal timescales (Vuille and Keimig, Reference Vuille and Keimig2004). Moisture transport, which originates from the Amazon basin and the tropical Atlantic (Vuille et al., Reference Vuille, Bradley, Werner, Healy and Keimig2003), is modulated on interannual timescales by both the intensity of the South American Summer Monsoon (SASM) (Zhou and Lau, Reference Zhou and Lau1998) and sea-surface temperature (SST) changes in the tropical Pacific (Vuille et al., Reference Vuille, Bradley, Werner, Healy and Keimig2003). During La Niña events, weakened Pacific westerlies (subtropical jet) favor upper troposphere easterlies transporting wet air masses across the northern central Andes (15–23°S), extending to the Bolivian and Chilean Altiplano and ultimately, to the highest elevations of the Andes (Garreaud, Reference Garreaud2000; Garreaud et al., Reference Garreaud, Vuille and Clement2003).
Farther south (24–26° S), convective activity is modulated by the strength and location of the Bolivian High (Lenters and Cook, Reference Lenters and Cook1997), which relies on the intensity of the SASM and the moisture content of the lowlands east of the Andes (i.e., the Gran Chaco; Vuille and Keimig, Reference Vuille and Keimig2004). Moisture from the Gran Chaco not only depends on the transport of warm, moist air from the Amazon basin by the South American Low-Level Jet (SALLJ; Saulo et al., Reference Saulo, Nicolini and Chou2000; Marengo et al., Reference Marengo, Douglas and Silva Dias2002) but also on extratropical cold-air incursions (Garreaud, Reference Garreaud2000). Winter precipitation becomes much more important in the southernmost central Andes (27–34° S), originating from low-pressure troughs and cutoff lows that steer moisture north from the Pacific onto the western coast of South America and Andean slope (Vuille and Ammann, Reference Vuille and Ammann1997).
METHODS
Stratigraphic mapping and estimation of elevation
The basic stratigraphy of the Bebedero Formation was established by measurement and detailed description of thirty-two stratigraphic sections. Lateral exposures along the walls of Bebedero Creek were continuous enough that some lacustrine and playa beds could be traced and correlated with high confidence from section to section. Several horizons, such as the distinctive yellow marl of LGE-3 (Fig. 3e), were identifiable over a broad reach of middle Bebedero Creek. On the other hand, channelized deposits of different ages were not laterally continuous, and often were indistinguishable from each other. Generally, enough fossil shell material was available for 14C dating, allowing us to make correlations where stratigraphic relationships were unclear.
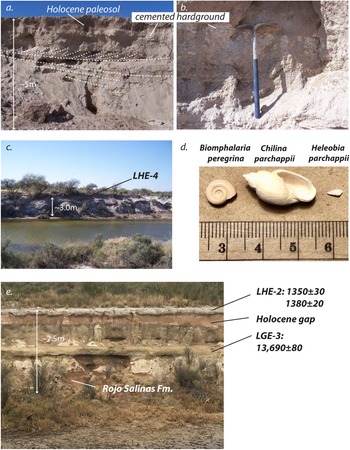
Features of the Salinas del Bebedero deposits; see Figure 2 for locations of sections. (a., b.) shoreline deposits at BD-2 showing large-scale cross-stratification as dashed lines and carbonate-cemented beach deposits. Pick = 1.2 m (see Figure 4 for schematic representation of BD-2). (c.) Flood deposits associated with LHE-4, the youngest flood deposits documented at Bebedero, draped over older units near site BD-10. (d.) The three common fossil aquatic mollusks found at Bebedero; scale units = cm. (e.) Exposure at BD-32 (Supplemental Figure 3i) showing the reddish Rojo Salinas Formation at the base, the widespread yellow lacustrine marl of LGE-3, the pink/brown playa sediments/evaporite covering the ‘Holocene gap,’ and whitish flood deposits of LHE-2 capping the sequence. Dates in figure given in calendar years before present.

Sample elevations were established using a hand-held Garmin GPS with a barometric altimeter. Daily measurements at our campsite yielded 738.7 ± 1.9 m (n =10), so we took ± 2 m as our approximate elevation precision over the sampling period. Repeated measurements at the playa edge yielded 381–383 m, consistent with elevations indicated on a local topographic map.
Stable isotopic analysis
The δ18O and δ13C values of carbonates were measured using an automated carbonate preparation device (KIEL-III) coupled to a gas-ratio mass spectrometer (Finnigan MAT 252). Powdered samples were reacted with dehydrated phosphoric acid under vacuum at 70°C. The isotope ratio measurement was calibrated based on repeated measurements of NBS-19 and NBS-18, and precision was ± 0.11‰ for δ18O and ± 0.08‰ for δ13C (1σ).
Waters were analyzed for D/H ratio using a dual inlet mass spectrometer (Delta-S, Thermo-Finnegan, Bremen, Germany) equipped with an automated chromium reduction device (H-Device, Thermo-Finnegan) for the generation of hydrogen gas using metallic chromium at 750°C. Water δ18O was measured on the same mass spectrometer using an automated CO2–H2O equilibration unit. Standardization is based on internal standards referenced to Vienna Standard Mean Ocean Water (VSMOW) and Standard Light Antarctic Precipitation (SLAP). Precision is better than ± 0.08‰ for δ18O and ± 1‰ for δD.
For strontium isotope analysis, extracts of waters and mollusks were subjected to clean column elution and thermal ionization mass spectrometry (TIMS) at the US Geological Survey Denver Radiogenic Isotope Laboratory. Water samples were first filtered using a 0.45 micron filter to remove particulates, then weighed into Teflon beakers. Mollusks were ground with an agate mortar and pestle, weighed into Teflon beakers, then digested in ultrapure 5N acetic acid overnight. The acetic acid solutions were separated from insoluble residues by centrifugation, and the residues discarded. All water and mollusk sample solutions were then dried and re-dissolved in 7N nitric acid. The solutions were run through Eichrom Sr-specific resin columns to isolate Sr. Samples were analyzed for 87Sr/86Sr on a Thermo-Finnigan Triton TIMS, correcting for mass fractionation using a 86Sr/88Sr ratio of 0.1194. Samples were normalized to NBS-987 standards analyzed on a per run basis, which yielded an 87Sr/86Sr ratio of 0.710252 ± 0.000006 (2σ, n = 6).
Carbon-14 dating
For carbon-14 dating, sample preparation prior to accelerator mass spectrometer (AMS) measurement was performed at our in-house 14C laboratory at University of Arizona. All shells were rinsed ultrasonically to remove detritus and reacted in 3% H2O2 to remove organic material. Clean samples of shell that were free of secondary cements or detritus were selected for dating. Shells of Chilina parchappii and Biomphalaria peregrina were acid-etched in dilute HCl to remove the surface patina, but not those of Heleobia parchappii, which were too small. Typically, only one valve was required for analysis except for H. parchappii, which required three or four valves.
Each sample was reacted with 100% H3PO4 under vacuum until fully dissolved. Sample gas was extracted under vacuum, cryogenically purified, and passed through a 600°C Cu/Ag furnace to remove contaminant gases. Purified CO2 samples were graphitized using 100 mg of Zn powder and Fe powder in a 2:1 proportion to the mass of carbon in the sample. AMS and δ13C measurements were performed by the Arizona Accelerator Facility, and ages are reported following the recommendations of Millard (Reference Millard2014). Errors as low as ± 10–30 years were obtained on some samples through repeat measurements. Radiocarbon dates from our study and that of some older studies, such as González (Reference González and Yrigoyen1981), were recalibrated using Calib 8.2 software based on the IntCal20 calibration curve (Stuiver et al., Reference Stuiver, Reimer and Reimer2021), and are reported in calendar years before present unless otherwise noted. All errors in calendar years are reported as ± 2σ.
Detrital zircon analysis
Detrital zircon samples were processed at Zirchron LLC at the University of Arizona according to standard crushing, sieving, water table, magnetic, and heavy liquid procedures. Zircon grains were then mounted in epoxy pucks, polished, and imaged using backscattered electrons on a Hitachi 3400N SEM. U-Pb ages of zircon grains were determined using laser ablation inductively coupled plasma mass spectrometry (LA-ICPMS) at the University of Arizona LaserChron Center. U-Pb ages of zircon grains were determined by ablation by a Photon Machines Analyte G2 Excimer laser equipped with a HelEx ablation cell and with a spot diameter of 20 μm; samples were analyzed on a Thermo Element2-HR ICPMS (Gehrels et al., Reference Gehrels, Valencia, Pullen and Olszweski2006; Gehrels and Pecha, Reference Gehrels and Pecha2014). MC-LA-ICPMS data were reduced using the program AgeCalc, while single collector data were reduced using the Python decoding routine E2AgeCalc. See www.geo.arizona.edu/alc for additional information. Uncertainties shown in the supplemental data are at the 1-sigma level and include only measurement errors. Analyses that are >20% discordant or >5% reverse discordant were not considered in this study.
Hydrologic modeling
To analyze potential flooding sources and magnitude from the tributaries of Río Desaguadero, we used US Army Corps of Engineers HEC-RAS 2D flow simulation version 5.0.7 (Brunner, Reference Brunner2016). The HEC-RAS 2D model solves unsteady flow routing equations within a determined flow area based on an implicit finite volume algorithm. The results of the model are a 2-D time series of flow characteristics such as inundation area, flow depth, and velocity. The boundary conditions of the model are the inflow and the outflow; both are represented as lines along the boundary of the simulated flow area.
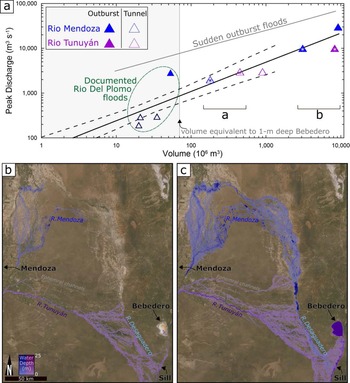
We tested a range of modeling scenarios that we believe bracket the actual flood magnitudes and sources required to fill the Bebedero Basin to its high shoreline and overflow level. One scenario assumes modern topography in the area around the basin and in the overflow divide using the Shuttle Radar Topography Mission (SRTM) digital elevation model (DEM), ~38 m/pixel (U.S. Geological Survey, https://earthexplorer.usgs.gov, data accessed on February 4, 2020, through Global mapper v21.0). In this case, a flood needs to rise ~5 m to overtop the incised channel of the Río Desaguadero and flow into the Bebedero Basin to a volume of ~5.7 × 10⁹ m3 (Supplemental Figure 2), which is the equivalent of filling to the high shoreline. This scenario minimizes our reconstruction of the magnitude of past flooding events because the basin center has been infilled by up to 10 m of sediment since the late glacial (Rojo et al., Reference Rojo, Paez, Chiesa, Strasser and Schäbitz2012). The modeled floods detailed in the Results section and in Supplemental Table 3 and Supplemental Figure 4 looked at the flood volumes, including those of historic floods, that were necessary to simply reach various points downstream up to the area of the Bebedero Basin without filling it. Other potential modeling scenarios that were not considered here due to computing time limitations might include reducing the depth of incision of Río Desaguadero from its current local depth of ~5 m, although we think that the geologic evidence discussed later imposes some significant limits on this potential reduction.
The southern tributaries of Río Desaguadero, the Río Mendoza and the Rio Tunuyán, were evaluated as potential flood sources (Fig. 1). While both drain a vast and steep area of the Andes, Rio Tunuyán is characterized by a shorter flow path towards Bebedero. On the other hand, the Río Mendoza has a documented history of flooding (King, Reference King1934; Espizúa and Bengochea, Reference Espizúa and Bengochea1990). The inflow boundary conditions were determined downstream of the city of Mendoza, i.e., downstream of the Andes and the main human-influenced landscape (e.g., reservoirs, settlements, and agricultural fields).
Input hydrographs were synthesized based on the assimilation of global outburst floods by Walder and Costa (Reference Walder and Costa1996), featuring volume, peak discharge, shape, and duration of these large floods. Because a common outburst mechanism in this part of the Andes is after a glacier surge and valley damming (Anacona et al., Reference Anacona, Mackintosh and Norton2015; Pitte et al., Reference Pitte, Berthier, Masiokas, Cabot, Ruiz, Ferri Hidalgo, Gargantini and Zalazar2016), some of the model runs simulated subglacial tunnel drainage of medium volumes of 107–108 m3. For this type of simulated flood, we used the documented recurring subglacial drainage of Colonia Glacier and Lake Cachet 2 towards Baker River in the southern Andes as a reference (Anacona et al., Reference Anacona, Mackintosh and Norton2015). Topographic analysis of Glacier Grande del Nevado area showed that the repeated damming of Rio del Plomo (a tributary of Río Mendoza) by the glacier could potentially result in a lake with a volume of ~160 × 106 m3. This volume is larger than the recurring subglacial drainage of the glacier in 1984–1985 (Espizúa and Bengochea, Reference Espizúa and Bengochea1990) and the outburst in 1934 (King, Reference King1934), and is equivalent to the flood volumes from Lake Cachet 2. The outflow of the simulated flow area (~30,000 km2) was determined along the channel and floodplain of Río Desaguadero, 10 km downstream to the sill between the river and Bebedero Creek (Supplemental Table 3). Because our objective was to provide general constraints for potential water sources, modeling conditions were simplified to be spatially uniform within the flow area (0.03) and the cell size of the computational mesh was set to ~100 × 100 m2. Preliminary runs in a smaller model area (near Salinas del Bebedero) showed a negligible effect of variations in the roughness coefficient in the range of 0.025–0.035. This effect is even smaller under the orders of magnitude differences between the simulated volumes and peak discharges. Other specific characteristics of the simulated floods and model runs are detailed in the supplemental data (Supplemental Table 3; Supplemental Figure 4).
RESULTS
Basin geomorphology
Our observations in the field and from topographic maps and satellite images show that Salinas del Bebedero occupies a shallow (~30 m deep) basin that is hydrographically closed up to 410–412 m asl. The basin divide between the Río Desaguadero channel and the Bebedero Basin is also at 410–412 m asl and lies at the south end of the basin (Fig. 2). The divide thus rests ~30 m above the bottom of the Bebedero Basin but ~4–5 m above the current channel bottom of the adjacent Río Desaguadero. The fill underlying the divide appears to be coarse alluvial sediment from Río Desaguadero.
We observed and mapped three broad categories of geomorphic features in the Bebedero Basin: lacustrine and playa, eolian, and fluvial (Fig. 2). The modern playa occupies the center of the basin and sits ~380–381 m asl. It is a smooth, brown, silty surface that is free of vegetation, and in the dry season, it becomes salt encrusted. The margin of the playa is smooth and vegetation-free up to ~385 m asl, suggesting the basin is frequently flooded up to this level. Above this level, paleoshorelines at ~ 389 m, 390 m, 392 m, 394 m, 400 m, and 410–412 m are sharp, continuous, and marked by sandy, shell-rich berms. The highest shoreline at ~415 m is poorly preserved. Continuous vegetation covers the landscape above ~400 m, and whereas below this level, vegetation is patchy, and interspersed with whitish, fine-grained lake deposits. This transition may mark a significant time break in the ages of the paleolake features.
The shoreline features are visible all around the lake basin except where Bebedero Creek enters on the south side of the basin. There, the creek feeds a delta complex below an elevation of ~390 m asl. Above that elevation up to its headwaters, Bebedero Creek incises lacustrine and fluvial deposits by up to 3–5 meters. The head waters of the creek lie north of the drainage divide at 410–412 m with Río Desaguadero. Elsewhere in the basin, there is little natural incision or exposure. The basin area above and outside the remnants of the 415 m paleoshoreline is underlain by relict longitudinal sand dunes, now largely stabilized by dense Monte vegetation.
One additional important feature is an area on the southwest edge of the basin underlain by light-colored deposits that contrast sharply with adjacent, darker colored, dune-covered areas (Fig. 2). These deposits form a triangular wedge that broadens and slopes very gently (~0.06°) northward, and appear to be cut by a braided pattern of paleochannels. On the ground, there is little relief or vertical exposure of these features, but the overall map patterns indicate a paleodelta or splay complex originating from the Río Desaguadero.
Dating considerations
Shells belonging to several species of aquatic gastropods are extremely abundant in the Bebedero Formation, being present at some stratigraphic level of almost every outcrop we visited. Carbon-14 dating in this study relied exclusively on aquatic shell material, with all but one sample from one of three species: Chilina parchappii, Biomphalaria peregrina, and Heleobia parchappii (Fig. 3d), with one date derived from Physa sp. In general, preservation of material is excellent: valves are complete and unabraded, often semi-translucent (in the case of Biomophalaria), and pure aragonite. Most specimens are too delicate to survive significant reworking except C. parchappii, which produces a very thick-walled shell. Thus, with excellent preservation and a small chance of reworking, most fossils from Salinas del Bebedero should be good targets for age-dating.
Reworking of C. parchappii valves is a key exception, and we have identified at least five dates where reworking from older deposits is likely. Two C. parchappii valves from profile BD-2 (Figs. 3a, b; 4) cut into a high shoreline berm yielded ages at the >35ka limit of 14C dating for carbonates (Table 1; samples BD-2b, f: 40,480 ± 370 14C yr BP, 36,310 ± 40 14C yr BP). The other three cases were BD-33a (12,710 ± 170 cal yr BP), BD-6d (12,750 ± 20 cal yr BP), and BD-10b (2450 ± 170 cal yr BP), and all are valves of B. peregrina that were apparently reworked into much younger channel deposits.
Schematic drawing of the exposure of the high shoreline complex at site BD-2 (see also Figs. 2, 3a, b). Solid lines indicate distinct breaks in bedding. Calibrated carbon-14 ages are in years shown in italics; un-italicized dates are uncalibrated. All ages are derived from shells of the aquatic gastropod Chilina parchappii except BD-2E, which is derived from a carbonate beach cement. At least three separate trough cross-bedded sandy horizons are present that are cemented at the top by carbonate-rich hardpans and truncated by an erosional surface, and we interpret these as representing three separate lake oscillations. The sequence is capped by eolian sand and a surface soil.

14C dates derived from samples from the study area; see Figure 2 for locations, and text for detailed descriptions of individual units. ^ indicates WGS 84 datum; # fmc: fraction modern carbon; * indicates reworked context.

With most surface waters but especially lakes, there is a possibility that the age of aquatic shell material can be increased by uptake of carbon out of equilibrium with the atmosphere, a well-known problem in many South American lakes, especially in the Andes (Geyh et al. Reference Geyh, Grosjean, Núñez and Schotterer1999). For a variety of reasons, we regard such effects as unlikely for Laguna Bebedero. First, evidence from detrital zircons, as well as strontium isotopes from shell material and water (presented more fully later), point to filling of the basin by flooding of Andean river water derived from a source that is a long distance from the basin. River water is typically in or close to isotopic 14C equilibrium with the atmosphere, although local depletion in 14C can arise due to groundwater inputs, especially during the dry season (e.g., Ishikawa et al., Reference Ishikawa, Hyodo and Tayasu2013; Martínez et al., Reference Martínez, Quiroz Londoño, Solomon, Dapeña, Massone, Benavente and Panarello2017). The influence of ground water on river 14C should be greatly reduced during flooding. Second, storage time (also leading to 14C depletion and age increase) in a shallow lake such as Laguna Bebedero should be short: an evaporation rate of ~1.2 m/yr would dry a 30 m deep lake like Laguna Bebedero in 25 years without replenishment. Third, we obtained ages as young as 110 ± 130 yrs on shell material from a fresh shoreline at 395 m, which is virtually indistinguishable from modern, pre-atomic dates. Shell material was generally found in sandy shoreline berms around the north side of the basin or in marsh (marls or bedded silt) and sandy channel deposits exposed along Bebedero Creek. These shallow water settings are the most likely to maintain carbon isotopic equilibrium with the atmosphere. Finally, marine carbonates are not present in local bedrock, e.g., the nearby Sierras de San Luis, that might deplete local surface and ground water in carbon-14. For these reasons, we accept the validity of 14C dates from fossil shell material at Bebedero without correction for the influence of depleted 14C, in line with previous researchers (González and Maidana, Reference González and Maidana1998). All presented ages are in calibrated years BP unless otherwise noted.
Stratigraphy and age
No formal stratigraphic study has been conducted on the Bebedero deposits, although some outcrops have been described informally (González and Maidana, Reference González and Maidana1998). For this study, we systematically described sedimentary sections from over thirty locations, and provide detailed sedimentary logs (prefixed BD- followed by the location or station number) for almost half of them (Fig. 2; Supplemental Figure 3). To create a more rigorous stratigraphic framework for the deposits, we introduce two informal formation names, the basal and much older Rojo Salinas Formation, and the overlying Bebedero Formation that contains the lakebeds described herein. We further recognize at least ten subdivisions of the Bebedero Formation defined by distinctive green, shell-rich silt layers; marls; cut-and-fill cycles exposed along Bebedero Creek; and shoreline sand berms at various elevations. We interpret these as periods of higher lake levels driven by pulses of flooding from Río Desaguadero (discussed in more detail below). These ten subdivisions include six distinct late Pleistocene events (LGE-1 to LGE-6), and four late Holocene events (LHE-1 to LHE-4). In many cases, 14C dates allow correlation of sedimentologically distinct shoreline, channel cut-and-fill, and deeper lake deposits associated with each one of these events.
Rojo Salinas Formation
The Rojo Salinas Formation encompasses a sequence of redbeds representing the oldest surficial deposits widely exposed across the Bebedero Basin and is exposed at the base of many natural outcrops along Bebedero Creek (Fig. 3e). It consists of >2 m of hard, massive, silty clay and clayey silt and is conspicuously red, ranging in color when dry from reddish brown (7.5YR 4/3) to yellow-red (5YR 5/6). It lacks clear bedding, and locally, can have strongly prismatic structure due to the high clay content. Secondary carbonate nodules 1–5 cm in diameter are very common, as is dark manganese staining, especially along ped faces. Gypsum nodules are also commonly dispersed throughout profiles or cementing the upper contact as a hardground. The Rojo Salinas Formation is conspicuous and widely exposed across the basin, and is separated from much younger and non-reddish units above by a wavy, sharp disconformity.
No organic matter, shell, or other datable material was observed in the Rojo Salinas Formation. Thus, it is undated, but it must be older than 25–35 ka, the oldest shell dates obtained from the overlying Bebedero Formation.
Bebedero Formation
The ten flood deposits described and dated in this study from the Bebedero Formation include six late glacial events (LGE-1 to LGE-6) and four late Holocene events (LHE-1 to LHE-4). All ten flood events are represented by sedimentary deposits, but three of them (LGE-4, LHE-1, LHE-3) are also represented by shell material reworked into other, younger deposits. An additional two events from the glacial maximum events (GME-1, GME-2) were not encountered by us but were dated by González and Maidana (Reference González and Maidana1998). The logged sections in which all LGE and LHE events were described are numbered BD-1 to BD-32. Locations of these sections are shown in Figure 2 (map view) and Supplemental Figure S3a (cross-section view). Details of each stratigraphic section are shown in Supplemental Figure S3.
Units LGE-1 to LGE-6
Unit LGE-1 (2–3 m thick) is the oldest lake-filling phase in the physically exposed record in the Bebedero Basin, and rests directly on pre-late Pleistocene redbeds of the Rojo Salinas Formation. It is composed of massive, loose to slightly hard, fine to medium sand, light brown (10YR 5/4d) to pale olive green (10YR 6/3d), with common Fe-stains. Carbonate and gypsum nodules and rhizoliths increase upwards to the sharp, smooth, erosive upper contact. Dispersed shells of Heleobia parchappii in the upper 20 cm yielded two dates from separate sections: BD-3a (16,520 ± 260 cal yr BP) and BD-11a (16,790 ± 230 cal yr BP) (Table 1). The top of Unit LGE-1 is at 398–399 m asl.
LGE-2 is a lithologically diverse unit widely exposed along the length of Bebedero Creek and on high shorelines around the salinas. Twelve calibrated 14C dates indicate the age range of LGE-2 is between 14,430–15,670 cal yr BP. Below we divide our description of BD-2 into occurrences on the high shoreline berm, and on the lower, middle, and upper reaches of Bebedero Creek.
High shoreline berm, northern part of basin: (Figs. 3a, b; 4) 405–410 m, >5 m exposure at BD-2 (sand pit): coarse, locally gravelly sand, soft, trough cross-bedded, locally cemented by beach rock in three separate horizons, the lowest yielding an age of 15,220 ± 180 cal yr BP (sample BD-2e). Other valves of C. parchappii at BD-2 were analyzed and yielded age dates from samples BD-2a (15,390 ± 240 cal yr BP), BD-2c, (15,660 ± 130 cal yr BP), and BD-2h (15,050 ± 310 cal yr BP). Two valves from sample BD-2 yielded very old uncalibrated 14C ages 36,310 ± 40 cal yr BP (BD-2f) and 40,480 ± 370 cal yr BP (BD-2b). These last two are likely reworked from older shoreline deposits. Farther west at site BD-23 (Fig. 2; Supplemental Figure 3a) on top of the same high shoreline berm at 410–412 m, two valves of C. parchappii returned ages of 15,000 ± 110 cal yr BP (BD-23a) and 14,430 ± 290 cal yr BP (BD-23b). These samples are the youngest and stratigraphically highest samples obtained from LGE-2.
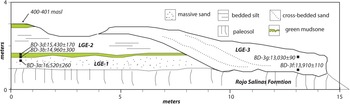
Middle Bebedero Creek (~20 cm thick): massive, slightly hard to hard silty sand and silt, pale green (5GY 8/1d), strongly effervescent, abundant C. parchappii and H. parchappii shells. Shell material from the green silt yielded ages from samples BD-3b (14,960 ± 300 cal yr BP), BD-3d (15,430 ± 170 cal yr BP), BD-4a (15,420 ± 190 cal yr BP), and BD-7a (14,520 ± 300 cal yr BP) (Table 1; Fig. 5; Supplemental Figure 3).
Schematic drawing of exposure of several lake/flood cycles at BD-3 (see Figure 2 for location). All dates are given in calendar years B.P. and derived from aquatic shell material.

Lower Bebedero Creek (>1.2 m; 386 m): massive, fine to sandy silt, yellow-green (10YR 5/4m), with large gypsum crystals. Abundant H. parchappii from sample BD-17a yielded an age of 14,920 ± 340 cal yr BP.
Unit LGE-3 (20 cm to >2 m) is distinct, massive, green (5GY 8/1–7/1) clayey silt that is best exposed along middle Bebedero Creek, and ranges laterally from a thick (>2 m) cut-and-fill sequence (site BD-3; Fig. 5) to a thin (20 cm), flat-lying, green layer (BD-4; Supplemental Figure 3b), to a pale-yellow (5Y 8/3) marl on upper Bebedero Creek site profiles BD-11, BD-12, BD-17, BD 31, and BD-32 (Fig. 2; Supplemental Figure 3e–i). It is strongly calcareous and locally rich in shells of C. parchappii, H. parchappii, and B. peregrina. Fourteen calibrated 14C dates (Table 1) from this unit along Bebedero Creek span ca. 1300 years from 14,280–13,020 cal yr BP. The oldest dates come from the upper green layer in site profile BD-4 (Fig. 2, Supplemental Figure 3b; ~402 m) yielding three ages of 14,280 ± 330 cal yr BP (BD-4c), 14,010 ± 110 cal yr BP (BD-4c), and 14,050 ± 100 cal yr BP (BD-4d). In this profile, LGE-2 is separated from LGE-3 by ~1 m of light-brown, salty, calcareous silt.
Nearby in Profile BD-3 (Fig. 4; Supplemental Figure 3a; 402–404 m asl), LGE-3 fills a channel that cuts >2.5 m into older sediments, including LGE-2. Calibrated dates BD-3f, g from C. parchappii from the base to top of the exposure span 13,910 ± 110 cal yr BP to 13,020 ± 90 cal yr BP. Dates derived from H. parchappii and C. parchappii from pale green silty clay and sand from adjacent profile BD-31 (Fig. 2; Supplemental Figure 3h) match the youngest ages in this fill at 13,000 ± 70 cal yr BP (BD-31a) and 13,090 ± 70 cal yr BP (BD-31b).
On upper Bebedero Creek, LGE-3 is widely visible as a distinct yellow marl, and yielded dates from samples BD-11b (13,550 ± 50 cal yr BP), BD-12e, f (13,700 ± 90 cal yr BP, 13370 ± 100 cal yr BP), BD-17b (13,750 ± 100 cal yr BP), and BD-32 (13,690 ± 80 cal yr BP) (Fig. 2; Supplemental Figure 3i). These samples all are from 402–408 m asl. C. parchappii of LGE-3 age (samples BD-24a, b) were also found on the north side of the basin along a shoreline berm at ~404 m asl and were dated to 13,260 ± 60 cal yr BP and 13,170 ± 60 cal yr BP, respectively (Table 1).
Deposits of LGE-4 are composed of organic-rich marl or olive-green (5Y 5/2) siltstone that rests on an erosional disconformity cut into the top of LGE-3 at BD-11 and BD-12 (Fig. 2; Supplemental Figure 3e–f). Two dates from in-situ shell material at 402–404 m asl returned dates of 12,800 ± 40 cal yr BP (BD-11e) and 12,990 ± 130 cal yr BP (BD-12h). Two other shells yielded similar ages, but a secondary, reworked context is suspected for both: BD-6d (12,710 ± 30 cal yr BP) was found at the top of profile BD-6 in loose sand, and BD-33a (12,750 ± 10 cal yr BP) was found at the base of a channel fill accompanied by abundant abraded, broken shell material (Fig. 2).
Deposits of LGE-5 are known from two lithologically distinct locations along middle to upper Bebedero Creek. The first exposure is at site BD-6 (Fig. 2) and is composed of bedded brown (7.5 YR 5/3d) silt flanking a channel-fill that cuts disconformably down into LGE-2. This LGE-5 deposit lies at ~400 m, and the date derived from a B. peregrina shell from this location is 11,970 ± 340 cal yr BP (BD-7b). A second LGE-5 occurrence at site BD-12 is an organic-rich, black (10YR 3/2) at 405–406 m asl. This layer is extremely rich in B. peregrina and H. parchappi, which returned an age of 12,230 ± 390 cal yr BP (BD-12n) (Fig. 2; Supplemental Figure 3f). At BD-12, LGE-5 sediments rest on an erosional disconformity cut into LGE-4.
LGE-6 is represented by a single channel fill located at BD-31 (400 m asl; Fig. 2; Supplementary Figure 3h), where >2 m of channel fill cuts into LGE-3 sediments. The channel fill consists of a basal green clayey siltstone capped by light-brown silty sand. The green siltstone contains abundant H. parchappii that returned a single calibrated age of 11,350 ± 170 cal yr BP (BD-31c; Table 1).
Late Holocene events (LHE-1 to LHE-4)
The record at Salinas del Bebedero exposes at least four distinct lake-filling events or clusters of events of late Holocene age. The late Holocene sediments are found in diverse contexts, ranging from channel fill to thinner marsh deposits and shoreline berms.
LHE-1 is represented by a single B. peregrina shell in an organic-rich black mat at site BD-12 (Fig. 2; Supplementary Figure 3f) dated to 2580 ± 110 ka (BD-12p) exposed along Bebedero Creek at 405–406 m. The second occurrence of LHE-1 material is at approximately the same elevation at BD-10 (Fig. 2; Supplementary Figure 3d), also from a B. peregrina valve found in a deep channel fill and dated to 2450 ± 170 cal yr BP (BD-10b). This sample is underlain in the same channel by another shell dated at 930 ± 130 cal yr BP (BD-10a); thus, we interpret BD-10b as probably reworked from a nearby outcrop of LHE-1 sediment. This paleochannel cuts completely through the Bebedero Formation and down into the Rojo Salinas Formation, so reworking of older shell material is not surprising.
LHE-2 is represented by a soft, gray silt that forms a distinctive light-colored layer found over a large area around profile BD-32 (Figs. 2, 3c; Supplemental Figure 3i) on upper Bebedero Creek. Two dates (BD-32b) on B. peregrina returned similar ages of 1380 ± 20 yr BP and 1350 ± 30 yr BP. This layer is 408.5 m asl and rests directly on a halite-rich zone cementing the top of 2 m of brown silt, which in turn rests on LGE-3-age lake marl deposits.
LHE-3 is only documented from a single, deep paleochannel cut completely through the Bebedero Formation and down into the Rojo Salinas Formation at site BD-10 (Fig. 2; Supplementary Figure 3d). It is composed of yellow-brown (10YR 5/4d) sand with minor clay partings and organic layers. Single bedforms in the channel-fill drape into the channels ~3 m vertically, providing a minimum estimate of water depth at deposition. Lateral to the channel, sediments of LHE-3 drape over undulations in the older pre-LHE-3 topography over a broad area. The base of the channel is ~399 m asl and the top is 403 m asl. A single valve of B. peregrina from the base of the channel returned an age of 930 ± 130 cal yr BP (BD-10a; Table 1).
LHE-4 is represented over a large area of upper Bebedero Creek by hummocky drapes across older deposits (Fig. 3c). In places, LHE-4 is deeply channelized (≥3 m), such as at profile BD-33 (Fig. 2) at 405 m (base) to 408 m (top), through the entire thickness of the Bebedero Formation. The channel is filled by continuous, steep drapes of greenish-gray organic-rich sand at the base to loose brown silt at the top. As in LHE-3, bedforms >3 m provide a minimum estimate of water depth. The bottom of the channel fill is a shell coquina dominated by B. peregrina but also with a few broken and abraded fragments of C. parchappii that were probably reworked from LGE lake deposits. A single B. peregrina valve from the channel-fill base returned an age of 12,710 ± 30 cal yr BP (BD-33a). A date from a shell of Physa sp. at the top of the profile gave an age of 300 ± 30 cal yr BP (BD-33b). Because of these dating contradictions and physical evidence for reworked shell at the base of the channel, we infer 300 ± 10 cal yr BP as the likely true age of this channel complex.
A second location of probable LHE-4 deposits at site BD-26 is along a distinctive 2–3 m high shoreline berm at 397 m on the north side of the basin (Figs. 2, 6). Exposures of the berm at BD-26 reveal grusy, shell-rich sand resting on red outcrops of the Rojo Salinas Formation. Shell material is dominated by H. parchappii and B. peregrina, with a few broken valves of C. parchappii. Two samples returned almost identical ages of 110 ± 130 cal yr BP (BD-26bio) and 170 ± 150 cal yr BP (BD-26lit).
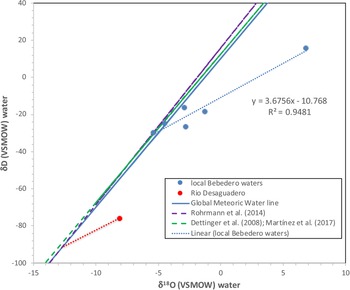
Graph of δ18O SMOW versus δD VSMOW values of modern waters from the study area. The global meteoric water line and three local meteoric water lines from Rohrmann et al. (Reference Rohrmann, Strecker, Bookhagen, Mulch, Sachse, Pingel, Alonso, Schildgen and Montero2014), Dettinger et al. (Reference Dettinger, Quade, DeCelles, Ducea, Kapp and Carrapa2015), and Martínez et al. (Reference Martínez, Quiroz Londoño, Solomon, Dapeña, Massone, Benavente and Panarello2017) are very similar. Dotted lines are evaporation lines (m = 3.76) fit to the local water data. The line fit (blue-dotted for the Salinas del Bebedero water) intersects all three meteoric water lines at δ18O (VSMOW) ~ −5.4, in good agreement with local weighted average rainfall data in the −5.4‰ to −5.7‰ range (Rozanski and Araguás-Araguás, Reference Rozanski and Araguás-Araguás1995). Extrapolation of the Río Desaguadero data point (red dot) to the meteoric water lines yields an intercept δ18O (VSMOW) value of ~ −13.0‰, consistent with runoff from rainfall and snow from high (>4000 m) elevations in the central Andes (Blisniuk and Stern, Reference Blisniuk and Stern2005; Rohrmann et al., Reference Rohrmann, Strecker, Bookhagen, Mulch, Sachse, Pingel, Alonso, Schildgen and Montero2014).

Oxygen and hydrogen isotopes in water
Five natural waters from the Bebedero Basin range between −30‰ to +15‰ in δDwater (VSMOW) and −5.4‰ to +6.9‰ in δ18O water (VSMOW) (Table 2). δDwater values from one sample from the Río Desaguadero collected in early May 2008 are lower at −76‰ and −8.1‰, respectively. Three samples fall along or near the regional meteoric water line: two well waters and tap water from the town of Beazley on the south side of Bebedero Basin (Fig. 6). The rest of the samples from the Bebedero Basin, which includes surface ponds, Bebedero Creek, and a small spring near the edge of the playa, fall to the right of the line. The samples form a linear array (r2 = 0.95) with a slope of about 3.7 that intersects the Global Meteoric Water Line (GMWL) at δ18O (VSMOW) = −5.4‰, close to the value of Beazley tap water (Fig. 6). These results indicate evaporative enrichment in 18O and D of surface waters at very low humidity from water with a starting composition resembling Beazley tap water. The Río Desaguadero water also falls right of the GMWL due to evaporation of river water along its 800-km-long desert course. Projection of this data point using a slope of 3.7 back onto the GMWL yields a δ18O water (VSMOW) value of ~ −12.8‰, similar to the composition of rainfall and snow falling at >4000 m in the modern eastern Andes (Fig. 6; Rohrmann et al., Reference Rohrmann, Strecker, Bookhagen, Mulch, Sachse, Pingel, Alonso, Schildgen and Montero2014; Dettinger and Quade, Reference Dettinger, Quade, DeCelles, Ducea, Kapp and Carrapa2015).
Stable isotopic results from natural water samples from the study area; see Figure 2 for locations.

Carbon and oxygen isotopes in shell material
We conducted sixty stable carbon (δ13C shell VPDB [Vienna Pee Dee Belemnite]) and oxygen isotope (δ18O shell VPDB) analyses from the shells of the three main fossil fresh-water species (Fig. 3d) present in the deposits (Table 3). The δ13C shell (VPDB) values for all species range between −13‰ and +1.7‰. Values derived from C. parchappii and H. parchappii span most of this range, whereas values from B. peregrina span only the lower half of the range, −13‰ to −4‰. The δ18O shell (VPDB) values from all three species span most of the range from −12.3‰ to +3.5‰.
Stable isotopic results from analysis of shell aragonite from Salinas del Bebedero.

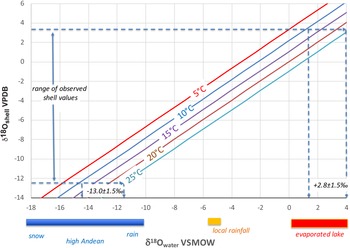
Most freshwater mollusks precipitate shell carbonate preferentially between 12–25°C during the summer months (Dettman et al., Reference Dettman, Reische and Lohmann1999). Assuming this range of temperature, the reconstructed δ18O Standard Mean Ocean Water (SMOW) values for host waters must have ranged between −13.0 ± 1.5‰ and 2.8 ± 1.5‰, corresponding to shell (VPDB) values of −12.3 to +3.5‰, respectively (Fig. 7).
Measured δ18Oshell VPDB versus reconstructed δ18Owater VSMOW as a function of temperature (diagonal lines). Assumed aragonite shell-water fractionation (1000lnαaragonite–water = 2.559 x 10⁶ T-2 + 0.715) is from Dettman et al. (Reference Dettman, Reische and Lohmann1999). Bars below the x-axis indicate ranges of values for different water sources.

Strontium isotopes
We analyzed the 87Sr/86Sr ratios of seventeen shell and natural water samples from the area (Table 4). The 87Sr/86Sr ratio can be a powerful tracer of the potential sources of water in paleolake systems such as Salinas del Bebedero (e.g., Hart et al., Reference Hart, Quade, Madsen, Kauffman and Oviatt2004). Well water from the north side of the basin returned the highest 87Sr/86Sr ratio at 0.708515, whereas water from Río Desaguadero and Bebedero Creek returned lower values in the 0.707229–0.707799 range (Table 4). Thirteen 87Sr/86Sr analyses of shells across a range of species and ages (17–0.14 ka) fall in a comparatively narrow range of 0.707126–0.707509.
87Sr/86Sr analyses of natural waters and fossil shell material.

U-Pb ages from detrital zircons
We analyzed ~100 detrital zircons from each of three sand samples (Supplemental Table 1) to establish possible sediment sources of basin deposits in the Salinas del Bebedero. Samples were taken from LHE-1 at site BD-35 along Bebedero Creek, the LGE-2 shoreline complex on the north side of the basin (Fig. 4) that is composed of grusy sand mainly derived from the Sierra de San Luis (BD-2c), and from the Río Desaguadero (BD-36) 50 km northwest of the basin. Tributaries of Río Desaguadero drain the eastern face of the Andes as well as the Sierras Pampeanas as it flows south, so BD-36 represents erosion of the extrabasinal “Andean” endmember.
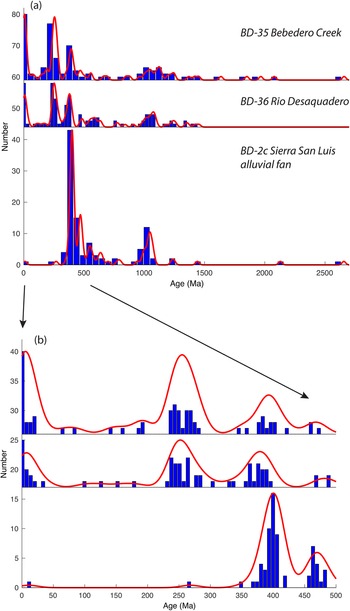
The U-Pb age spectra for detrital zircons in all three samples bear a strong resemblance to the interval spanning the period 2600–350 Ma, and share two major age groupings at 950–2650 and 750–350 Ma (Fig. 8a). The two broad groupings are typical for ages derived from basement metamorphic rocks exposed in the Sierras Pampeanas or recycled in Paleozoic sediments of the pre-Cordillera. A dominant mode from 950–1250 Ma is associated with the Súnsas (or Grenvillian) orogeny. Detritus in all three samples therefore reflects a primary or recycled Pampean sources from rocks exposed in the sub-Andes and foreland. Unlike BD-35 and BD-36, the most abundant zircons in sample BD-26 from the north side of the Salinas del Bebedero Basin are Devonian, indicating erosion of Devonian plutonic rocks exposed in the southwest portion of the Sierra de San Luis as a source.
Values for U-Pb ages derived from detrital zircon from three samples (BD-2c, BD-35, BD-36) versus abundance from ~105 grain analyses. Abundance expressed in 5 Ma increments in blue histograms, red line is smoothed kernel density of abundance (Saylor and Sundell, Reference Saylor and Sundell2016); (a) Age values from 2700 Ma to present; (b) Enlargement of graph (a) from 500 Ma to present.

Younger than 350 Ma, the age spectra of samples BD-35 and BD-36 strongly resemble each other, whereas BD-26 differs (Fig. 8b). Sample BD-26, eroded from Sierra de San Luis, contains only two grains younger than 350 Ma. BD-35 (Bebedero Creek) and BD-36 (Río Desaguadero) contain abundant grains <350 Ma, centered on two peaks at ~250 ± 30 Ma and at ~20 ± 10 Ma. Both peaks indicate Andean sources: the former from Permian–Triassic plutonic rocks (including the dominant Choiyoi Igneous Complex) exposed in the frontal Cordillera, and the latter from Andean volcanic sources mainly in the western Cordillera of the Andes.
DISCUSSION
Water and sediment sources
For nearly a century, it has been speculated that during floods from the Río Desaguadero, water overtopped the drainage divide leading to the Salinas del Bebedero, thus building large lakes in the basin (Déletang, Reference Déletang1929). Several new lines of evidence support this view. The first general physical evidence is a braided pattern of flood channels and associated whitish-colored delta or splay deposits spreading away from the north bank of the Río Desaguadero (Fig. 2). The channels and deposits cover ~18 km in width, and range in elevation from 425 m asl to 412 m asl in spill height along the incised channel of the Río Desaguadero. Bebedero Creek forms the southeastern boundary of the deposits. Beyond these deposits lie dark-colored, unchannelized plains that are largely covered by eolian sand sheets and continuous longitudinal dune crests.
Two sedimentologic features support a flood origin for the basin fill and not just sediment transport by the Río Desaguadero under normal flow conditions. One is the lack of coarse bed load in the fill of paleochannels exposed along Bebedero Creek. Basal channel fill is almost all sand except for a few quartzite pebbles and occasional carbonate and iron nodules reworked from the Bebedero Formation. We did not find any conglomerate beds in the Bebedero Formation. By contrast, the nearby channel of the modern Río Desaguadero is filled with coarse cobbles. The lack of conglomerate in the Bebedero Formation suggests that no direct channel link between the Río Desaguadero and Bebedero were ever established, and that all deposition was by overbank flooding of the Río Desaguadero that prevented transport of bedload into the Bebedero Basin.
Additional sedimentological evidence for flooding is the large bedforms filling paleochannels of the Bebedero Formation. The size of these bedforms points to deposition by large floods at least 3 m deep flowing down the ancestral Bebedero Creek to the playa (Fig. 3c; Supplemental Figure 3d; BD-10) (Leclair, Reference Leclair2002; Blum et al., Reference Blum, Martin, Milliken and Garvin2013; Reesink et al., Reference Reesink, Van den Berg, Parsons, Amsler, Best, Hardy, Orfeo and Szupiany2015). This deposition must have been preceded by deep scouring or reoccupation of >3 m-deep channels prior to channel backfilling by flood-borne sand and silt. Moreover, evidence for fresh water in the basin is infrequent (14 large events in the past 25 ka), so clearly the basin did not flood seasonally or even on a regular basis, again indicating that there was some sort of topographic barrier to regular inflow from the Río Desaguadero. From cores, we know that playas dominate the sedimentologic record of the basin (Rojo et al., Reference Rojo, Paez, Chiesa, Strasser and Schäbitz2012).
A final observation is that the high late Pleistocene paleoshoreline at 410–412 m asl (LGE-2) corresponds closely to the height of the basin divide between the Bebedero Basin and Río Desaguadero at present. This shows that this divide at 410–412 m asl has likely been stable throughout the last 20 ka or longer, and was not accreted gradually due to flood deposition.
As a tracer of sediment sources, U-Pb ages on detrital zircon indicate an Andean rather than local source of sediment in the southern half of the Bebedero Basin along Bebedero Creek in the area containing physical widespread evidence of flood deposition (Figs. 2, 8). The Bebedero Creek (BD-35) and Río Desaguadero samples (BD- 36) both contained abundant Permian and Neogene-age zircons typical of Andean Cordillera sources. In contrast, sample BD-26, representing local erosion of the Sierra San Luis, contained only two young (<350 Ma) zircon grains, which we suggest resulted from eolian transport, given that sandy eolianites and vegetated dunes cover much of the Salinas del Bebedero Basin bottom.
These visual and qualitative evaluations of the data are supported by quantitative comparison metrics using statistical tests that determine whether the age spectra derived from the detrital zircon samples were drawn from the same parent population. We performed five tests of population similarity using the probability density plot (PDP) and kernel density estimates of each sample (Saylor and Sundell, Reference Saylor and Sundell2016; Supplemental Table 2), all of which support these correlations. As an example, the PDP cross-correlation index (or r), evaluated by Saylor and Sundell (Reference Saylor and Sundell2016) to be among the most robust discriminators, shows a strong statistical similarity (r = 0.99) between zircons from Bebedero Creek (BD-35) and those from the Río Desaguadero (BD-36), and strong dissimilarity (r = 0.19) with sediment locally eroded from Sierra San Luis (BD-26).
The 87Sr/86Sr ratios of fossil shell material also point to an Andean water source. Andean discharge in the Río Desaguadero (0.707799) is lower than the ratio of well waters on the north side of the basin adjacent the Sierra de San Luis (0.708515; see Table 4). This isotopic difference reflects the strong contrast between the geological substrate of the two source areas. Both drain old felsic rocks of the Sierras Pampeanas, consistent with the higher 87Sr/86Sr ratios of the well waters. In contrast, the Río Desaguadero also flows through younger sediments and volcanic rocks in the Andes, consistent with its lower 87Sr/86Sr ratios. The 87Sr/86Sr ratios of fossil shell values of all ages are even lower than these two end members. This probably reflects a more purely Andean source delivered under flood conditions and less contribution from lowland weathering than in the Río Desaguadero under the modified modern flow conditions.
The δ 18Oshell values also indicate a non-local, highland source of the water in Salinas del Bebedero. The δ18Oshell values from all three fossil species display a wide range of values (Table 3), reflecting variable degrees of evaporation of primary recharge water. Given this, the lowest of the δ18Oshell VPDB results as low as −12.3 ‰ should provide the least evaporated estimate of the δ18Owater VSMOW value of original host water, given an assumed temperature of formation. Most fresh-water mollusks form their shell in the summer months, typically in the 12–25°C range (Dettman et al., Reference Dettman, Reische and Lohmann1999). This temperature range yields an estimated δ18Owater VSMOW value of −13 ± 1.5‰ (Fig. 8) using δ18Oshell VPDB = −12.3‰. This overlaps the calculated value for unevaporated value of −12‰ to −13‰ projected in Figure 6 for highland moisture feeding the Río Desaguadero. It is markedly lower than the −5‰ to −6‰ range of local, low-elevation rainfall across this region (Rozanski and Araguás-Araguás, Reference Rozanski and Araguás-Araguás1995; Rohrmann et al., Reference Rohrmann, Strecker, Bookhagen, Mulch, Sachse, Pingel, Alonso, Schildgen and Montero2014; Martínez et al., Reference Martínez, Quiroz Londoño, Solomon, Dapeña, Massone, Benavente and Panarello2017; Fig. 6). The very high δ18Oshell values of up to +3.5‰ correspond to reconstructed δ18Owater SMOW values of +2.8 ± 1.5‰. These values presumably indicate that highly evaporated lake waters developed between flood events.
Summary of chronology and paleohydrology of flooding
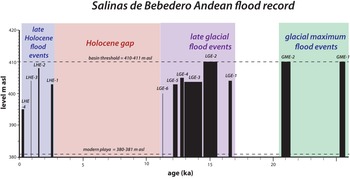
Sedimentologic and faunal evidence from outcrops and a core (Rojo et al., Reference Rojo, Paez, Chiesa, Strasser and Schäbitz2012) suggests major fluctuations in hydrochemical conditions in response to flooding in the Bebedero Basin over the last 25 ka (summarized in Figure 9). In this section, we summarize the flood chronology at Salinas del Bebedero to gain insight into long-term flood frequency and the key question of how long water lingered in the basin after each flood.
Lake-level change summary for Salinas del Bebedero over time. Each discharge event or clusters of events are shown by solid black bars indicating a maximum elevation for any sample dated from that event. Events group into four LHE (late Holocene flood events, shaded in blue), six LGE (late glacial flood events, shaded in purple), and two GME (glacial maximum flood events, shaded in green). The elevation of the modern playa and basin divide (= highest paleolake shoreline) with the Río Desaguadero are shown for reference as horizontal dashed lines.

The first expression of lacustrine deposition is two old 14C dates (samples BD-2b, 40,480 ± 370 cal yr BP; BD-2f, 36,310 ± 40 cal yr BP; ages uncalibrated) from Chilina shells that were reworked into LGE-2 deposits (Fig. 4). These lie at the limit of radiocarbon dating for shell material, and thus we regard them as minimum ages. We have found no actual sedimentary deposits associated with this early (pre-late glacial) lacustrine deposition. One possible but as yet uninvestigated source for these shells is a set of high and heavily dissected beach berms standing at ~415 m asl and 420 m asl on the west and east sides of the basin (Fig. 2). These prominent features appear to be at least 3–4 m above the current basin threshold and may represent lake highstands when the threshold stood higher >35 ka.
Figini et al. (Reference Figini, Gomez, Carbonari, Huarte and Zubiaga1984) and González and Maidana (Reference González and Maidana1998) reported three dates from C. parchappii ranging from 20.9 ka to 25.4 ka from at or near the high shoreline complex at 410–412 m. These dates define two distinct glacial maximum events, GME-1 and GME-2 (Fig. 9). This indicates that the basin was flooded to near capacity over this period at least two times, but without more stratigraphic context, we cannot say if these dates denote intermittent or continuous occupation of the high shoreline. We obtained no ages in this range from our sampling of the shorelines or along Bebedero Creek.
The base of the Bebedero Formation exposed along Bebedero Creek is marked by 2–3 m of green sand that appears to represent a single flood event (LGE-1) at ca.16.6 ka. The top of LGE-1 lies at ~405 m asl and waters were fresh enough to host Heleobia parchappii. H. parchappii is a small (3–5 mm) hydrobiid (Fig. 3d) that is generally adapted to fresh water but tolerate a wide range of salinities up to 23%, such as is found in evaporative lakes and river estuaries (Prieto et al., Reference Prieto, Blasi, De Francesco and Fernández2004; De Francesco and Hassan, Reference De Francesco and Hassan2009).
LGE-2 represents the hydrologic maximum of the last 25 ka, when the lake was repeatedly filled to the high shoreline at 410–412 m, and must have spilled back into the Río Desaguadero. LGE-2 is represented in our study by twelve calibrated 14C dates spanning 14.36–15.66 ka. Figini et al. (Reference Figini, Gomez, Carbonari, Huarte and Zubiaga1984) and González and Maidana (Reference González and Maidana1998) reported an additional nine radiocarbon dates from this period from uncontextualized shell samples that appear to have come from the high shoreline complex. Floods must have been very frequent during LGE-2 to fill the basin to levels at or near the high shoreline multiple times between 14.36–15.66 ka. These repeated fill cycles are visible in the high shoreline beach complex exposed at BD-2 (Figs. 2–4) as three separate trough cross-bedded sandy horizons dated 15.05–15.66 ka that are each cemented at the top by carbonate hardpans and truncated by an erosional surface. We interpret these sediments to represent three lake oscillations: transgression to a lake highstand (represented the cross-bedded sands), lake still-stands (represented by beach sand cementation), and lake-level drop (denoted by erosion).
Moreover, at least two distinct lake events are discernible as green layers in LGE-2 from BD-3 along Bebedero Creek (Fig. 5). Thus, we can discern at least three flood events during LGE-2 that filled the basin and overflowed back out into Río Desaguadero. At its deepest, the lake would have been ~30 m deep (using modern topography), or ~40 m deep when taking the filling of the basin center since 10 ka into account (Rojo et al., Reference Rojo, Paez, Chiesa, Strasser and Schäbitz2012). Evaporation rates can conservatively be estimated to be 1.2 ± 0.2 m/year (Harbeck, Reference Harbeck1962; Kutzbach, Reference Kutzbach1980; Brutsaert, Reference Brutsaert1982; Hastenrath and Kutzbach, Reference Hastenrath and Kutzbach1983) suggesting the lake was short-lived, drying within ~25 years without replenishment.
The fresh-water snail Chilina parchappii is especially abundant in the shoreline deposits of LGE-2. C. parchappii is a freshwater snail common in low turbidity waters of temperate and cold-temperate Argentina. It prefers living on hard, stony substrates but can also live on plants and muddy substrata (Tietze and De Francesco, Reference Tietze and De Francesco2010). C. parchappii shells are large (>3 cm) and thick-walled (Fig. 3d). Unlike the shoreline deposits, a mix of C. parchappi, H. parchappi, and Biomphalaria peregrina characterize the sands, silts, and marls of LGE-2 (as well as LGE-3–LGE-6) exposed along Bebedero Creek. B. peregrina shells are generally <1 cm in size, thin-walled, and semi-translucent where well preserved (Fig. 3d). B. peregrina is a freshwater pulmonate snail that lives mainly in lentic, oligohaline waters such as shallow lakes and marshes with submerged vegetation. It is widespread in the middle latitudes of Argentina (Paraense, Reference Paraense2005; Tietze and De Francesco, Reference Tietze and De Francesco2010; Hassan et al., Reference Hassan, De Francesco and Peretti2012). The low δ13C values (<0 (VPDB)‰ Table 2) of many B. peregrina valves observed in this study are consistent with a more restricted and vegetated setting along Bebedero Creek than those found for C. parchappii and H. parchappii. Charophytes, ostracodes, and forams sampled from shoreline deposits at or slightly below the highstand elevations of LGE-2 (referred to as PMEa in García, Reference García1999) define a range of paleosalinities from low to moderate.
Four other flood intervals (LGE-3 to LGE-6; 14.3–13.0 ka, 13.0–12.8 ka, 12.2–12.0 ka, 11.4 ka) can be discerned and dated in the late-glacial stratigraphic record, and are marked by sharp stratigraphic breaks and, in many cases, downcutting and channel backfilling between events. Dated shell material from these events comes from sediments exposed along Bebedero Creek at 402–406 m asl (22–26 m-deep lake). These should be treated as minimum lake heights because no dates were derived from paleoshorelines. Charophytes obtained from paleoshorelines that appear to correlate LGE-3 to LGE-6 define a range of paleosalinities from low to moderate, but contain some freshwater ostracodes such as Darwinula sp. and Ilyocypris gibba (García, Reference García1999).
We found no deposits dating to the period 11.4–2.6 ka (Fig. 9), indicating that no large floods reached the basin during this period. A short core obtained by Rojo et al. (Reference Rojo, Paez, Chiesa, Strasser and Schäbitz2012) from the north end of the basin appears to cover the entire Holocene although it is constrained by only two 14C dates from the bottom (ca. 12.6 ka) and middle (ca. 3.6 ka) of the core. The base of the core is dominated by clastic sands, appearing to mark flood deposits overlapping in time with LGE-3 to LGE-6. Most of the rest of the core is dominated by halite and gypsum salts, consistent with the lack of evidence of large floods in the outcrop record until late Holocene. Analysis of pollen from this core depicts regional vegetation as essentially unchanged during the Holocene and dominated by Monte-Espinal, similar to present-day vegetation (Rojo et al., Reference Rojo, Paez, Chiesa, Strasser and Schäbitz2012).
Four deposits (LHE-1 to LHE-4) mark the resumption of flooding into the basin in the late Holocene beginning ca. 2.6 ka. The first and second events, LHE-1 and LHE-2 (Fig. 3e), are characterized by a single organic and shell-rich mat draped over older LGE deposits and reaching 405 m asl along Bebedero Creek. LHE-3 and LHE-4 are represented by deep (>3 m) channel cut-and-fills that dissected down through the entire Bebedero Formation. These channels also top out at 405–406 m asl. The channel fills are locally composed of shell coquinas dominated by B. peregrina, indicating fresh, lentic, oligotrophic host water. Laterally from the paleochannels, LHE-3 thins out and drapes over older deposits, suggesting continuous flooding up to at least the 405 m level. The dating of these events is complicated by clear instances of reworking of older shell material. LHE-4 is the only late Holocene event also represented by a shoreline berm at 397 m asl. Three dates from these shoreline and channel deposits appear to mark a single flood event that occurred 150–300 years ago. González and Maidana (Reference González and Maidana1998) also reported two younger ages 300–350 cal yr BP from a shoreline at about the same elevation. The small (≤5 mm) gastropod H. parchappii is the dominant aquatic mollusk associated with these younger shorelines, consistent with more saline lake waters, a view generally supported by evidence mainly from charophytes (García, Reference García1999).
Sources and magnitude of flooding
As we and others (Déletang, Reference Déletang1929; González, Reference González and Yrigoyen1981) before us have argued, the source of flood waters in the Bebedero Basin lies in the Andes. However, the Bebedero Basin is 200 km due east of the Andes, and Andean recharge areas therefore are from 200 to 600–700 km (Fig. 1) away from the Bebedero Basin. Assuming modern topography, a pulse of floodwater at least 5 m deep would be required to overtop the incised channel of the Río Desaguadero and spill into the Bebedero Basin. This raises two key questions: what were the magnitudes of these flood events and what were the ultimate causes of these floods?
Under the current climate at these midlatitudes, large floods in the region have several potential sources: large rainfall (‘meteorological’) events, snowmelt events, or bursting of lakes temporarily dammed by ice or landslides. Globally, meteorological floods tend to dominate at latitudes less than 30°N and 30°S, whereas snow and ice-melting floods dominate at higher latitudes (O'Conner and Costa, Reference O'Conner and Costa2004). At 28–34°S, the Río Desaguadero lies astride these zones today, but there must have been more snow and ice-influenced flooding before 10 ka when glaciation expanded northward. Most rain in the Río Desaguadero catchment falls in the austral summer months of December–February from moist air that is borne by low-level trade winds from the Atlantic Ocean along the Intertropical Convergence Zone (ITCZ). Runoff in nearby catchments such as the Río Mendoza follows a regular seasonal cycle and is dominated by springtime melting and runoff. Peak runoff correlates well with winter snowpack, which in turn tends to be associated with the positive phase of ENSO (El Niño-Southern Oscillation) (Masiokas et al., Reference Masiokas, Villalba, Luckman and Mauget2010). Recent flood events on both sides of the Andes south of 30°S are associated either with atmospheric rivers (Viale et al., Reference Viale, Valenzuela, Garreaud and Ralph2018) or cut-off lows.
This sector of the frontal Andes and adjacent Pampas experiences some of the most intense summer convective rainstorms on Earth (Zipser et al., Reference Zipser, Cecil, Liu, Nesbitt and Yorty2006; Rasmussen et al., Reference Rasmussen, Chaplin, Zuluaga and Houze2016), which can augment spring runoff and cause local flooding, and is a major cause of landslides (Moreiras, Reference Moreiras2005) and river damming in the frontal Andes (Ferrer, Reference Ferrer1999; Hermanns et al., Reference Hermanns, Niedermann, Ivy-Ochs and Kubik2004). These factors are enhanced by the combined effects of rock avalanches creating temporary lakes and subsequent dam failures.
Previous researchers in the Bebedero Basin attributed flooding to melting and retreat of Andean glaciers (González and Maidana, Reference González and Maidana1998). It is true that in the historic record, catastrophic failure of ice-dammed lakes in the glaciated Andes is a key cause for production of large floods (King, Reference King1934; Anacona et al., Reference Anacona, Mackintosh and Norton2015). However, glacial retreat can increase seasonal discharge but will not lead to large-scale flooding per se unless accompanied by special local conditions such ice-damming of lakes. Globally, all known terrestrial megafloods with discharges >500,000 m3/s were caused by rapid release of water stored behind natural dams or within glaciers (O'Conner and Costa, Reference O'Conner and Costa2004). The largest historic floods known from the Patagonian Andes south of 35°S are glacial-lake outburst floods (GLOFs). In the extratropical Andes, at least thirty ice- and moraine-dammed lakes have failed since the eighteenth century, causing multiple floods and the loss of at least 15,000 lives in South America (Wilson et al., Reference Wilson, Glasser, Reynolds, Harrison, Anacona, Schaefer and Shannon2018). Some of these floods are among the largest flood events ever recorded in the Andes, with water volumes of 230–5000 ×106 m3 (Dussaillant et al., Reference Dussaillant, Benito, Buytaert, Carling, Meier and Espinoza2010; Anacona et al., Reference Anacona, Mackintosh and Norton2015). The frequency of GLOFs appears to be increasing due to global warming. In Patagonia, numerous moraine-dammed lakes were formed by the advance of glaciers during the Little Ice Age, followed by recent recession (Anacona et al., Reference Anacona, Mackintosh and Norton2015; Wilson et al., Reference Wilson, Glasser, Reynolds, Harrison, Anacona, Schaefer and Shannon2018). In the central Andean sector near Mendoza at 35°S, three documented historic floods (1787, 1934, 1985) are associated with ice-damming, and all were caused by surging glaciers and blockage of the Río Plomo. The 1934 outburst caused 23 deaths and widespread destruction along the Río Mendoza (The New York Times, “Flood in the Andes Sweeps Ten Towns…” p. 10, January 12, 1934; King, Reference King1934)
The midlatitude sector of the Andes (28–31°S) drained by the Río Desaguadero and its tributaries at present is quite dry, and glacial masses are very modest and concentrated at high elevations from 5000–6800 m. In the southern sector of the Andes around Mendoza (31–35°S), modern glaciers extend down to 4000 m (Wilson et al., Reference Wilson, Glasser, Reynolds, Harrison, Anacona, Schaefer and Shannon2018). In the past, ice was more expansive, and glaciers extended 300–900 m lower than at present, especially during the glacial maximum and deglacial period 23–11 ka (Haselton et al., Reference Haselton, Hilley and Strecker2002; Martini et al., Reference Martini, Kaplan, Strelin, Astini, Schaefer, Caffee and Schwartz2017), and to a lesser extent, during the recent neoglacial period. In many regions of the world, summertime temperature is the main control on glacial expansion and retreat. However, in the central sector of the Andes, especially north of 30°S, it is so dry that moisture availability is also a key control on glacial volume (Martini et al., Reference Martini, Kaplan, Strelin, Astini, Schaefer, Caffee and Schwartz2017; Zech et al., Reference Zech, Terrizzano, García-Morabito, Veit and Zech2017). At present, the high Andes are and have been largely ice-free except for snow and ice fields at >5000 m, on a diagonal centered on 25 ± 5°S (Lliboutry, Reference Lliboutry, Williams and Ferrigno1998). Temperatures are very cold at high elevation in this zone, yet permanent ice is barely developed due to the very dry conditions.
Another important source of large-scale floods is catastrophic release of lakes formed along canyons dammed by debris flows and rock avalanches. This is very common in the Andes (Hermanns et al., Reference Hermanns, Niedermann, Ivy-Ochs and Kubik2004) and other active orogens. Many avalanches are triggered seismically (e.g., Ferrer, Reference Ferrer1999), but historically large rainfall events causing slope failure seem to be the primary cause for avalanches (Moreiras, Reference Moreiras2005). The resultant lakes are generally short-lived and catastrophically fail within a year or two (Schuster, Reference Schuster, Alford and Schuster2000; Ermini and Casagli, Reference Ermini and Casagli2003). Enormous lakes with volumes reaching 60 km3 have been created in the narrow valleys of the Andes by damming from rock avalanches, then catastrophically released as the dam erodes due to lake overflow.
Our hydraulic simulations show that the documented historic floods of Río del Plomo (tributary to the Río Mendoza) in 1934 and 1984–1985 (King, Reference King1934; Anacona et al., Reference Anacona, Mackintosh and Norton2015) were not large enough to reach and fill Salinas del Bebedero (Fig. 10a, b). Even if all of the estimated historic flood volumes reached the salinas, the resulting water depth at Bebedero would have been < 1 m. Potentially, a scenario of repeated subglacial drainage, as in Colonia Glacier (Anacona et al., Reference Anacona, Mackintosh and Norton2015), could have accumulated to sufficient volumes. However, our simulations show that even floods that are larger by order of magnitude (volume and peak discharge) in the Mendoza basin are effectively attenuated along the low gradient river upstream to the confluence with Rio San Juan (Fig. 10). This confluence is located ~300 km upstream from the sill between Río Desaguadero and Bebedero Creek. This lower constraint for the Río Mendoza basin, based on the present-day maximum volume that can be dammed by the active glacial surge of Grade Del Nevado glacier, points to the much larger volume needed to reach and fill Salinas del Bebedero. To do so, this flood volume had to be larger than 3,000 × 106 m3 (Fig. 10a, c; see also https://youtu.be/b1fmH4UFMl4).
Volume and peak discharge graph and maps of simulated and documented floods in the Río Mendoza and Río Tunuyán basins. (a) Graph of volume versus peak discharge; triangles denote the documented (circled in green) and modeled floods. The black line indicates the regression between the volume and discharge of documented global subglacial tunnel floods (modified from Walder and Costa, Reference Walder and Costa1996), dashed lines indicate 95% confidence interval. Asterisks mark the modeled flood visualized on maps (b) and (c), where flood extents are indicated by blue to purple colors that indicate maximum depth after simulation of one month of flooding. Animation of simulated outburst floods from (c) can be viewed at https://youtu.be/b1fmH4UFMl4.

Río Tunuyán has a much shorter (~300 km), and thus steeper, watercourse in contrast to the long flow route from the Andes through Río Mendoza to Bebedero (> 450 km). Simulated floods with volumes >400 × 106 m3 are needed to simply reach the area of the Salinas del Bebedero, whereas floods with volumes that are larger by an order of magnitude are required to overtop the divide and fill the basin to its highest shoreline (Fig. 10; see also https://youtu.be/b1fmH4UFMl4). The potential existence of such large floods in the past is reinforced by several relatively dry channels flowing parallel to Río Tunuyán within ~8 m-deep incised valleys. These channels and the fan-shaped flow marks at their confluence with Río Desaguadero are visible with available online imagery (Fig. 10; See also, e.g., https://goo.gl/maps/Z1bBQ9MpuhCvNX1v5), supporting the existence of such ancient high-energy floods. Simulated floods in Rio Tunuyán in our modeling highlighted the reactivation of these channels during floods > 400 × 106 m3. Northern tributaries of Río Desaguadero are also potential flood sources, but because of the larger flow distance, these floods would have to be much larger than the ones simulated for Río Mendoza (Fig. 10a).
Ultimate climate causes
Flooding in this sector of the Andes is ultimately linked back to moisture availability, either through large rainfall events, catastrophic failure of ice or debris dams and release of lake water, or a combination of these causes. We view the flood record in the Bebedero Basin as closely tied to moisture availability along the east face of the central Andes from 28–34°S. Three periods in the Bebedero record stand out as particularly wet: 1) the Late Glacial Maximum (LGM) from 25–20 ka; 2) the wettest period from 17–11 ka, especially from 15.6–15 ka when the basin evidently experienced repeated flooding (at least three times) up to the high shoreline and must have back spilled into the Río Desaguadero; and 3) the late Holocene, with at least four records of flood events from 0–2.6 ka.
The timing of these deglacial and late Holocene flood events and the increased moisture supply to the Andes that these imply bears a strong resemblance to the record of lake and wetland expansions in the Andes and adjacent Atacama Desert north of 28°S (Fig. 11). During the deglacial period, Bolivia hosted one of the largest megalakes in the Americas, paleolake Tauca, which developed as a result of southward spilling of Lake Titicaca. The lake experienced a modest expansion (Fig. 11; the Sajsi phase) during the LGM. The lake began to rise dramatically starting 18–17 ka and reached its hydrologic maximum between 16.4 ka and 14.1 ka, when the lake covered ~55,000 km2 (Placzek et al, Reference Placzek, Quade and Patchett2006). The timing for the high Tauca shoreline overlaps the hydrologic maximum for Laguna Bebedero at 410–412 m asl during LGE-2 from 14.43–15.67 ka. Paleolake Tauca dropped after 14 ka, overlapping temporally with a well-documented but short dry period in the Andes. Flooding represented by LGE-3 (13.02–14.23 ka) probably reflects persistence of Andean glaciers, despite local retreat, between wet intervals.
Regional summary and comparison to other records. Vertical gray shading indicates the late glacial stadial periods Heinrich 1 (H1) and Younger Dryas (YD). Other indicated climate periods are the Bølling-Allerød (BA) and last glacial maximum (LGM). (a) Bebedero flood record with modern playa and high shoreline indicated by horizontal dashed lines. (b) Lake-level fluctuations of paleo-Lake Uyuni-Coipasa-Po'opo from the Altiplano of central and southern Bolivia (~19°S), as reconstructed by 14C (black circles; lines indicate age uncertainty) and U-series dates (red squares) on tufa and fossil shell material (Placzek et al., Reference Placzek, Quade and Patchett2006). The main lake cycles are named and the general lake-level history is shaded in green. (c) Summed distribution of probability plots of 10Be ages of glacial moraines given in blue from the Cordillera Oriental of the Andes at ~24°S (Martini, et al., Reference Martini, Kaplan, Strelin, Astini, Schaefer, Caffee and Schwartz2017). (d) δ18O (VPDB)calcite record from speleothem Bt2 in Botuverá Cave, southern Brazil (Cruz et al., Reference Cruz, Burns, Karmann, Sharp and Vuille2006). (e) Record of 231Pa/ 231Th from planktic foraminifera from the Bermuda Rise (McManus et al., Reference McManus, Francois, Gherardi, Keigwin and Brown-Leger2004). Higher ratios (down) denote periods of virtually complete shutdown of Atlantic meridional overturning circulation.

Paleolake Tauca rebounded briefly during the period 13–11 ka, referred to as the Coipasa lake phase. Temporally, this overlaps with LGE-4 to LGE-6 at Bebedero. Nearby regions such as the Atacama Desert of Chile also contain evidence of anomalously wet late-glacial conditions. In recognition of the regional synchroneity of these late glacial hydrologic changes, the older humid period from 17–14 ka is referred to as the Central Andean Pluvial Event I or CAPE I, and the 13–11 ka event as CAPE II (Fig. 11; Latorre et al., Reference Latorre, Betancourt and Arroyo2006; Nester et al., Reference Nester, Gayó, Latorre, Jordan and Blanco2007; Quade et al., Reference Quade, Rech, Betancourt, Latorre, Quade, Rylander and Fisher2008). The three main expressions of these events in the Atacama Desert are: 1) rise of the water table along eastern margin of the desert and resultant expansion of paleowetlands (Latorre et al., Reference Latorre, Betancourt and Arroyo2006; Quade et al., Reference Quade, Rech, Betancourt, Latorre, Quade, Rylander and Fisher2008; Santoro et al., Reference Santoro, Capriles, Gayo, de Porras, Maldonado, Standen and Latorre2016; Workman, Reference Workman, Rech, Gayó, Santoro, Ugalde, De Pol-Holz, Capriles and Latorre2020), 2) growth of riparian forest along water courses draining the Pacific slope of the Andes (Latorre et al., Reference Latorre, Betancourt and Arroyo2006; Nester et al., Reference Nester, Gayó, Latorre, Jordan and Blanco2007), and 3) expansion of vegetation zones downward and westward along the eastern fringe of the Atacama Desert (Betancourt et al., Reference Betancourt, Latorre, Rech, Quade and Rylander2000; Latorre et al., Reference Latorre, Betancourt and Arroyo2006). CAPE II also was the time of the radiation of Paleoindian populations into the otherwise uninhabitable the Atacama Desert (Gayo et al., Reference Gayo, Latorre and Santoro2015; Santoro et al., Reference Santoro, Capriles, Gayo, de Porras, Maldonado, Standen and Latorre2016).
Well-dated speleothem records from South America indicate a clear correlation of Heinrich stadials with intensification (Stríkis et al., Reference Stríkis, Cruz, Barreto, Naughton, Vuille, Cheng and Voelker2018) and a southward shift of the ITCZ and SASM into the mid-latitudes during CAPE I and II (Cruz et al., Reference Cruz, Burns, Karmann, Sharp and Vuille2006). Many studies have suggested that the strength and position of the ITCZ is closely tied to the interhemispheric surface air and sea-surface temperature gradient (Yoshimori and Broccoli, Reference Yoshimori and Broccoli2008; Cvijanovic and Chang, Reference Cvijanovic and Chiang2013), and North Atlantic cooling during Heinrich stadials would have favored a southward displacement with of the ITCZ. The greatest interhemispheric gradient of the last 60 ka appears to have developed during Heinrich Stadial I, when the Southern Hemisphere was warmed but the Northern Hemisphere remained very cold.
The period spanning CAPE I and II also correlates with a major advance of glaciers in the arid Andes of both Chile and Argentina, despite global warming after 18 ka, and in apparent response to increasing rainfall connected to southward shift in the SASM (Martini et al., Reference Martini, Kaplan, Strelin, Astini, Schaefer, Caffee and Schwartz2017; Zech et al., Reference Zech, Terrizzano, García-Morabito, Veit and Zech2017). This would have increased rock avalanches and ice avalanches and subsequent blockages and damming caused by these avalanches, which ultimately would have led to catastrophic lake releases and large-scale flooding. At some locations, major hillslope failures leading to lake blockages appear to date to the CAPE I–II period in this region (Hermanns et al., Reference Hermanns, Niedermann, Ivy-Ochs and Kubik2004, but also see Trauth et al., Reference Trauth, Bookhagen, Marwan and Strecker2003).
The early to mid-Holocene gap in flooding at Bebedero is in some ways the most intriguing feature of the record and suggests that the 28–34°S sector of the Andes was extremely dry and devoid of large rainfall events and major ice accumulations. Low summer insolation during this period should have been conducive to cool summers and ice accumulation. However, the lack of rainfall, the result of a weaker South American summer monsoon and a northerly position of the ITCZ, apparently counter-balanced the low summer insolation.
The final period of flooding at Bebedero in the late Holocene generally coincides with expansion of Antarctic sea ice (Hodell et al., Reference Hodell, Kanfoush, Shemesh, Crosta, Charles and Guilderson2001), neo-glacial cooling, increased moisture, and glacial advance (Villagrán and Varela, Reference Villagrán1990; Abbott et al., Reference Abbott, Binford, Brenner and Kelts1997; Lamy et al., Reference Lamy, Hebbeln and Wefer1999; Jenny et al., Reference Jenny, Wilhelm and Valero-Garcés2003; Weide et al., Reference Weide, Fritz, Hastorf, Bruno, Baker, Guedron and Salenbien2017) in the central and southern Andes; and increased moisture in the nearby Atacama Desert (Gayo et al., Reference Gayo, Latorre, Santoro, Maldonado and De Pol-Holz2012a, Reference Gayo, Latorre, Jordan, Nester, Estay, Ojeda and Santoro2012b) starting after 3500–3000 yr BP. In response, populations and irrigated desert agriculture expanded in highland Bolivia and in the core and eastern margins of the Atacama Desert during what archeologists refer to as the Formative Period (Binford et al., Reference Binford, Kolata, Brenner, Janusek, Seddon, Abbott and Curtis1997; Gayo et al., Reference Gayo, Latorre, Santoro, Maldonado and De Pol-Holz2012a, Reference Gayo, Latorre, Jordan, Nester, Estay, Ojeda and Santoro2012b; Santoro et al., Reference Santoro, Capriles, Gayo, de Porras, Maldonado, Standen and Latorre2016; Uribe et al., Reference Uribe, Angelo, Capriles, Castro, de Porras, García and Gayo2020). Many records from the sub-tropical Andes point to a strengthening of the SASM during the Little Ice Age (Reuter et al., Reference Reuter, Stott, Khider, Sinha, Cheng and Edwards2009; Bird et al., Reference Bird, Abbott, Vuille, Rodbell, Stansell and Rosenmeier2011; Vuille et al., Reference Vuille, Burns, Taylor, Cruz, Bird, Abbott, Kanner, Cheng and Novello2012; Bernal et al., Reference Bernal, Cruz, Stríkis, Wang, Deininger, Catunda, Ortega-Obregón, Cheng, Edwards and Auler2016; Rojas et al., Reference Rojas, Arias, Flores-Aqueveque, Seth and Vuille2016), in line with evidence of flooding (LHE-4) from Bebedero.
CONCLUSIONS
In this study, we present multiple lines of geologic and isotopic evidence showing that Bebedero Basin was flooded repeatedly during the intervals 24–18 ka, 16.8–11.4 ka and 2.6–0.2 ka by waters that traveled ≥200 km from the high Andes between 28–34°S. Our modeling suggests that these floods required the release of water volumes >100 x 106 m3 with peak discharges >1000 m3 s-1. The largest historic floods at mid to high latitudes are related to catastrophic release of lake waters dammed in the narrow valleys of the Andes by advancing/surging ice and rock avalanches. Major increases in ice cover or rock avalanches in this extremely dry sector of the Andes are limited more by moisture than by temperature. This may explain why the chronology of late glacial flooding at Bebedero closely matches the periods of megalake development and wetland expansion in the subtropical latitudes of Chilean Atacama Desert and Bolivian Altiplano. The underlying cause for this climate change is considered to be southward expansion of the SASM due to deep cooling of the North Atlantic. This shift of the subtropical rainfall belt now appears to have reached south of 28°S. The late Holocene flood events recorded in the Bebedero Basin appear to be part of a large-scale neoglacial wetting event that coincided with major population increases and expansion of agriculture in the Andes and Atacama.
Future work will focus on studying the alluvial history and flood features of the Río Tunuyán and Río Desaguadero, thereby improving model estimates of flood magnitude and timing. During our studies, we also noted a range of previously unrecognized large flood features that lie outside the Bebedero Basin, and hence the scope of this study. Similar features may also lie at the mouths of other rivers draining the Andes, and if so, may have similar implications for sediment transport in these other river systems. Finally, the Salinas del Bebedero would be an interesting coring target to obtain a more complete record of basin flooding because the exposed record documented there is biased toward the largest flood events that left vestiges well above the modern basin floor.
Supplementary material
The supplementary material for this article can be found at https://doi.org/10.1017/qua.2022.1
Acknowledgments
This study was supported by the Comer Family Foundation and NSF EAR-1702438 to McGee and Quade. This paper is in remembrance and acknowledgment of the contribution of Wally Broecker and his wife Elizabeth Clark to this study and our field in general. We also thank Dr. Jorge Strelin for his support of the project, and Mike Kaplan and Kathleen Springer for thoughtful discussions and review. Giovanni Zanchetta provided helpful comments on the manuscript. Any use of trade, firm, or product names is for descriptive purposes only and does not imply endorsement by the U.S. Government.