


Over the past five decades, the prevalence of childhood overweight and obesity has continued to rise globally, increasing from 0.7−0.9% to 5.6−7.8% (Dobbie et al., Reference Dobbie, Pittam, Zhao, Alam, Hydes, Barber and Cuthbertson2023). According to the World Obesity Federation, it is estimated that 206 million children and adolescents will be living with obesity in 2025 (Eslam et al., Reference Eslam, Alkhouri, Vajro, Baumann, Weiss, Socha, Marcus, Lee, Kelly, Porta, El-Guindi, Alisi, Mann, Mouane, Baur, Dhawan and George2021). Childhood overweight and obesity are associated with numerous direct health impacts on children, including type 2 diabetes, obstructive sleep apnea, hypertension, dyslipidemia and metabolic syndrome, as well as anxiety and depression (Daniels et al., Reference Daniels, Arnett, Eckel, Gidding, Hayman, Kumanyika, Robinson, Scott, St Jeor and Williams2005; Jebeile et al., Reference Jebeile, Kelly, O’Malley and Baur2022; Kumar & Kelly, Reference Kumar and Kelly2017; Simmonds et al., Reference Simmonds, Llewellyn, Owen and Woolacott2016). Furthermore, studies have shown that children with obesity are five times more likely to remain obese in adulthood (Lobstein, Reference Lobstein2019), thereby amplifying the risk of cardiovascular diseases, diabetes, and cancer later in life (Daniels et al., Reference Daniels, Arnett, Eckel, Gidding, Hayman, Kumanyika, Robinson, Scott, St Jeor and Williams2005; Kumar & Kelly, Reference Kumar and Kelly2017; Simmonds et al., Reference Simmonds, Llewellyn, Owen and Woolacott2016).
The pathogenesis of overweight and obesity is complex and multifactorial, involving the interplay of genetic, epigenetic, and environmental factors (Vourdoumpa et al., Reference Vourdoumpa, Paltoglou and Charmandari2023). A genome-wide association study (GWAS) meta-analysis (Yengo et al., Reference Yengo, Sidorenko, Kemper, Zheng, Wood, Weedon, Frayling, Hirschhorn, Yang and Visscher2018) identified 941 BMI-associated loci single nucleotide polymorphisms (SNPs); however, these loci collectively accounted for only 6% of the variance in BMI, explaining only a small portion of overall variability in BMI (Kaprio, Reference Kaprio2012). Gene-environment interaction (G × E), in which specific environmental exposures amplify or attenuate genetic influences on BMI, may help explain the missing heritability.
Breastfeeding has been identified as a potential protective factor against childhood overweight and obesity (Huang et al., Reference Huang, Gao, Zhu, Yuan, Li, Feng, Gao and Yu2022; Jin et al., Reference Jin, Shan, Li, Fan, Zhao, Li, Tang, Saffery, Tong, Wen, Qi, Kilby and Baker2022), with some studies suggesting that breastfeeding may modify the genetic effects on obesity risk by regulating DNA methylation levels and the expression of high-risk alleles (Pauwels et al., Reference Pauwels, Symons, Vanautgaerden, Ghosh, Duca, Bekaert, Freson, Huybrechts, Langie, Koppen, Devlieger and Godderis2019; Wu et al., Reference Wu, Lye and Briollais2017).
Given the shared genetic and environmental backgrounds, twins provide a powerful model for investigating the genetic epidemiology of complex traits and diseases as well as G × E (Boomsma et al., Reference Boomsma, Busjahn and Peltonen2002). By utilizing the differing genetic similarities between MZ (monozygotic) and DZ (dizygotic) twins, phenotypic variation can be decomposed into genetic and environmental effects through structural equation modeling. Analyzing the impact of specific environmental factors on the latent genetic and environmental effects allows us to test whether the heritability of a phenotype varies across different environmental levels. This helps in exploring the G × E from an overall genetic background perspective and furthering our understanding of the pathogenesis of childhood overweight and obesity (Kaprio, Reference Kaprio2012).
However, evidence of G × E on BMI is largely limited, particularly in twin studies. The objective of the current study was to investigate the gene-breastfeeding interaction on BMI based on the Chinese National Twin Register (CNTR).
Methods
Study Population
We recruited twins aged 2−18 years based on a nationwide Chinese National Twin Registry (CNTR) between 2015 and 2018. Data were collected in eight provinces of China, which geographically covered northern (Beijing, Tianjin and Shandong) and southern (Shanghai, Jiangsu, Yunnan) regions. The study design, data collection procedures, and population characteristics of the CNTR have been detailed elsewhere (Gao et al., Reference Gao, Cao, Lv, Yu, Wu, Wang, Meng, Wang, Wang, Pang, Yu, Wang, Wu, Dong, Wu, Jiang, Wang, Liu, Deng and Li2019). Eligibility criteria included (1) same-sex twins aged 2−18; and (2) twin members both available for age, sex, BMI, feeding patterns.
We excluded 217 participants who were triplets and those where only one of the twin pairs was collected. We further excluded 143 pairs with under 3 or over 3 z score of log-transformed age-specific BMI or whose weight was less than the birth weight. In total, 4573 twin pairs were included.
Ethical approval of the present study has been granted by Biomedical Ethics Committee at Peking University, Beijing, China. Written informed consent from all study participants had been provided. This study was granted by the Biomedical Ethics Committee at Peking University, Beijing, China (approval number: IRB00001052-14021).
Definition and Measurement
All data in this study were collected via face-to-face questionnaires, completed by the twins themselves or their parents/guardians. To detect whether the gene-environment interaction fluctuated through a growth period, participants were stratified into six age groups (2, 3−5, 6−8, 9−11, 12−14, 15−17). The age group 2−years corresponds to 2.00−2.99 years, 3−5 years to 3.00−5.99 years, and so on. Feeding patterns were divided into three parts, including exclusive breastfeeding, mixed feeding and artificial feeding, based on the main feeding pattern during the first 4 months of life. Twin zygosity was primarily determined based on a questionnaire method. First, opposite-sex twins were considered as DZ. Then, for twins sharing the same gender, they were asked the following question: ‘During childhood, were you and your twin partner alike?’ with three possible answers: (1) ‘We were as alike as two peas in a pod and were frequently mistaken for one another by strangers’, (2) ‘We were not more alike than siblings in general’, and (3) ‘Hard to say’. If the answer was (1), they were considered to be MZ; if the answer was (2), then they were considered to be DZ; and if the answer was (3), they were excluded. The accuracy of this method has been validated in a subgroup of the CNTR, which revealed a high accuracy of >90% agreement with genetic markers (Jackson et al., Reference Jackson, Snieder, Davis and Treiber2001; Song et al., Reference Song, Lee, Lee, Lee, Lee, Hong, Han and Sung2010).
Statistical Analysis
All analyses in this study were based on cross-sectional data. Participants were stratified into six age groups, and all analyses were conducted separately within each age group to minimize potential confounding by age. The statistical analyses consisted of three components: cross-sectional descriptive analyses, heritability estimation, and G × E analyses. In the cross-sectional analyses, logistic mixed-effects models or linear mixed-effects models were used to compare the distributions of variables between MZ and DZ twins. Cross-sectional analyses were performed using R version 4.3.3, and statistical significance was defined as p< .05.
Heritability estimation and G × E analyses were conducted using structural equation modeling (SEM) implemented in the OpenMx package in R.
Heritability Analysis
Within each age group, we used SEM to estimate the heritability of BMI (Hagenbeek et al., Reference Hagenbeek, Hirzinger, Breunig, Bruins, Kuznetsov, Schut, Odintsova and Boomsma2023). The model decomposes the phenotypic variation (i.e., variance) into four components: (1) additive genetic effect variance (A, the cumulative effect of alleles); (2) nonadditive genetic effect variance (D, dominant effect variance resulting from interactions between alleles at the same locus and epistatic effect variance arising from interactions between alleles at different loci); (3) common environmental effect variance (C, variance due to environmental factors shared within twin pairs); and (4) unique environmental effect variance (E, variance due to environmental factors not shared within twin pairs).
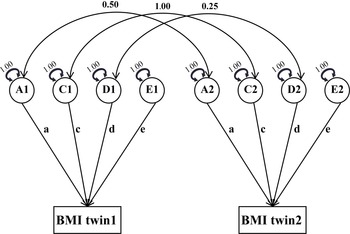
Among twins raised together, MZ twins share 100% of their alleles and the same environment, while DZ twins share, on average, 50% of their alleles but the same environment. As a result, the correlation coefficient for A is 1.0 in MZ twins (rAMZ) and 0.5 in DZ twins (rADZ). For D, it is 1.0 in MZ twins (rDMZ) and 0.25 in DZ twins (rDDZ). The correlation coefficient for C is 1.0 in both MZ (rCMZ) and DZ twins (rCDZ), while for E, it is 0 in both groups (rEMZ, rEDZ) (Figure 1).
Structural equation model.

Figure 1 Long description
A structural equation model diagram representing the factors influencing BMI in twins. The diagram includes two main sections labeled BMI twin1 and BMI twin2. Each section has five circles labeled A1, C1, D1, E1 for twin1 and A2, C2, D2, E2 for twin2. Arrows indicate relationships between these circles and the BMI of each twin. The arrows have values indicating the strength of the relationships, such as 0.50, 1.00, and 0.25. Each circle has a self-loop arrow with a value of 1.00. The labels a, c, d, and e connect the circles to the BMI boxes for each twin.
Denoting the contributions of A, C, D, and E to the total phenotypic variance as a, c, d, and e, respectively. Taking the ACE model as an example, the expected covariance between twin pairs is:
CovMZ=a2+c2
CovDZ=0.5×a2+c2
By comparing the covariance differences between MZ and DZ twins, the values of a, c, and e can be estimated, thereby assessing the contributions of different effects to the total phenotypic variance.
In twins reared together, due to model identification constraints, we selected either the ACE or ADE model according to the intraclass correlation (ICC) coefficient in MZ (rMZ) and DZ (rDZ). As previously mentioned, the relationships between the correlation coefficients for MZ and DZ twin pairs are rAMZ = 2rADZ, rDMZ = 4rDDZ, rCMZ = 4rCDZ. Therefore, if D has an impact on phenotypic variation, it would lead to a significantly higher similarity in MZ compared to DZ. The effect of C, however, would reduce the difference in similarity between MZ and DZ. Consequently, if rMZ < 2rDZ, the ACE model should be selected; otherwise, select the ADE model. Our data showed the BMI ICC coefficient in MZ (0.78−0.90) did not exceed twice that of DZ (0.63−0.78) in all age groups. Thus, the ACE model was used to analyze BMI variance.
The sources contributing to BMI variance were first estimated by A, C, and E components. Then we tested AE models (excluding C) using likelihood ratio tests. If AE models were not significantly different from ACE models, AE models were used for further analysis. CE models were also tested in a similar way with ACE models. Age and sex were adjusted in all models.
Interaction Analysis
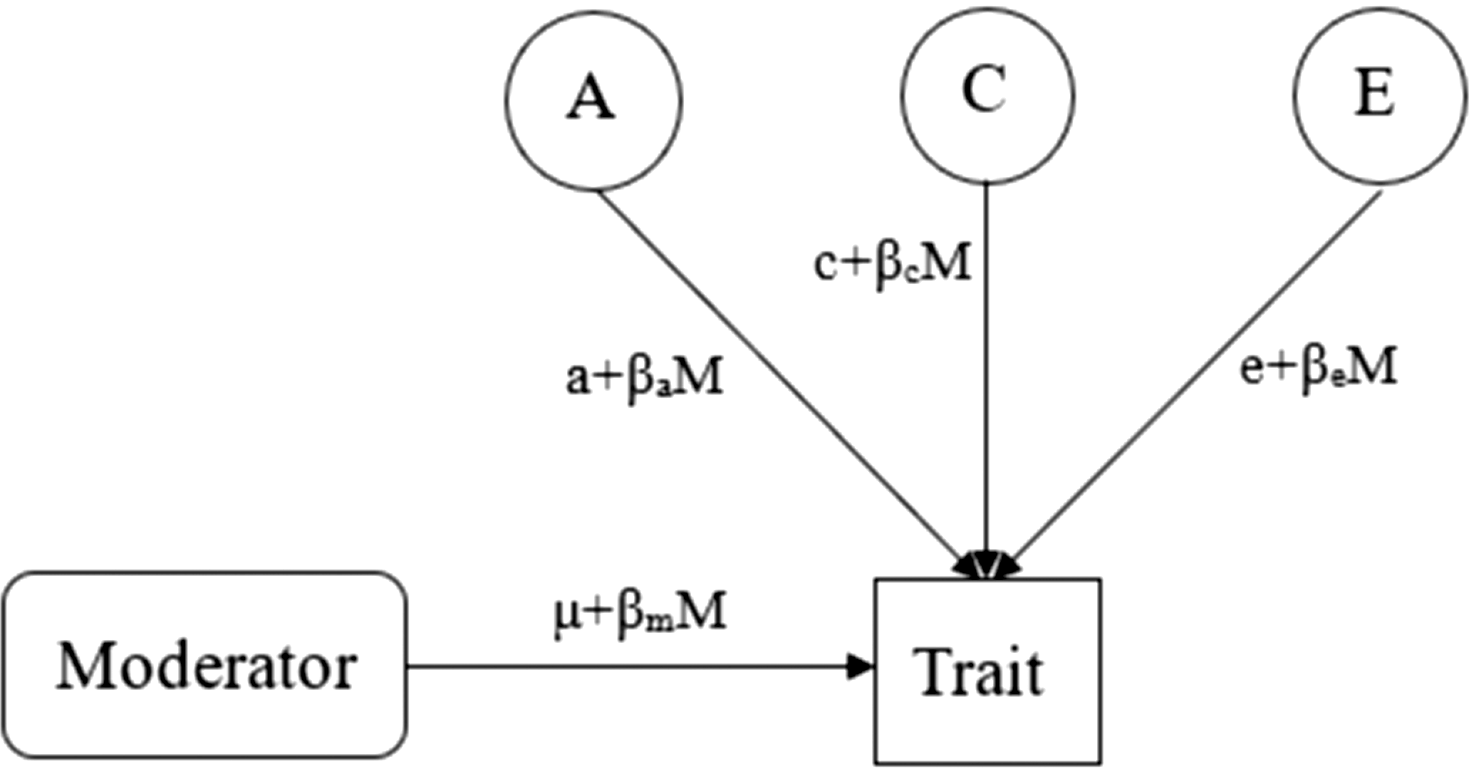
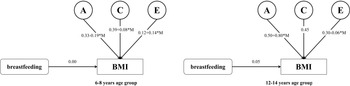
After analyzing the genetic components of the variance in BMI, we performed a G×E model using feeding pattern as a moderator (Purcell, Reference Purcell2002). As illustrated in Figure 2, this model extends the classical twin model by allowing the path coefficients for additive genetic (A), shared environmental (C), and nonshared environmental (E) effects to vary as linear functions of the moderator (M; feeding pattern in this study), such that “a(M) = a+βaM”, “c(M)=c+βcM”, “e(M) = e+βeM”. Accordingly, βa, βc, and βe represent the moderation effects of feeding pattern on the A, C, and E variance components respectively. Feeding pattern was coded as 0 (artificial feeding), 1 (mixed feeding) and 2 (breastfeeding).
Gene-environment interaction model.
Note: βa, βc, and βe are feeding pattern-moderated components of A, C, E; μ is the constant term; βm is the regression coefficient for M.

G × E models were fitted within the ACE framework, which was consistent with the classical twin modeling results across all age groups. Model fitting followed a likelihood-based approach: a full model including βa, βc, and βe was first estimated, after which nested submodels were fitted by constraining each moderation parameter to zero. Likelihood ratio tests were used to assess whether parameter constraints led to a significant deterioration in model fit, and among all acceptable models, the final model was selected based on the lowest Akaike Information Criterion (AIC). Evidence for gene-environment interaction was inferred when the best-fitting model retained a non-zero βa.
Results
Characteristics of the Study Population
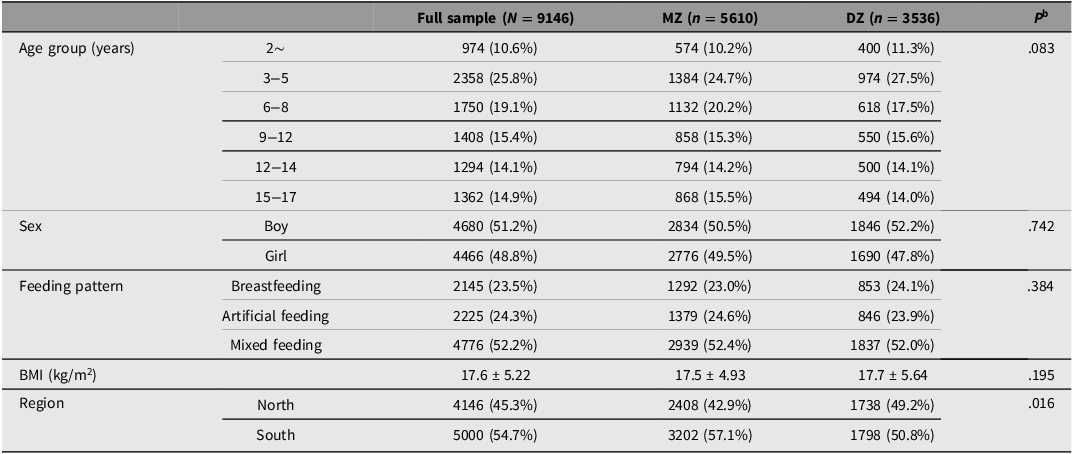
A total of 4573 pairs of same-sex twins consisting of 2805 (61.3%) MZ twin pairs were included in the present study. The basic characteristics of the participants are presented in Table 1. The median age of the study subjects was 7 years (IQR: 3-11), with boys accounting for 51.2% in all participants. Among the feeding methods, mixed feeding had the highest proportion (52.2%), followed by exclusive breastfeeding at 23.5%. The average BMI was 17.6 ± 5.2 kg/m2. Apart from the age composition, there were no statistically significant differences in sex, region, feeding method, and BMI distribution between MZ and DZ twins.
The characteristics of the study population by zygositya

Table 1 Long description
The table presents the characteristics of a study population by zygosity, divided into full sample, MZ, and DZ groups. It has 11 rows and 6 columns. The columns are labeled as follows: Age group (years), Full sample (N = 9146), MZ (n = 5610), DZ (n = 3536), and P. The row labels include different age groups (2, 3-5, 6-8, 9-12, 12-14, 15-17), sex (Boy, Girl), feeding pattern (Breastfeeding, Artificial feeding, Mixed feeding), BMI (kg/m2), and region (North, South). Each cell contains the count and percentage of participants in each category. Notable trends include the highest proportion of participants in the 3-5 years age group and mixed feeding pattern. The table also shows the distribution of boys and girls, BMI values, and regional differences.
Note: aData are presented as mean ± SD or number (proportion). bComparing the differences between monozygotic (MZ) and dizygotic (DZ) using logistic regression or linear regression with random effects.
Heritability for BMI by Age Group
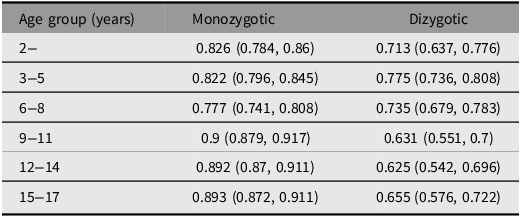
The ICCs of BMI stratified by age are listed in Table 2. All ICCs were higher, but not twice as much higher, in MZ than those in DZ twins, indicating that ACE models should be fitted in the heritability analysis. (Table S1).
Intraclass correlations (ICC) of BMI for 4430 twin pairs

Table 2 Long description
A table comparing intraclass correlations of BMI for monozygotic and dizygotic twins across different age groups. The table has 6 rows and 3 columns. The columns are labeled Age group (years), Monozygotic, and Dizygotic. The rows are labeled with age groups 2-17 years. Row 1: Age group 2-2, Monozygotic 0.826 (0.784, 0.86), Dizygotic 0.713 (0.637, 0.776). Row 2: Age group 3-5, Monozygotic 0.822 (0.796, 0.845), Dizygotic 0.775 (0.736, 0.808). Row 3: Age group 6-8, Monozygotic 0.777 (0.741, 0.808), Dizygotic 0.735 (0.679, 0.783). Row 4: Age group 9-11, Monozygotic 0.9 (0.879, 0.917), Dizygotic 0.631 (0.551, 0.7). Row 5: Age group 12-14, Monozygotic 0.892 (0.87, 0.911), Dizygotic 0.625 (0.542, 0.696). Row 6: Age group 15-17, Monozygotic 0.893 (0.872, 0.911), Dizygotic 0.655 (0.576, 0.722).
Note: Intraclass correlations (ICCs) denote within-pair twin correlations derived from maximum-likelihood estimates of the covariance matrices in saturated models. Estimates are shown for monozygotic (MZ) and dizygotic (DZ) twins with 95% confidence intervals.
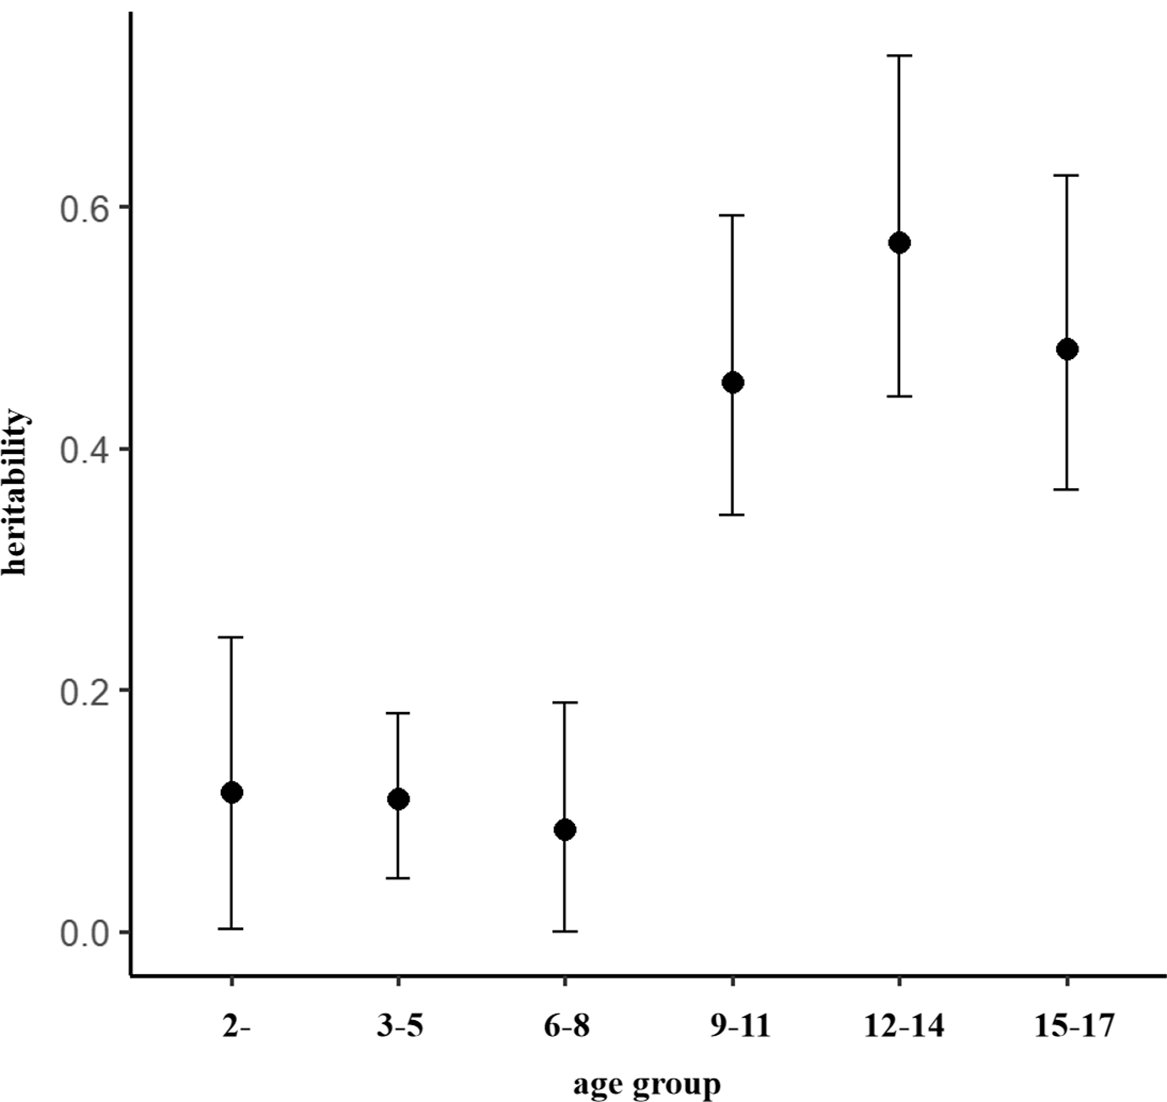
The trend of how A, C, and E contribute to BMI across different age groups is shown in Figure 3. With the increase in age, the heritability of BMI first decreased and then increased. The 6- to 8-years age group achieved the lowest heritability value (h2: 0.08, 95% CI [0.00, 0.19]) and the 12- to 14-years age group achieved the highest (h2: 0.57, 95% CI [0.44, 0.72]) (Table S2).
Heritability for BMI among twins by age groups.

Gene-Breastfeeding Interaction on BMI
The results for gene-breastfeeding interaction are shown in Figure 4. We found gene-breastfeeding interaction effect on BMI only in the 6- to 8- and 12- to 14-year age group. In the 6- to 8- year age group, breastfeeding can decrease the genetic effects on BMI (βa: −0.19; 95% CI [−0.25, −0.13]). In the 12- to 14-year age group, however, breastfeeding can increase the genetic effects on BMI (βa: 0.08; 95% CI [0.02, 0.15]).
The result of gene-breastfeeding interaction model on BMI.

Discussion
Our study found that as age increases, the heritability of BMI shows an increasing trend, being the lowest in the 6- to 8-year-old group and the highest in the 12- to 14-year-old group. Additionally, we discovered that breastfeeding may reduce the genetic effects on BMI in the 6- to 8-year-old group, while increasing the genetic effects on BMI in the 12- to 14-year-old group.
Our study provides novel evidence of a gene-environment interaction between breastfeeding and BMI. To the best of our knowledge, no prior research has employed classical twin modeling to investigate this interaction. Thus, it is difficult to compare our results with the previous study.
Some evidence from the general population may support our study. Studies have found that the mechanisms through which breastfeeding affect long-term health outcomes could be through epigenetics, such as changes in DNA methylation (Pauwels et al., Reference Pauwels, Symons, Vanautgaerden, Ghosh, Duca, Bekaert, Freson, Huybrechts, Langie, Koppen, Devlieger and Godderis2019), and the DNA methylation effects of breastfeeding may have varying impacts on the development of BMI. For example, breastfeeding can counteract the adverse effects of the PPARG2 Pro12Ala polymorphism on adolescents’ BMI (Verier et al., Reference Verier, Meirhaeghe, Bokor, Breidenassel, Manios, Molnár, Artero, Nova, De Henauw, Moreno, Amouyel, Labayen, Bevilacqua, Turck, Béghin, Dallongeville and Gottrand2010); it is associated with a decrease in methylation levels at the cg00574958 locus of CPT1A (Aglio et al., Reference Aglio, Rijlaarsdam, Mulder, Neumann, Felix, Kok, Bakermans-Kranenburg, van IJzendoorn, Tiemeier and Cecil2022), which may reduce the risk of high triglycerides and hyperglycemia. At the same time, breastfeeding is also related to an increase in the expression of the LEP gene (Obermann-Borst et al., Reference Obermann-Borst, Eilers, Tobi, de Jong, Slagboom, Heijmans and Steegers-Theunissen2013), thereby inhibiting the expression of the LEP gene, leading to decreased leptin secretion and increased appetite (Pauwels et al., Reference Pauwels, Symons, Vanautgaerden, Ghosh, Duca, Bekaert, Freson, Huybrechts, Langie, Koppen, Devlieger and Godderis2019). In addition, the association between breastfeeding and BMI-related genes may exhibit age specificity. An epigenome wide association study (EWAS) analysis (Aglio et al., Reference Aglio, Rijlaarsdam, Mulder, Neumann, Felix, Kok, Bakermans-Kranenburg, van IJzendoorn, Tiemeier and Cecil2022) identified six CpG sites associated with breastfeeding duration. Among these, one CpG site demonstrated a consistent directional association during infancy and childhood but not at birth, two CpG sites showed associations only in infancy, and the remaining site was associated with breastfeeding only at birth. Another study (Obermann-Borst et al., Reference Obermann-Borst, Eilers, Tobi, de Jong, Slagboom, Heijmans and Steegers-Theunissen2013) found that breastfeeding is related to the LEP methylation at the age of 10, but this association does not exist at the age of 18.
Thus, a possible explanation for our findings is that breastfeeding may modify the expression of various BMI-related genes as children grow into adolescence. This could influence BMI through different mechanisms at different stages of development, resulting in varying degrees of modification. Moreover, it is noteworthy that the developmental trajectory of children’s BMI exhibits a pattern analogous to the findings of this study: there is a decline from 9 months to 5−6 years of age, followed by a consistent ascent toward adulthood. This indicates that these ages may represent critical transition points in the process of BMI development.
Our study included a large population-based sample of twins from eight areas in China. We explored the gene-breastfeeding interaction of BMI over childhood and adolescence for the Chinese population. This study also has certain limitations. First, the data of our study were obtained from cross-sectional baseline information from the CNTR, and the results of genetic and environmental changes were confined to groups of people of different ages rather than individuals from birth towards adulthood. Therefore, we cannot exclude the impact of birth cohort effect (i.e., changes of common environmental factors related to obesity for younger age groups in the present study may slow down the truly sharp increasing heritability). Second, we used self- or parent-reported weights and heights for the study, which may cause recall bias. Third, we did not consider the duration of breastfeeding and other unmeasured variables, which may cause a certain degree of information loss (Obermann-Borst et al., Reference Obermann-Borst, Eilers, Tobi, de Jong, Slagboom, Heijmans and Steegers-Theunissen2013).
In conclusion, using a large population-based sample of twins from eight provinces/cities in China, this study provided an overall profile of the gene-breastfeeding interaction on BMI within a twin population. Considering the metabolic diversity of obesity, this study can help understand the role of breastfeeding from the perspective of the overall genetic background, unravelling the complex ways in which genes and environments interact to influence obesity.
Supplementary material
To view supplementary material for this article, please visit https://doi.org/10.1017/thg.2026.10052.
Acknowledgments
We thank all the participants and project staff who participated in the Chinese National Twin Registry for their contributions.
Financial support
The authors gratefully acknowledge the support of the National Key Research and Development Program of China (2023YFC2705900), National Natural Science Foundation of China (82373659, 82073633), Special Fund for Health Scientific Research in Public Welfare (201502006, 201002007), and Peking University Outstanding Discipline Construction Project of Epidemiology and Biostatistics.
Competing interests
None.
Ethical standards
This study was approved by the Biomedical Ethics Committee at Peking University, Beijing, China (IRB00001052-14021).