

Attention deficit hyperactivity disorder (ADHD) is a developmental condition characterised by impairing levels of inattentive, impulsive and hyperactive symptoms (Ref. 1), with a prevalence of around 5% in school-aged children (Ref. Reference Polanczyk and Jensen2). The disorder frequently persists into adult life, with approximately 15% of children with ADHD retaining the diagnosis by the age of 25 years and a further 50% showing persistence of some symptoms giving rise to continued impairments (Ref. Reference Faraone3).
ADHD tends to run in families, with a risk of ADHD to first-degree relatives of an affected proband around four to ten times the general population rate (Ref. Reference Faraone, Biederman and Monuteaux4). Twin studies suggest that around 70–80% of the phenotypic variance is explained by genetic factors (Ref. Reference Faraone5). Such quantitative genetic studies suggest that ADHD represents the extreme of one or more continuously distributed traits, rather than a distinct categorical disorder (Refs Reference Goodman and Stevenson6, Reference Biederman7, Reference Chen8, Reference Levy9, Reference McLoughlin10). The conceptualisation of ADHD symptoms as continuous traits (Ref. Reference McLoughlin10) seems to better reflect the underlying aetiological processes involved, in which risk factors for ADHD influence levels of ADHD symptoms throughout the population (Ref. Reference Chen8). Overall, quantitative genetic studies support the use of both categorical and quantitative trait locus approaches in the investigation of genetic risk factors for ADHD (Ref. Reference Plomin, Owen and McGuffin11) and the underlying neurobiological processes involved.
Candidate gene studies for ADHD implicate genetic variants involved in the regulation of dopamine and related neurotransmitter systems, predicted by the effects of stimulant medications that increase the amount of synaptic dopamine (Ref. Reference Swanson12). The most consistent evidence of genetic associations with ADHD is for variants within or near the genes for the dopamine D4 receptor (DRD4) and D5 receptor (DRD5) (Ref. Reference Li13). There are numerous, yet inconsistent, reports of association with the dopamine transporter gene, which nevertheless seem to implicate this gene with associated polymorphisms found in two distinct regions (Refs Reference Li13, Reference Brookes14, Reference Asherson15, Reference Maher16, Reference Purper-Ouakil17, Reference Yang18, Reference Gizer, Ficks and Waldman19). Other neurotransmitter systems are also likely to be involved. For example, serotonin is linked to poor impulse regulation (Ref. Reference Lucki20), low platelet and whole-blood levels of serotonin have been reported in ADHD (Ref. Reference Spivak21), and several studies report association between ADHD and the serotonin transporter and serotonin 1B receptor genes (Ref. Reference Gizer, Ficks and Waldman19).
Such studies have, however, had only limited success in identifying risk alleles for ADHD, major limitations being the low risk conferred by individual genetic variants and insufficient sample size (Ref. Reference Kuntsi22). Recent genome-wide association scans found no genetic variants that passed genome-wide levels of significance, although there was evidence for association in a group analysis of 51 nominated candidate genes (Refs Reference Neale23, Reference Neale24, Reference Brookes25). A potential novel finding is association with the cadherin gene (CDH13), which was implicated in more than one genome-wide association study of ADHD (Refs Reference Lasky-Su26, Reference Lesch27, Reference Franke, Neale and Faraone28) and lies within the only region that reached genome-wide significance in a meta-analysis of ADHD linkage studies (Ref. Reference Zhou29). This finding and other hints from genome-wide association studies indicate that genes involved in cell division, cell adhesion, neuronal migration and neuronal plasticity may also be implicated in ADHD (Ref. Reference Franke, Neale and Faraone28).
Despite some advances, it is necessary to consider the reasons for the overall lack of progress. The most likely reasons are the presence of multiple genes of very small effect, heterogeneity of aetiological influences, and interactions between genes and the environment (Ref. Reference Kuntsi22). In addition, we do not yet understand the contribution made to ADHD from rare copy number variants, which confer moderate to large effects in some cases (Refs Reference Elia30, Reference Williams31).
One approach to these problems is to gather very large sample sizes needed for sufficient power to detect genes of very small effect. Yet there are complementary strategies that posit that molecular genetic research should not be restricted to the clinical phenotype alone, but should also investigate genetic factors that account for neurobiological processes that underlie the heterogeneity of ADHD.
The intermediate phenotype (endophenotype) concept
Intermediate phenotype research aims to identify neurobiological processes that mediate between genes and behaviour and might therefore be more proximal to gene function (Ref. Reference Gottesman and Gould32). Key criteria for endophenotypes are listed in Box 1. Intermediate phenotypes may be less heterogeneous and genetically less complex than behavioural phenotypes, and potentially associated with greater effect sizes from individual genes. For example, some risk alleles may explain up to 10% of phenotypic variance for certain functional magnetic resonance imaging (fMRI) phenotypes (Refs Reference Green40, Reference Munafò, Brown and Hariri41). Furthermore, investigation of measures related directly to brain function is required if we wish to explain the neurobiological processes that underlie risk for ADHD.
Box 1 Criteria for intermediate phenotypesFootnote a
Intermediate phenotypes should:
(1) be associated with the clinical disorder;
(2) be reliable, as reliability sets an upper limit on the estimates of heritability [any deviations from perfect reliability will increase measurement error and therefore nonshared environmental influences (Ref. Reference Kuntsi33)];
(3) be heritable;
(4) be stable over time and independent of state such that they manifest in an individual whether or not the disorder is active (this criterion has more relevance to fluctuating state-like conditions such as schizophrenia or major depression than to the trait-like condition of ADHD);
(5) co-segregate with the disorder within families;
(6) for disorders with complex inheritance patterns such as ADHD, be found in nonaffected family members at a higher rate than the general population;
(7) be associated with a candidate gene or region of a gene;
(8) share genetic influences with the disorder;
(9) mediate genetic effects between phenotype and genotype rather than reflect pleiotropic influences [multiple outcomes of individual genes (Refs Reference Walters and Owen34, Reference Kovas and Plomin35)]Footnote b.
a The information in this box is based on Refs Reference Gottesman and Gould32, Reference de Geus36.
b For example, shared genetic effects between ADHD and autism (Ref. Reference Ronald37) or reading ability (Ref. Reference Willcutt38) reflect pleiotropic effects of genes rather than processes that mediate between genetic risk factors and ADHD. In a similar way, cognitive performance and other neurobiological measures that share genetic influences with ADHD may reflect the multiple outcomes of the genes involved, rather than necessarily representing processes that mediate between genes and ADHD behaviours. Tests of mediation versus pleiotropy can be used to specifically infer the causal role of a neurobiological process once specific genetic risk factors that are associated with both ADHD and associated neurobiological measure are identified. One other approach would be to test for co-variation of ADHD and neurobiological measures during the treatment response (Ref. Reference Kendler and Neale39).
Several potential intermediate phenotypes have been identified in ADHD (for reviews, see Refs Reference Kuntsi33, Reference Kuntsi42, Reference Doyle43, Reference Castellanos and Tannock44). Here we focus on electrophysiological approaches using electroencephalography (EEG), which records the ongoing electrical activity generated by underlying brain structures, recorded from electrodes placed on the scalp. Electrophysiological parameters are ideal for intermediate phenotype research in ADHD because of the supreme temporal resolution that enables investigation of impairment in individual stages of information processing and abnormal state processes such as arousal, as well as the high reliability and heritability of many electrophysiological measures (Refs Reference Kuntsi, McLoughlin and Asherson45, Reference McLoughlin46). Furthermore, there are consistent findings across studies suggesting abnormal electrophysiological processes in ADHD (Refs Reference Kuntsi, McLoughlin and Asherson45, Reference McLoughlin46) and evidence that some of the impaired processes are developmentally stable (Refs Reference Albrecht47, Reference McLoughlin48). Finally, the noninvasive and cost-effective nature of EEG helps generate the relatively large sample sizes required for molecular genetic studies.
This systematic review evaluates the use of a subset of candidate electrophysiological measures as potential intermediate phenotypes for ADHD, assessing the following: association between the measure and ADHD; heritability of the measure, and the extent to which ADHD and the measure share familial/genetic influences; and associations between the measure and genetic variants.
Quantitative EEG
EEG power
EEG power is quantified into certain frequency bands of interest (defined in Fig. 1) and demonstrates high test–retest reliability (0.71–0.95), particularly for the theta and delta frequency bands (Ref. Reference Williams50).
EEG frequency bands investigated in ADHD. In quantitative EEG, recordings of brain electrical activity at the scalp are quantified in the frequency range of interest, which usually extends between 1 and 70 cycles per second (Hz). In ADHD research, this frequency range is traditionally separated into four frequency bands. Recently, ADHD research has further extended to VLF oscillations below 0.5 Hz. Figure adapted from Malmivuo and Plonsey (Ref. Reference Malmivuo and Plonsey49; © 1995 Oxford University Press) by permission of Oxford University Press, Inc. (http://www.oup.com). Abbreviations: ADHD, attention deficit hyperactivity disorder; EEG, electroencephalography; VLF, very low frequency.

Association with ADHD
Associations between quantitative EEG parameters and ADHD are widely documented (Ref. Reference Barry, Clarke and Johnstone51). Children, adolescents and adults with ADHD were found to show increased theta activity and decreased alpha and beta activity during rest, compared with typical controls (Refs Reference Bresnahan, Anderson and Barry52, Reference Chabot and Serfontein53, Reference Clarke54, Reference Janzen55). Meta-analysis estimated an effect size of 1.3 for increased theta power (Ref. Reference Snyder and Hall56), although not all data are consistent with these findings (Refs Reference Clarke57, Reference Koehler58). This is widely interpreted to indicate the presence of cortical underactivation in ADHD owing to the association of theta activity with drowsiness (Ref. Reference Makeig and Jung59). Additional ADHD–control differences have been reported in evoked gamma oscillations, suggesting neuronal hyperexcitability (Ref. Reference Yordanova60).
Generally, EEG studies indicate a predominance of slow-wave delta and theta in infancy that increases in frequency during childhood (Ref. Reference Benninger, Matthis and Scheffner61), and is therefore thought to reflect brain immaturity (Ref. Reference Hudspeth and Pribram62). In addition, children and adolescents with ADHD show a higher ratio of theta activity, particularly in comparison with faster beta activity, which has led to the suggestion that the disorder is a product of maturational delay (Ref. Reference Mann63). However, there is evidence that the theta to beta ratio is abnormal in adults with ADHD, suggesting that neuronal inefficiency may persist throughout life (Ref. Reference Bresnahan, Anderson and Barry52).
Heritability
It is well established that EEG parameters are largely determined by genetic factors. Higher twin concordance rates in the spectral characteristics of resting eyes-closed EEG have been reported for monozygotic than for dizygotic pairs (Refs Reference McGuire64, Reference Christian65, Reference Lykken, Tellegen and Iacono66). The first large twin study of resting EEG found high heritability across all frequency bands (delta 76%, theta 89%, alpha 89% and beta 86%), with heritability ranging from 55% to 90% in 5-year-old twins and from 70% to 90% in 16-year-old twins (Refs Reference Beijsterveldt, Geus and Boomsma67, Reference Van Baal, De Geus and Boomsma68). Meta-analysis estimated an average heritability of 79% for alpha power (Ref. Reference van Beijsterveldt and van Baal69). Frontal areas tend to exhibit more unique genetic influences for the individual frequency bands, compared with occipital sites where genetic influences are largely shared across frequency bands (Ref. Reference Zietsch70). This highlights the complexity of genetic influences on EEG across frequency bands and scalp locations, additionally reported using bipolar electrode derivations (Ref. Reference Tang71). The specificity of genetic influences in frontal regions suggests that different neurobiological pathways might be responsible for different frequency bands of the EEG (Ref. Reference Zietsch70). These findings may link with studies indicating band specificity in ADHD (i.e. reduced theta, increased beta) and findings of alpha asymmetry (see the section ‘EEG coherence and connectivity’).
EEG frequency bands were found to correlate between siblings in families multiply affected with ADHD. At rest siblings were more similar for the lower-frequency band (theta: 0.36–0.59) than for the higher-frequency bands (alpha: 0.42–0.49; beta1: 0.45–0.57; and beta2: 0.28–0.52), suggesting that the increased theta power observed at rest is familial (Ref. Reference Loo72). By contrast, for cognitive activation conditions [resting eyes-open and completion of the continuous performance test (CPT)] higher sibling correlations were reported for beta1 (0.45–0.61), which suggests that familial influences underlie reduced beta power and lack of typical beta increase during cognitive activation conditions. In addition, highly significant parent–offspring correlations for alpha power were reported under resting eyes-open (0.47–0.56) and CPT (0.46–0.50), similar to a previous preliminary study (Ref. Reference Loo and Smalley73).
EEG further demonstrated familial clustering with ADHD subtypes and symptoms (Ref. Reference Loo72). In children increased theta was found in ADHD regardless of subtype, whereas theta, alpha and beta in adults varied according to ADHD subtype. Parents with the predominantly inattentive subtype showed significantly elevated theta compared with parents with the combined subtype and unaffected parents, suggesting a potential link between ADHD that persists into adulthood, inattention and elevated theta. Some of the familial correlations for the EEG parameters are higher than expected for the action of genetic influences alone, suggesting the influence of the familial environment. However, the selection of affected sibling pairs may inflate the familial correlations because they may reflect, in part, state effects (i.e. both having ADHD).
Genetic association studies
A recent review of the relationship between neurotransmitters and brain oscillations highlights the role of dopamine in brain oscillatory activity (Ref. Reference Basar and Güntekin74). Theta and beta2 (16–20 Hz) have been associated with DRD4 (Ref. Reference Loo72); children with the seven-repeat allele (DRD4-7R: the risk allele associated with ADHD) had reduced beta2 power across all conditions (likely indicating reduced cortical activation) compared with children without DRD4-7R. Parents also demonstrated the same association between DRD4-7R and reduced beta2 power under resting eyes-open and CPT performance, but not under the resting eyes-closed condition (Ref. Reference Loo72), suggesting possible developmental effects.
The association between the dopamine transporter gene (SLC6A3/DAT1) and EEG patterns was investigated in a double-blind, placebo-controlled methylphenidate (MPH) study in a small sample of 27 children with ADHD (Ref. Reference Loo75). Findings indicated poor performance on the CPT [increased reaction-time variability (RTV) and error rate] in children with two copies of the ten-repeat allele (DAT1-10R: the risk allele associated with ADHD in children) compared with those with one or two copies of the nine-repeat allele (DAT1-9R). MPH treatment led to decreased theta activity and a lower theta to beta ratio in children with DAT1-10R, whereas those with DAT1-9R showed the opposite pattern. Genetic variation of SLC6A3 may therefore mediate medication-related changes to EEG patterns, and the response variability shown in the DAT1-10R group might reflect underarousal. Such medication-related changes are reported elsewhere in the literature (Refs Reference Clarke76, Reference Loo77), highlighting the potential for combining genetic and electrophysiological data when considering treatment response. Taken together, these findings suggest that variation in dopaminergic genes may mediate susceptibility to ADHD through effects on cortical activation.
Intermediate phenotype studies also provide information on potential mechanisms of gene function. In classical auditory target detection paradigms, target stimuli evoke increased gamma activity compared with standard stimuli in typical controls (Refs Reference Debener78, Reference Herrmann and Mecklinger79), and when compared with typical controls, individuals with ADHD display higher-amplitude gamma regardless of whether evoked by target or standard stimuli (Ref. Reference Yordanova60). Using the same task in typical controls, DRD4-7R was associated with an increase in gamma responses to both target and standard stimuli, whereas the DAT1-10R/10R genotype was associated with an increase in gamma response specifically to target stimuli (Ref. Reference Demiralp80). This suggests that the pattern of the evoked gamma response associated with DRD4 relates to an inhibitory mechanism, whereas the SLC6A3 effect is related to a target detection mechanism, indicating the role of dopamine in the modulation of such activity in more than one way.
Very low-frequency activity and intraindividual variability
One of the most replicated findings in ADHD research is the increased rate of variability in reaction time (RT) on speeded RT tasks (Ref. Reference Klein81). Such variability was identified as the best discriminator of ADHD compared with controls out of several variables, demonstrating substantially larger group effect sizes than those found for commission and omission errors (Ref. Reference Klein81). RTV is heritable (Ref. Reference Kuntsi33) and shares familial (Refs Reference Nigg82, Reference Andreou83, Reference Uebel84) and genetic influences with ADHD (Refs Reference Nigg82, Reference Bidwell85, Reference Kuntsi and Stevenson86) and ‘hyperactivity’ (Ref. Reference Kuntsi, Oosterlaan and Stevenson87). Furthermore, multivariate genetic modelling suggests that RTV in ADHD forms a distinct familial cognitive factor separate from commission and omission errors (Ref. Reference Kuntsi42) and the effect of IQ (Refs Reference Wood88, Reference Wood89), and may account for as much as 85% of the familial effects on ADHD (Ref. Reference Kuntsi42).
There are several theories postulated to explain increased RTV in ADHD, including inefficient executive control (Ref. Reference Bellgrove90) and temporal processing deficits (Ref. Reference Castellanos and Tannock44). A prominent hypothesis posits that RTV in ADHD is related to fluctuations in arousal/activation (Refs Reference Kuntsi, McLoughlin and Asherson45, Reference O'Connell91, Reference Sergeant92, Reference Johnson93, Reference Johnson94, Reference O'Connell95), which can also be measured using EEG. Increased theta, which is hypothesised to indicate underarousal, was linked to RTV in a family study of ADHD, which found a higher familial contribution to EEG power in a cognitive activation condition than in a resting state condition (Ref. Reference Loo and Smalley73), suggesting that the familial risk for ADHD is associated with a requirement for greater neural activation to achieve a typical level of performance.
A relatively novel approach to investigate the source of RTV in ADHD is the measurement of very low-frequency (VLF; <0.05 Hz) activity. VLF fluctuations may be associated with the brain's default-mode network [DMN, which is itself characterised by slow fluctuations in the haemodynamic signal (Ref. Reference Raichle96)], or reflect cognitive resource allocation (Ref. Reference Rösler, Heil and Röder97), modulation of gross cortical excitability (Ref. Reference Vanhatalo98) or conscious perception (Ref. Reference He and Raichle99). Infraslow EEG corresponds to regional correlations in the infraslow BOLD signal (Ref. Reference He and Raichle99) and might modulate higher-frequency activity (Ref. Reference Vanhatalo98). Further research is required to clarify the precise relationship between the DMN and VLF activity before direct comparisons can be made, but current findings suggest that VLF activity can be taken as a novel measure of arousal levels.
VLF fluctuations are ultraslow multisecond oscillations that have a duration of 20 s for a single wave, and as such might influence RTV, which peaks every 20 s in ADHD (Ref. Reference Castellanos100). In support of this, greater RTV in ADHD is reported specifically in the 0.27–0.72 Hz range by conducting a fast Fourier transform analysis on the RT spectrum (Ref. Reference Di Martino101). VLF fluctuations are postulated to intrude on active processing where higher-frequency oscillations are involved, because of failure to effectively transition from default mode to processing mode. This has become known as the default-mode interference (DMI) hypothesis (Refs Reference Sonuga-Barke and Castellanos102, Reference Fox103, Reference Giambra104) (Fig. 2).
Emergent default-mode interference following initial attenuation of task-negative introspection by goal-directed focused attention. The figure illustrates attenuation of task-negative default-mode activity associated with a shift from rest to goal-directed performance and the gradual re-emergence of activity within this network as the power within task-negative networks returns. The red line represents the hypothetical effect on the emergence of default-mode activity during goal-directed tasks on performance. Units on the y-axis are arbitrary. Figure reproduced from Ref. Reference Sonuga-Barke and Castellanos102 (© 2007 Elsevier Ltd), with permission from Elsevier.

Association with ADHD
fMRI studies show associations between the brain regions involved in the DMN and ADHD (Refs Reference Castellanos105, Reference Fassbender106, Reference Tian107, Reference Uddin108), as well as the DMN and slower RT, increased RTV and error rates (Refs Reference Eichele109, Reference Kelly110, Reference Suskauer111, Reference Weissman112). Although fMRI provides excellent spatial resolution, high temporal resolution is crucial to evaluate the relationship among fast-occurring cognitive processes, task performance and brain processing (Ref. Reference Khader113). A preliminary study measured VLF activity at rest in adults with attentional problems, and found that reduced power in the frequency range slow-3 (0.06–0.2 Hz) was associated with a higher number of inattentive symptoms and resembled oscillatory patterns implicated in the DMN (Ref. Reference Helps114). In the same sample, individuals with increased ADHD symptoms had reduced rest-task VLF attenuation (or increased DMI during the cognitive task), and there was a small but significant synchrony between VLF brain activity and fluctuations in RT (Ref. Reference Helps115). The authors further demonstrated that adolescents with ADHD also showed reduced VLF activity at rest and reduced rest-task attenuation of VLF compared with controls (Ref. Reference Helps116). Although reduced attenuation (or increased DMI) was associated with a higher number of errors and increased RTV, the small sample size limits firm conclusions at this stage. Nevertheless, such findings emphasise the potential importance of the link between attentional control and the DMN and the potential link between attenuation of the default resting state and theories highlighting altered arousal states in ADHD.
Heritability
As discussed, EEG frequency bands show moderate to high heritability and overlap with ADHD (see the ‘Heritability’ section under ‘EEG power’ above). In addition, we know that RTV is also heritable and shares familial influences with ADHD (see the ‘Very low-frequency activity and intraindividual variability’ section above). Functional connectivity of the DMN is reported to be heritable with estimates at 0.42 (Ref. Reference Glahn117). However, as yet there is no information on the heritability of VLF activity or the extent to which shared genetic influences explain the phenotypic associations among ADHD, RTV and measures of the DMN.
Genetic association studies
To date, no studies report direct genetic associations for VLF activity, although there are some promising links with the DMN; systems-level connectivity has been associated with serotonergic and dopaminergic genetic variants (5HTTLPR/SLC6A4, MAOA, DARPP-32/PPP1R1B) (Ref. Reference Meyer-Lindenberg118), and healthy subjects homozygous for the functional COMT (catechol-O-methyl-transferase) Val allele show reduced DMN connectivities at prefrontal regions (Ref. Reference Liu119). This is a fruitful area for future research.
EEG coherence and connectivity
EEG coherence is calculated as the cross-correlation in the frequency domain between two EEG time points, measured simultaneously at different scalp locations. EEG coherence is regarded as an index of both structural and functional brain characteristics and a description of how different parts of the brain relate during task performance (Ref. Reference French and Beaumont120). EEG coherence is also referred to as ‘asymmetry’, which indicates the relative ratio of power between two electrode points. Test–retest reliability for coherence measures suggests that only 60% of the variance can be explained by stable individual differences (Ref. Reference Hagemann121).
Association with ADHD
EEG studies indicate that both intra- and interhemispheric coherence are elevated in ADHD, predominantly in the frontal areas of the brain (Refs Reference Barry122, Reference Chabot123, Reference Murias124) and relating to slow-wave (delta and theta) activity in particular (Refs Reference Barry122, Reference Tcheslavski and Beex125), thought to indicate reduced cortical differentiation (Ref. Reference Thatcher, Krause and Hrybyk126). However, reduced interhemispheric coherence (Ref. Reference Montagu127) and intra- and interhemispheric asymmetry (Ref. Reference Chabot and Serfontein53) have also been reported. In addition, increased rightward alpha asymmetry has been demonstrated in children (Refs Reference Chabot and Serfontein53, Reference Baving, Laucht and Schmidt128) and adults (Ref. Reference Hale129) with ADHD compared with typical controls, suggesting that the ratio of alpha power is greater in the right than in the left hemisphere.
Heritability
EEG coherence is reported to be moderately heritable, with estimates between 50% and 70% across typical children, adolescents and adults in twin populations (Refs Reference Stassen130, Reference Van Beijsterveldt and Boomsma131, Reference Van Beijsterveldt132, Reference van Baal, de Geus and Boomsma133). There are differences between frequency bands in the genetic influences on interhemispheric coherence, with estimates between 40% and 60% for coherences in theta and alpha bands in a large sibling sample (Ref. Reference Chorlian134). One other study (Ref. Reference Anokhin, Heath and Myers135) reported more modest or zero genetic effects on alpha asymmetry at frontal–central and frontal–lateral electrodes, despite high heritability of alpha power at all frontal sites.
More recently, EEG-indexed functional brain connectivity derived from graph theory has been applied in order to investigate the capacity of the brain for dynamic interaction, rather than activity in a single brain region. Heritability has been reported for measures of synchronisation likelihood (40–82%), and global (29–63%) and local (25–49%) alpha connectivity (Refs Reference Posthuma136, Reference Smit137, Reference Smit138), which show high phenotypic and genetic stability from adolescence to early adulthood (Ref. Reference Smit137). This highlights a potential future research direction in ADHD.
A study of alpha asymmetry in multiply affected families (Ref. Reference Hale139) reported a pattern of increased rightward alpha asymmetry across frontal and central electrode sites in the offspring of parents with ADHD compared with offspring of parents without ADHD. In the same study, increased rightward alpha asymmetry in parietal regions was associated with a lower familial risk for ADHD. This trait was also found to increase with age only in the offspring of parents who had a childhood diagnosis but were now in remission as compared with the offspring of parents with current (persistent) ADHD. This may suggest a possible adaptive or compensatory mechanism that has a specific familial association with remitting forms of ADHD.
Genetic association studies
Few genetic studies of EEG coherence have been reported. In a sample of 313 undergraduates aged 18–33 years, participants homozygous for the G allele of a serotonin IA receptor (HTR1A) single-nucleotide polymorphism (SNP) had significantly greater relative right frontal activity at frontal electrode sites compared with participants with the C allele (Ref. Reference Bismark140). Previous research associated ADHD with the C/C genotype in 78 ADHD patients and 107 controls (Ref. Reference Shim141). One study reported significant linkage on chromosome 7 for high theta interhemispheric coherence at centroparietal scalp locations (Ref. Reference Porjesz and Rangaswamy142). A recent study reported dose-dependent modulation of EEG connectivity by the COMT gene, whereby carriers of the Val/Val genotype exhibited greater connectivity, followed by Val/Met and Met/Met carriers (Ref. Reference Lee143).
Event-related potentials
Event-related potentials (ERPs) are small voltage fluctuations in the EEG that are evoked from task manipulations and time locked to the onset of certain cognitive, sensory or affective stimuli. ERPs are obtained by averaging the ERP response across multiple trials, to average out background EEG signals and extract specific stimulus-locked ERP patterns. ERPs measure covert processing of external stimuli and isolate several performance-related measures that cannot be separated on the basis of performance data alone, by using the millisecond resolution of EEG (Ref. Reference McLoughlin46).
Cognitive-electrophysiological research in ADHD has largely focused on the analysis of response inhibition and performance monitoring, indexed by ERP components reflecting cognitive performance measures that are impaired in people with ADHD. To date, other aspects of cognitive performance in ADHD, such as choice impulsivity and delay aversion (Refs Reference Sonuga-Barke145, Reference Marco146, Reference Paloyelis, Asherson and Kuntsi147), have not been explicitly tested in ERP studies and are not reviewed here.
Inhibitory and attentional processing
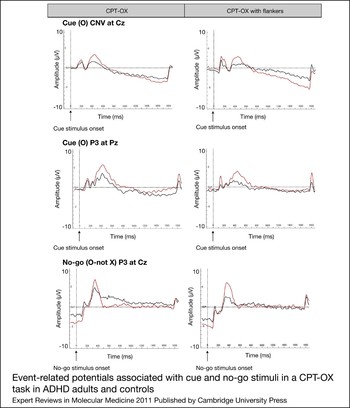
A task that is often used to assess different executive processes is the cued go/no-go task or the cued CPT (CPT-OX; also referred to as CPT-AX). The CPT-OX, when used in an ERP paradigm, measures attention and inhibition and additionally attentional orienting to a cue and motor response preparation that do not require an overt response (Fig. 3). ERPs associated with these processes are the go-P3 (enhanced positivity in parietal regions in response to the target) and the no-go-N2 [enhanced negativity at frontocentral locations in response to no-go stimuli and thought to reflect conflict monitoring (Ref. Reference Nieuwenhuis148)], followed by the no-go-P3 [enhanced positivity at frontocentral locations in response to no-go stimuli and thought to reflect response inhibition (Ref. Reference Donkers and van Boxtel149)]. An additional related parameter is no-go-anteriorisation (NGA), a measure of the topographical changes in P3 activity from go to no-go trials that are thought to reflect prefrontal response control mechanisms (Ref. Reference Fallgatter, Brandeis and Strik150). In addition, in response to the cue stimulus, the frontocentral cue-P2 and centroparietal cue-P3 are thought to reflect attentional orienting, and the contingent negative variation (CNV) is thought to reflect motor response preparation (Ref. Reference van Leeuwen151). The go-P3 and no-go-P3 demonstrate high reliability, with intraclass correlations for peak amplitudes of 0.85 and 0.92, respectively, over a period of 30 min (Ref. Reference Fallgatter152). Long-term reliability of topography over an average of 2.7 years found an intraclass correlation of 0.9 (Ref. Reference Fallgatter153).
Event-related potentials associated with cue and no-go stimuli in a CPT-OX task in ADHD adults and controls. In the cued continuous performance test (CPT-OX), participants are instructed to respond to cue-target sequences (i.e. O followed by X). In the Flanker version, letters are flanked by distractor letters on either side. The figure shows CNV and stimulus-locked centroparietal cue-P3 (in response to the cue stimulus) and no-go-P3 (enhanced positivity at frontocentral locations in response to no-go stimuli) averages for controls (red) and ADHD participants (black). In ADHD, a reduced CNV indicated abnormal anticipation and preparation, and reduced cue-P3 amplitudes indicated reduced attentional orienting, to cue stimuli. Attenuation of the no-go-P3 indicated the presence of abnormal inhibitory processing in adult ADHD. Figure reproduced from Ref. Reference McLoughlin144. Abbreviations: ADHD, attention deficit hyperactivity disorder; CNV, contingent negative variation.

Association with ADHD
Numerous studies indicate that children and adults with ADHD show poorer performance (Ref. Reference Willcutt154) and altered electrophysiological correlates (Refs Reference Kuntsi, McLoughlin and Asherson45, Reference Valko155, Reference Szuromi156) on tasks that require attention and inhibitory control. Impaired target processing to rare targets (oddballs) as indexed by the go-P3 is reduced in children and adults with ADHD (Refs Reference Szuromi156, Reference Banaschewski157, Reference Verbaten158), although this may reflect missed targets or differences in preparatory processing (Ref. Reference van Leeuwen151) or possibly the presence of comorbid conditions (Ref. Reference Banaschewski157). Individuals with ADHD demonstrate attenuation of the no-go-P3 amplitude, suggesting problems of inhibition in children (Ref. Reference Brandeis159) and adults with ADHD [Fig. 3 (Ref. Reference McLoughlin144)]; and reduced cue-P3 and CNV activity, indicating reduced response preparation in children (Refs Reference van Leeuwen151, Reference Banaschewski157, Reference Banaschewski160) and adults with ADHD [Fig. 3 (Ref. Reference McLoughlin144)]. In addition, individuals with ADHD exhibit a reduced NGA (Ref. Reference Fallgatter161). Diminished N2 amplitudes are also found in ADHD, although these are mainly related to comorbidities (Ref. Reference Wiersema162) or demonstrated in more demanding tasks, such as the stop-signal task (Ref. Reference Albrecht163).
Heritability
Meta-analysis of child and adolescent data confirms an average heritability of around 60% for P3 amplitude and 51% for P3 latency (Ref. Reference van Beijsterveldt and van Baal69), although in paradigms that may elicit functionally distinct components (e.g. Ref. Reference Dien, Spencer and Donchin164). More recently, comparable heritabilities using a go/no-go task were found in an adult twin sample of 60% in the no-go-N2 component and of 41% and 58% for the go-P3 and no-go-P3 components (Ref. Reference Anokhin, Heath and Myers165). One study reports significant monozygotic twin correlations at frontal regions (0.67) but nonsignificant correlations at centroparietal regions for visual P3 amplitude (Ref. Reference Bestelmeyer166). The extent of genetic influences appears to be stable throughout development, with similar heritabilities reported in children, young adults and middle-aged adults (Ref. Reference Smit167). However, longitudinal studies are required to test whether this reflects the same genetic factors throughout development, or whether different sets of genes have a role at different developmental stages. One longitudinal study reported that the rate of change in P3 amplitude measured at 17, 20 and 23 years of age was genetically influenced (Ref. Reference Carlson and Iacono168). Slow-cortical potentials such as the CNV demonstrate heritability between 30% and 43% (Ref. Reference Smit169). These ERP components therefore appear to index genetically influenced neural processes that are important for cognitive control.
There are only a few studies evaluating the familial association between these variables and ADHD. In one small study, similar P3 activity to increased conflict (P3a) was demonstrated when comparing siblings of ADHD probands and typical controls despite a significantly attenuated P3 in the ADHD probands, suggesting that in this study altered P3 showed no familial association with ADHD (Ref. Reference Wild-Wall170). However, other preliminary findings report impaired inhibitory control as indexed by the no-go-P3 in parents of ADHD probands, indicating a familial association with adult ADHD (Ref. Reference McLoughlin171). In addition, attenuated cue-P3 and CNV activity has been reported in nonaffected siblings of ADHD probands compared with controls (Ref. Reference Brandeis172) and attenuated cue-P3 in parents of ADHD probands compared with controls (Ref. Reference McLoughlin171), suggesting that impaired attentional orienting and preparatory states might index familial risk for ADHD. A further twin study demonstrated modest phenotypic and genetic overlap between the go-P3 in a visual oddball paradigm and externalising conditions associated with ADHD, including substance abuse disorders, conduct disorder and antisocial behaviour (Ref. Reference Gilmore, Malone and Iacono173). This association is likely to be driven by genetic factors alone, with an estimated genetic correlation of −0.22 (Ref. Reference Hicks174). Further studies, particularly those incorporating twin designs in ADHD samples, are required to fully determine the familial and genetic associations of these variables with ADHD.
Genetic association studies
Go-P3 activity in adults has been linked to regions on chromosomes 2, 5, 6 and 17 (Ref. Reference Begleiter175) and chromosome 7q (Ref. Reference Wright176) in genome-wide linkage scans, suggesting that genes of moderate to large effect might affect this variable. P3 activity has also been associated with specific genes involved in dopamine transmission. The A1 allele of the Taq1A polymorphism in the dopamine D2 receptor gene (DRD2) was associated with a reduction in P3 amplitude to rare targets in visual and auditory oddball tasks (Ref. Reference Hill177) and a longer parietal go-P3 latency in a visual CPT task (Ref. Reference Noble178) in individuals ‘at risk’ for alcoholism, although negative findings were also reported in a sample of 134 young female controls (Ref. Reference Lin179). Similarly, an association between the DRD4-7R allele and reduced P3 amplitude to rare targets in an auditory oddball task was demonstrated in young boys (Ref. Reference Vogel180) but was not reported in young females (Ref. Reference Tsai181), suggesting a gender effect. Healthy individuals with the Val/Val genotype for the COMT gene showed increased go-P3 amplitude and shorter go-P3 latency compared with those bearing the Val/Met genotype in a visual working memory task (Ref. Reference Yue182). An enhanced no-go-P3 was reported in Val/Val homozygotes compared with those bearing the Met/Met genotype during a flanker task in a sample of 656 healthy students (Ref. Reference Kramer183), but was not reported in a sample of 187 consisting of individuals with schizophrenia, their relatives and healthy controls (Ref. Reference Bramon184). A reduced NGA has been associated with DAT1-9R in adults with ADHD (Ref. Reference Dresler185; also see Ref. Reference Franke186 for a discussion on DAT1-9R as a risk allele for adult ADHD) and with putative ADHD risk alleles on the TPH2 (tryptophan hydroxylase 2) gene in a sample of both controls and ADHD adults (Ref. Reference Baehne187). Finally, in a study of event-related oscillations during a go/no-go task, DRD4–7R carriers showed increased no-go-related theta and reduced go-related beta (Ref. Reference Kramer188). These findings potentially suggest that genetic variation of dopamine and serotonin genes might be involved with altered regulation of the P3 response in ADHD, perhaps through prefrontal function.
Performance monitoring
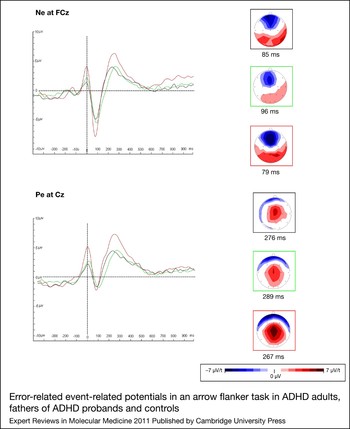
Performance monitoring comprises error detection and conflict monitoring, which are essential prerequisites for adaptively altering behaviour and decision making. Error processing is generally accompanied by a negative component (error negativity; Ne) peaking approximately 40–120 ms after the erroneous response at frontocentral sites (Ref. Reference Gehring189), thought to index mismatch between an intended and actual response (Ref. Reference Gehring189) or response conflict (Ref. Reference Carter190). Ne is frequently followed by a more parietal positive deflection (error positivity; Pe) within 200–500 ms after the response (Ref. Reference Falkenstein191), thought to index conscious processing of errors as it is elicited after errors of which the subject is aware (Ref. Reference Nieuwenhuis192). Additionally, the no-go-N2 component is implicated in conflict monitoring through resisting the interference caused by distracters in the flanker task (see below) and may have at least partial overlap with the neural generators of Ne, with a correlation of 0.6 reported between these components (Ref. Reference McLoughlin48). The no-go-N2 may therefore represent a general index of conflict monitoring independent of response inhibition (Refs Reference McLoughlin48, Reference Nieuwenhuis148, Reference Donkers and van Boxtel149). High split-half and test–retest reliability has been demonstrated across 2 weeks for both Ne (intraclass correlations 0.70–0.83 for peak amplitude) and Pe (intraclass correlations 0.71–0.84 for area measures) (Ref. Reference Olvet and Hajcak193).
Association with ADHD
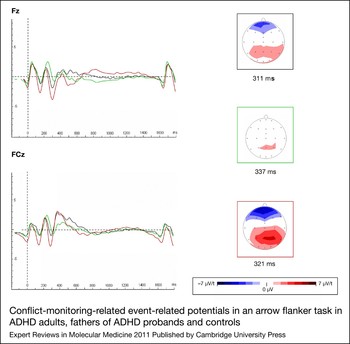
Performance monitoring deficits in response to task demands and post-error slowing have been demonstrated in ADHD (Ref. Reference Kuntsi, McLoughlin and Asherson45). The Eriksen arrow flanker task (Ref. Reference Falkenstein191), which requires a high level of conflict monitoring, elicits a diminished N2 amplitude (Ref. Reference Albrecht47), reduced early error detection indexed by the Ne (Refs Reference Albrecht47, Reference van Meel194, Reference Liotti195), and diminished late error detection indexed by the Pe in children with ADHD (Refs Reference Jonkman196, Reference Wiersema, van der Meere and Roeyers197). Similar findings are reported using the stop-signal task (Ref. Reference Liotti195) and using the go/no-go task and the S1–S2 task (Ref. Reference Wiersema, van der Meere and Roeyers197). Altered topography and reduction in N2 and Ne components are found in adults with ADHD [Figs 4 and 5 (Ref. Reference McLoughlin48)]. However, the reported findings are not always consistent, and further work is needed to understand the sources of variation across different studies (reviewed in Ref. Reference Shiels and Hawk198) such as sample size, clinical subtypes, comorbidity, task conditions such as duration and provision of feedback, and methods of analysis (Ref. Reference Shiels and Hawk198).
Error-related event-related potentials in an arrow flanker task in ADHD adults, fathers of ADHD probands and controls. Response-locked error negativity (Ne, top) at FCz (midline frontocentral) and error positivity (Pe, bottom) at Cz (midline central) are shown at latencies of maximal amplitude for control participants (red border), parents of ADHD probands (green border) and ADHD participants (black border). Ne but not Pe was attenuated in the ADHD group and fathers compared with controls, which indicates abnormal initial error detection processes that share familial effects in adult ADHD, suggesting an informative intermediate phenotype. Figure reproduced from Ref. Reference McLoughlin48 (© 2009 Elsevier Ltd), with permission from Elsevier. Abbreviations: ADHD, attention deficit hyperactivity disorder.

Conflict-monitoring-related event-related potentials in an arrow flanker task in ADHD adults, fathers of ADHD probands and controls. The figure shows stimulus-locked N2 averages at Fz (midline frontal) and FCz (midline frontocentral) electrodes to incongruent correct responses of control (red), ADHD participants (black) and parents (green). Scalp maps show topography at the mean latency of the N2 peak for each group. An N2 enhancement for incongruent stimuli was highest in the control group with attenuated amplitude in the ADHD group and the fathers, suggesting that reduced conflict monitoring is a genetically influenced intermediate phenotype. Figure reproduced from Ref. Reference McLoughlin48 (© 2009 Elsevier Ltd), with permission from Elsevier. Abbreviations: ADHD, attention deficit hyperactivity disorder.

Heritability
Genetic influences on both Ne and Pe were demonstrated in a small twin sample of young adults (Ref. Reference Anokhin, Heath and Myers165). A larger study (Ref. Reference Anokhin, Golosheykin and Heath199), using the flanker task in young adolescent males, found heritabilities of 47% and 52%, respectively, for Ne and Pe. Familial influences shared between ADHD and the Ne and N2 components were also found in a large study of ADHD probands and their siblings (Refs Reference Albrecht47, Reference Albrecht200), with unaffected controls showing significantly greater N2 enhancement and greater Ne and Pe enhancement in response to errors compared with unaffected siblings of ADHD probands; however, one small study did not support this finding (Ref. Reference Wild-Wall170). Moreover, fathers of ADHD probands demonstrate significantly attenuated Ne and N2 components compared with typical adults, suggesting that the familial effects are found throughout development (Ref. Reference McLoughlin48) (Figs 4 and 5).
Genetic association studies
The neurobiological role of the anterior cingulate cortex (ACC) has been the focus of considerable attention in relation to performance monitoring. A common interpretation is that ACC activity reflects conflict or outcome monitoring, because studies demonstrate increased ACC activation in tasks that require more cognitive effort (reviewed in Ref. Reference Botvinick, Cohen and Carter201), and studies indicate that the Ne and N2 components share sources in ACC (Refs Reference Carter190, Reference Gehring and Knight202). In addition, fMRI studies implicate ACC in ADHD (Refs Reference Bush203, Reference Paloyelis204) and ACC hypoactivation has been associated with DAT1-10R in ADHD (Ref. Reference Brown205). This is of interest because ACC is one of the richest dopaminergic innervated brain regions (Ref. Reference Seamans and Yang206), and suggests that Ne might be generated as part of a dopamine-dependent reinforcement learning process (Ref. Reference Holroyd and Coles207). In line with this, genetic variants involved in dopamine transmission have been associated with cognitive performance measures and the various ERP variables of performance monitoring tasks. In a sample of 39 healthy individuals, those homozygous for the COMT Met allele had increased Pe amplitude (Ref. Reference Frank208). In a sample of 656 students, the DRD4-521C/T polymorphism [significantly associated with ADHD in meta-analysis (Ref. Reference Gizer, Ficks and Waldman19)] was associated with increased Ne following errors and failed inhibitions (Ref. Reference Kramer183; reviewed in Ref. Reference Ullsperger209). In addition, in a small sample of children with ADHD, autism spectrum disorders and typical controls, significant correlations were found between ADHD symptoms and attenuated Pe, and DAT1-9R carriers were found to display a greater Pe response (Ref. Reference Althaus210). MPH treatment has also been found to normalise Pe in ADHD, strengthening the potential dopaminergic link (Ref. Reference Jonkman196). Serotonin genes have also been implicated. In one study of SLC6A4 in 39 healthy individuals, carriers of the promoter S allele, which is associated with increased extracellular serotonin levels, had a larger Ne than homozygous L allele carriers (Ref. Reference Fallgatter211). Such findings warrant further investigation of the association between neural mechanisms of performance monitoring and specific genetic variants in larger samples.
Clinical implications
This review has alluded throughout to developmental outcomes, but these have yet to be systematically studied. Several studies suggest developmental stability for some of the EEG/ERP parameters, with comparable electrophysiological findings in children, adolescents and adults with ADHD (e.g. related to performance monitoring; Refs Reference Albrecht47, Reference McLoughlin48). Many of the parameters demonstrate similar heritabilities throughout the lifespan, although this could reflect different genes at different developmental stages. The finding in ADHD that some cognitive-electrophysiological impairments are seen at different ages is important for our understanding of the development course of the disorder. One hypothesis put forward in recent years is that ADHD is associated with enduring subcortical dysfunction, but recovery through development is through improvements in executive (cortical) control (Ref. Reference Halperin212). This and other dual-process models that emphasise both bottom-up and top-down dysfunctions (Ref. Reference Johnson, Wiersema and Kuntsi213) can be meaningfully studied using EEG, for example by examining the interplay between EEG-indexed arousal and ERP-indexed attentional fluctuations. Future intermediate phenotype studies can systematically study stability and change to aetiological influences throughout development using longitudinal family and twin designs, and by comparing adults with remitted and persistent ADHD as a way of identifying the brain processes associated with persistence and recovery. Such studies would provide insight into the processes related to the clinical state of ADHD and those that index genetic risk for ADHD independent of clinical status.
EEG in particular has been proposed as a useful tool for the clinical assessment of ADHD (Ref. Reference Loo and Barkley214). In order to be a diagnostic tool, however, it must demonstrate both high sensitivity and specificity. Sensitivity has been reported at 90–97% and specificity at 84–94% in ADHD for combined measures of EEG power and coherence (Ref. Reference Chabot215) and a combined mean theta to beta power ratio across four tasks at a single electrode (Refs Reference Monastra, Lubar and Linden216, Reference Monastra217). However, because this has not been found in all studies it remains uncertain whether this is sufficiently robust for use in clinical practice.
Potential problems may be the common association of ADHD with comorbidities, with as many as 65% of children with ADHD having one or more co-occurring conditions (Ref. Reference Dalsgaard218). Furthermore, there is aetiological, cognitive and neurobiological overlap between ADHD and several other psychiatric disorders (Ref. Reference Rommelse219). For example, the DMN has also been linked to schizophrenia and autism (Ref. Reference Broyd220), and increased RTV and cognitive performance measures reflecting executive processes are implicated in several other disorders (e.g. Refs Reference Geurts221, Reference Sergeant, Geurts and Oosterlaan222). This suggests that although these parameters are sensitive to ADHD they are not necessarily specific to ADHD, and may represent general markers of pathophysiology or overlapping neurophysiological processes.
Nevertheless, it might be possible to find specificity in some cases. ERP paradigms may differentiate children with ADHD with and without conduct and tic disorders (Refs Reference Banaschewski157, Reference Banaschewski160, Reference Rothenberger223, Reference Yordanova224), as well as children with ADHD compared with children with reading disability for inhibitory ERPs (Ref. Reference Liotti225) and children with autism for performance monitoring ERPs (Ref. Reference Groen226). In addition, EEG power may differentiate ADHD children with high and low autism symptoms (Ref. Reference Clarke227). The effect of comorbidities on the association between ADHD and candidate intermediate phenotypes is a key area for future investigation.
Cognitive-electrophysiological phenotypes may also be sensitive markers of neuropathological or aetiological subtypes and have the potential to delineate processes that can be targeted for the development of specific treatments for subtypes of ADHD. Future studies are required to show whether ERP variables combined with genetic marker data can be used to predict individual patient treatment response and outcomes. Such measures could potentially be utilised in ‘at-risk’ individuals, such as the close relatives of ADHD probands, in order to initiate interventions at an earlier stage.
One successful clinical application using EEG/ERP is through neurofeedback (NF). NF uses operant conditioning to train patients to enhance poorly regulated EEG and ERP patterns. Information on the individual's brainwave activity is fed into a computer that converts the information into visual or auditory signals in real time. Improvement is positively rewarded so that individuals learn to control their brainwave patterns. Individualised game-like set-ups are especially useful for training children, but may also be highly effective in adults.
Several studies document the efficacy of NF for ADHD (see Ref. Reference Loo and Barkley214 for a review of earlier studies). Psychophysiologists have used findings from electrophysiological studies of ADHD to select the most worthwhile treatment approaches. For example, based on the finding of the increased theta to beta ratio in ADHD, one study used a task in which a bar on the left side of the screen (representing theta activity) had to be reduced and a bar on the right side (representing beta activity) had to be increased (Ref. Reference Gevensleben228). The authors reported a decrease in theta activity at post-assessment (1 week following the second treatment block of 3–4 weeks) that was associated with improvements in ADHD symptom scores with an effect size of 0.6. Notably, this effect was specific to the NF group compared with a control group that completed attentional skills training that was designed to parallel the NF treatment in terms of training setting, demands upon participants, therapeutic support, and expectation and satisfaction with the treatment. Moreover, baseline EEG collected pre-assessment was useful in predicting the overall success of NF. A recent meta-analysis (Ref. Reference Arns229) concluded that NF treatment for ADHD is ‘efficacious and specific’, shown through improvements in inattention and impulsivity, and to a lesser extent hyperactivity. Furthermore, these improvements appear to be maintained 2 years after the initial treatment (Ref. Reference Gani230).
Conclusion
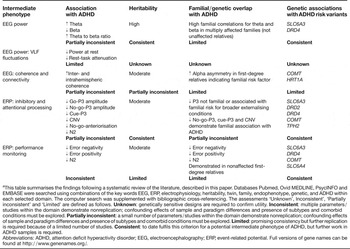
We have shown that EEG and ERP measures related to arousal and attentional processes are potential intermediate phenotypes for ADHD. Each of these domains demonstrates association with ADHD, moderate to high heritability, altered processing in nonaffected first-degree relatives similar to that seen in ADHD, and preliminary reports of association to genetic variants, particularly those involving dopamine regulation (summarised in Table 1). Nevertheless, these candidate intermediate phenotypes do not yet meet all criteria; few studies have examined familial and genetic overlap with ADHD, no cognitive-electrophysiological measures have been shown to mediate genetic effects on ADHD, and genetic associations reported to date remain unconfirmed.
Overview of the utility of selected candidate electrophysiological intermediate phenotypes in ADHDFootnote a

a This table summarises the findings following a systematic review of the literature, described in this paper. Databases Pubmed, Ovid MEDLINE, PsycINFO and EMBASE were searched using combinations of the key words EEG, ERP, electrophysiology, heritability, twin, family, endophenotype, genetic, and ADHD within each selected domain. The computer search was supplemented with bibliographic cross-referencing. The assessments ‘Unknown’, Inconsistent', ‘Partially inconsistent’ and ‘Limited’ are defined as follows. Unknown: genetically sensitive designs are required to confirm utility. Inconsistent: multiple parameters/studies within the domain demonstrate nonreplication; confounding effects of sample and paradigm differences and presence of subtypes and comorbid conditions must be explored. Partially inconsistent: a small number of parameters/studies within the domain demonstrate nonreplication; confounding effects of sample and paradigm differences and presence of subtypes and comorbid conditions must be explored. Limited: promising consistency but further replication is required because of a limited number of studies. Consistent: to date fulfils this criterion for a potential intermediate phenotype of ADHD, but further work in ADHD samples is required.
Abbreviations: ADHD, attention deficit hyperactivity disorder; EEG, electroencephalography; ERP, event-related potential. Full versions of gene names can be found at http://www.genenames.org/.
This review has outlined the potential role of catecholaminergic dysfunctions underlying altered electrophysiological responses in ADHD, in particular highlighting the potential role of dopamine in several domains. Reduced dopaminergic neurotransmission has been linked to underarousal indexed by quantitative EEG, and executive dysfunction indexed by ERPs, as well as indirectly through association with dopaminergic-rich brain regions. However, the mechanisms involved require further research.
To be successful, intermediate phenotype research must control for confounding variables such as gender, age, treatment effects, specificity of the measure and comorbid psychopathology that may affect the relationship between phenotype and intermediate phenotype (Ref. Reference Rommelse219). Furthermore, the evaluation of psychometric properties of reliability (through test–retest paradigms) and construct validity (such as confirmatory factor analysis) is important to ensure consistency and robustness across multicentre sites. Taking these steps may alleviate the inconsistencies and variable associations between electrophysiological markers and ADHD.
Not only are phenotypic and more so genetic associations with ADHD somewhat variable, if measured in a poorly designed paradigm, ERPs may reflect the superposition of activity in many different overlapping components that themselves reflect different aspects of cognitive processing other than the parameter in question. If this is the case ERPs might not be ideal electrophysiological markers of genetic risk for ADHD owing to their potential heterogeneity. One step towards improving the value of ERP findings is using well-validated tasks, such as the CPT-OX and Eriksen flanker task. In addition, novel spatiotemporal localisation methods of mapping event-related components, such as principal components analysis (Ref. Reference Jurgen and Craig231), independent components analysis (Ref. Reference Makeig232) and microstate analysis (Ref. Reference van Leeuwen151), are expected to unravel problems of source localisation and reduce heterogeneity of the measures applied.
A general issue for the intermediate phenotype concept is that the genetic and environmental influences on electrophysiological measures may be as complex as those on behavioural phenotypes, and as such it remains uncertain whether they reflect simpler phenotypes that better target aetiological influences (Ref. Reference Flint and Munafo233). Causal tests of mediation will also be necessary to identify electrophysiological markers that mediate aetiological effects on ADHD (Ref. Reference Walters and Owen34). For example, shared genetic effects between ADHD and electrophysiological markers may reflect pleiotropy (or epiphenomena) rather than causal processes on ADHD (Ref. Reference Kovas and Plomin234). Furthermore, familial effects identified in most family study designs cannot distinguish between genetic or environmental effects, although, as for ADHD, there is limited evidence of familial environmental effects on most of the cognitive-electrophysiological measures. However, the use of multivariate twin model fitting alongside longitudinal designs and molecular genetic studies would enable better dissection of the genetic and environmental factors involved and causal hypotheses to be tested (Ref. Reference Kendler and Neale39).
In conclusion, EEG/ERP is inexpensive and generates reliable and heritable data, making it possible to study brain–behaviour relations with the large sample sizes needed for both quantitative and molecular genetics research; furthermore, it addresses parameters that are of particular importance in understanding the nature of the cognitive performance deficits in ADHD. Several biological, cognitive and behavioural measures can be incorporated into multivariate approaches to provide a detailed dissection of the aetiological influences involved.
Acknowledgements and funding
Charlotte Tye is supported by a UK Medical Research Council (MRC) studentship. Gráinne McLoughlin's work is supported by The Waterloo Foundation and the Steel Charitable Trust. Jonna Kuntsi is funded by an Action Medical Research Project Grant for her EEG work on ADHD. Philip Asherson is funded by NIHR for electrophysiological studies of adults with ADHD and by the Biomedical Research Centre (BRC) for electrophysiological studies of ADHD. We thank the peer reviewers for their helpful comments on an earlier version of the manuscript.