Although exploration of kaolin deposits has been studied thoroughly over recent decades, important deposits of kaolin clays in Cameroon have been prospected only recently (Njoya et al., Reference Njoya, Nkoumbou, Grosbois, Njopwouo, Njoya, Courtin-Nomade, Yvon and Martin2006; Murray, Reference Murray2007; Kamseu et al., Reference Kamseu, Leonelli, Boccaccini, Veronesi, Miselli, Giancarlo and Chinje2007; Nkalih et al., Reference Nkalih, Njoya, Yongue, Mache, Nzeukou, Siniapkine, Flament, Melo Chinje, Ngono and Fagel2015; Dill, Reference Dill2016; Pruett, Reference Pruett2016). Kaolin is one of the most important industrial clays used as a raw material in high-tech ceramics, paper, paints, pottery, pharmaceutical industry, etc. (Christidis, Reference Christidis2011). The main market for kaolin materials (75%) is the ceramic industry, followed by the paper and paint industries. For each clay deposit, the particle shape, size and morphology combined with the physical and chemical characteristics are important in determining their market value (Wilson, Reference Wilson2004; Dill, Reference Dill2016; Pruett, Reference Pruett2016).
Kaolin is a fine-grained, creamy to dark brown clay, coloured by iron oxides/oxyhydroxides and rutile/anatase. Its major constituent is kaolinite (AlO3.2SiO2.2H2O), a 1:1 clay mineral. Common impurities include parent rock minerals like feldspar and mica, quartz, ferruginous, titanoferrous and calcareous materials. Others include illite, montmorillonite, ilmenite, anatase, hematite, bauxite, zircon, kyanite, silimanite, graphite, attapulgite and halloysite. The abundance of kaolinite, its physicochemical properties (adhesion, dispersion and adsorption) and its capacity to resist high temperatures makes kaolin the most consumed material of this type in the world (Caillère et al., Reference Caillère, Henin and Rautureau1982; Bundy, Reference Bundy1993; Murray, Reference Murray2007; Dondi et al., Reference Dondi, Mariarosa and Chiara2014; Dill, Reference Dill2016; Pruett, Reference Pruett2016). Therefore, prospecting for kaolin deposits and the determination of their properties are strategically important, especially for developing countries (Kamseu et al., Reference Kamseu, Leonelli, Boccaccini, Veronesi, Miselli, Giancarlo and Chinje2007; Nkoumbou et al., Reference Nkoumbou, Njoya, Njoya, Grosbois, Njopwouo, Yvon and Martin2009). With the aim of improving and fostering studies on kaolin raw materials from Mankon, northwest Cameroon, this paper examines their mineralogical, physicochemical and ceramic parameters and assesses their potential applications. In the Mankon area, kaolin crops out in many neighbourhoods along road trenches. Very few studies have been carried out to study the properties of clays from Mankon and their potential uses, although the clays are used by local ceramic manufacturers for the production of red fired bricks. A previous study highlighted the suitability of clay samples from Ntamuka area, Mankon district, for the production of soft porcelain and high-quality whitewares (Kamseu et al., Reference Kamseu, Leonelli, Boccaccini, Veronesi, Miselli, Giancarlo and Chinje2007). The present study aims to locate kaolinite-rich deposits that could be further exploited as kaolin raw materials.
GEOLOGICAL SETTING
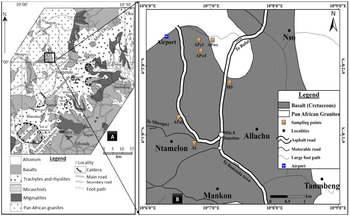
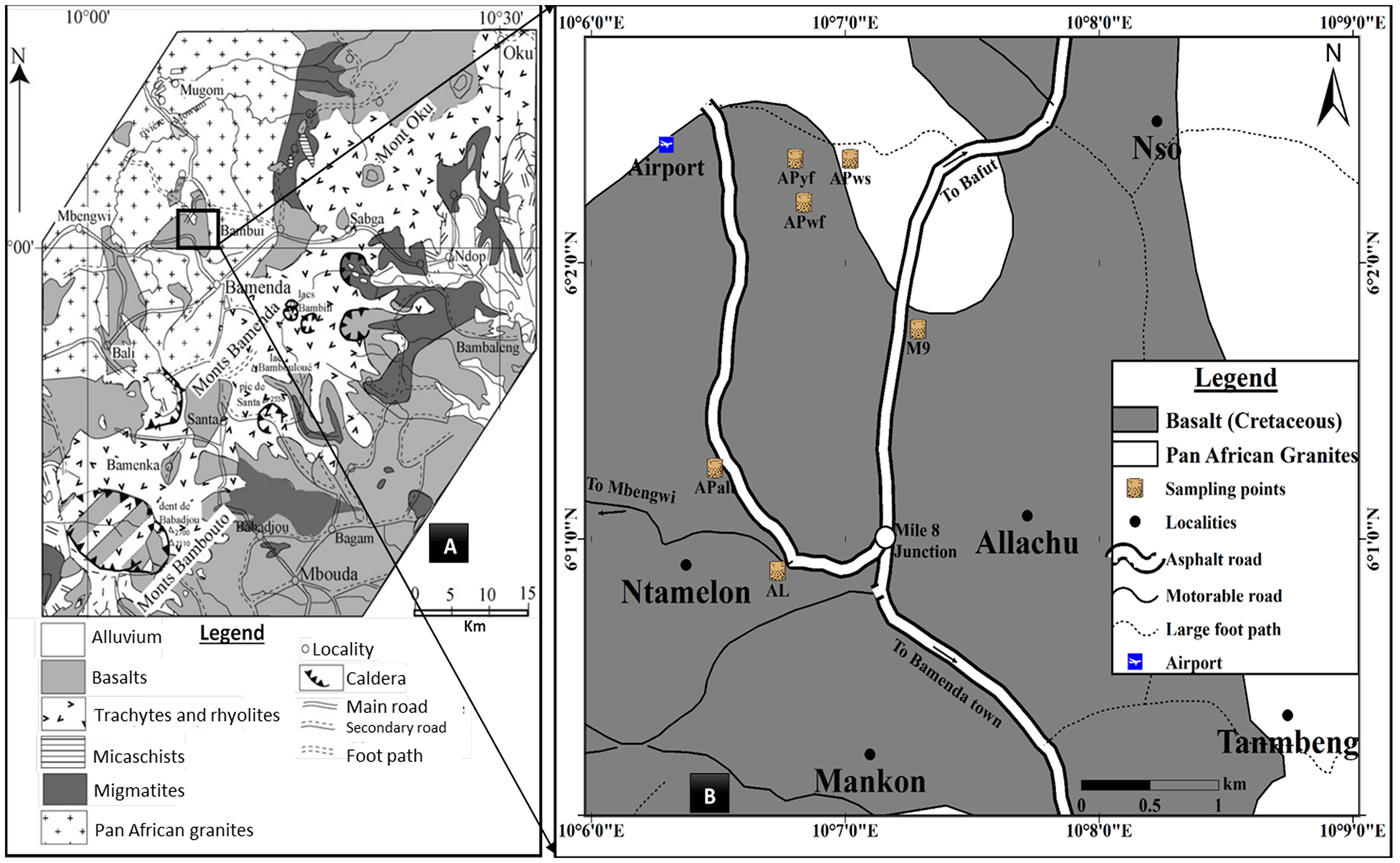
The northwest region of Mankon lies on the central part of the Cameroon Volcanic Line (CVL), between Bamboutos Mountain to the south and the Adamawa plateau to the northeast. A high relief, cool temperature, heavy rainfall and savannah vegetation characterize this area. The geomorphological features range from mountain terraces, vertically rising volcanic plugs with steep slopes, straight and rectilinear crests of multiple forms, broad-bottomed valleys, straights and elongated and round hills (Hawkins & Brunt, Reference Hawkins and Brunt1965; Afungang, Reference Afungang2015). The basement consists of Precambrian, Cretaceous and Tertiary rocks that have been affected to varying degrees by tectonics and partly covered by Quaternary sediments (Kamgang et al., Reference Kamgang, Chazot, Njonfang and Tchoua2008, Reference Kamgang, Chazot, Njonfang, Tchuimegnie and Tchoua2013; Nzenti et al., Reference Nzenti, Abaga, Cheo and Nzolang2011) (Fig. 1).
Geological map of the northwest region including the study area (modified from Kamgang et al., Reference Kamgang, Chazot, Njonfang and Tchoua2008).
The Precambrian rocks are mainly granite, orthogneiss and migmatite-gneiss. Garnet-bearing leucogranites form the main rock units in the massif. They are medium- to fine-grained, mainly consisting of coarse-grained quartz (20–28 vol.%), plagioclase (25–31 vol.%) and subhedral orthoclase (34–36 vol.%). Muscovite (5–10 vol.%) forms small euhedral inclusions in garnet, whereas biotite (1–2 vol.%) displays 0.5 mm × 3 mm flakes. Garnet (1–5 vol.%) is ubiquitous and occurs as large, equigranular, euhedral or subhedral grains containing few mineral inclusions. Orthogneisses are medium-grained and heterogranular. They are composed of quartz (15–20 vol.%), K-feldspar (16–22 vol.%), plagioclase (34–40 vol.%) and biotite (10–15 vol.%). Accessory minerals include titanite (2–4 vol.%), zircon, apatite and ilmenite (≤2 vol.%). Migmatitic gneisses are medium-grained. They display millimetre- to centimetre-thick granoblastic and heterogranular layers with quartz and feldspars alternating with ferromagnesian-rich (biotite) layers. Mineral associations consist of polycrystalline quartz ribbons, subhedral K-feldspar and plagioclase, biotite flakes, pink, rounded or corroded garnet and lamellar graphite.
Various volcanic rocks such as plateau basalts, trachyte, rhyolite and ignimbrites (Gountié et al., Reference Gountié2012; Kamgang et al., Reference Kamgang, Chazot, Njonfang, Tchuimegnie and Tchoua2013) of Cretaceous age are present. Basalts are very common, composed of calcic plagioclase, clinopyroxene and Fe-oxide minerals, and in some cases olivine, quartz, hornblende, nepheline and/or orthopyroxene (Gountié et al., Reference Gountié2012; Guedjeo et al., Reference Guedjeo, Kagou, Ngapgue, Nkouathio, Zangmo, Gountié and Nono2013).
Tertiary trachyte constitutes the CVL. Ignimbrites are associated with these volcanic rocks and are sparsely distributed over the Bamenda Mountains (Gountié et al., Reference Gountié2012).
The regional soils correspond to sesquioxide soils (Vallerie, Reference Vallerie1973), characterized by ferralitic ‘ABC’ profiles with an ‘A’ layer enriched in organic matter, a thick ‘B’ layer rich in Al or Fe oxyhydroxides and a ‘C’ layer characterized by completely weathered materials.
MATERIALS AND METHODS
Study area and sampling techniques
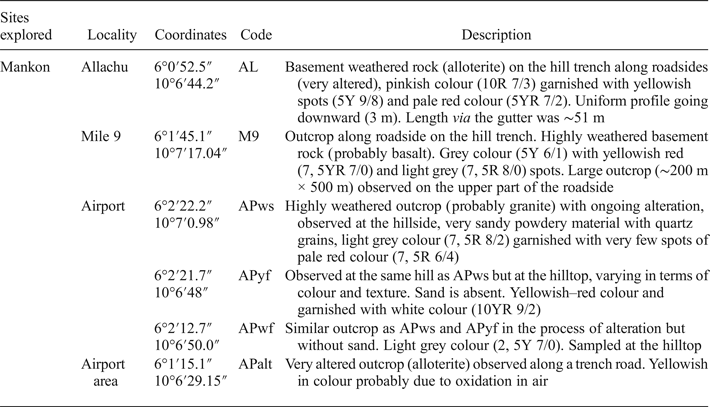
Four sites occupying an area of 7 km2 were investigated during the present study. Samples were collected using a geological hammer along road cuts according to the extent, typological nature and physical characteristics of the clay materials. Sampling was based on the observed colour variation of the clay types. The colours were determined by a Munsell soil colour chart. Table 1 presents a summary of the collected samples.
Descriptions of kaolin clays sampled.
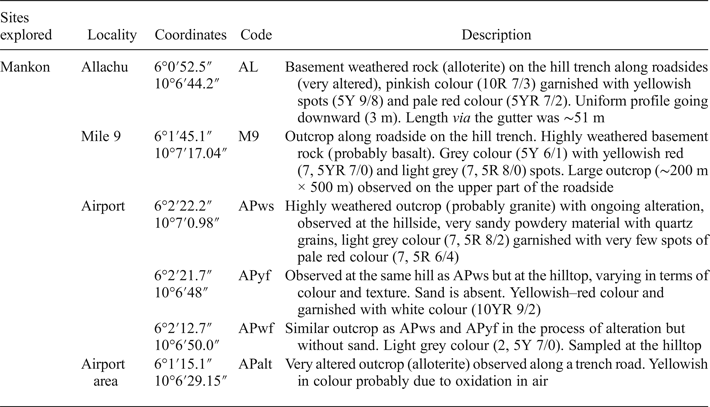
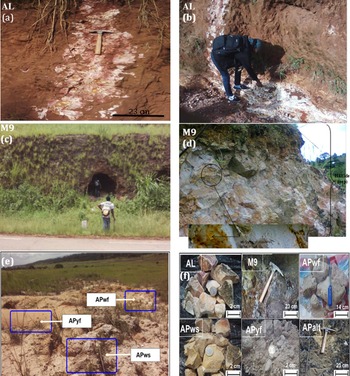
Site 1 (Allachu, Mile 8, Mankon) has a very weathered basement rock on the hill trench along the sloping heap, spreading into the gutter and even onto part of the roadside (AL; Fig. 2a,b). The outcrop was cleared using a cutlass to observe the real colour of the subsurface (Table 1). The clay had a uniform profile over the observed section, which was ~51 m long.
Sampling characteristics. Six samples were collected in the field: (a,b) Sample AL at Allachu Mile 8, found along the roadside, whitish in colour. The talus was cleaned using a cutlass to gain a better view of the profile and the real colour of the outcrop due to advanced alteration of the rocks. The reddish or brownish colour may be due to oxidation in air. (c,d) Sample M9 at Mile 9 was observed along the trench road with a steep slope, having a soft texture and being yellowish/whitish in colour, probably due to the presence of iron oxidation. Some cavities are present due to previous exploitation. (e) Samples APwf, APyf and APws at the same outcrop on a hill around Bamenda Airport; differences are noted in their colour and 24 textures. (f) A representative selection of the samples used for characterization at the laboratory.
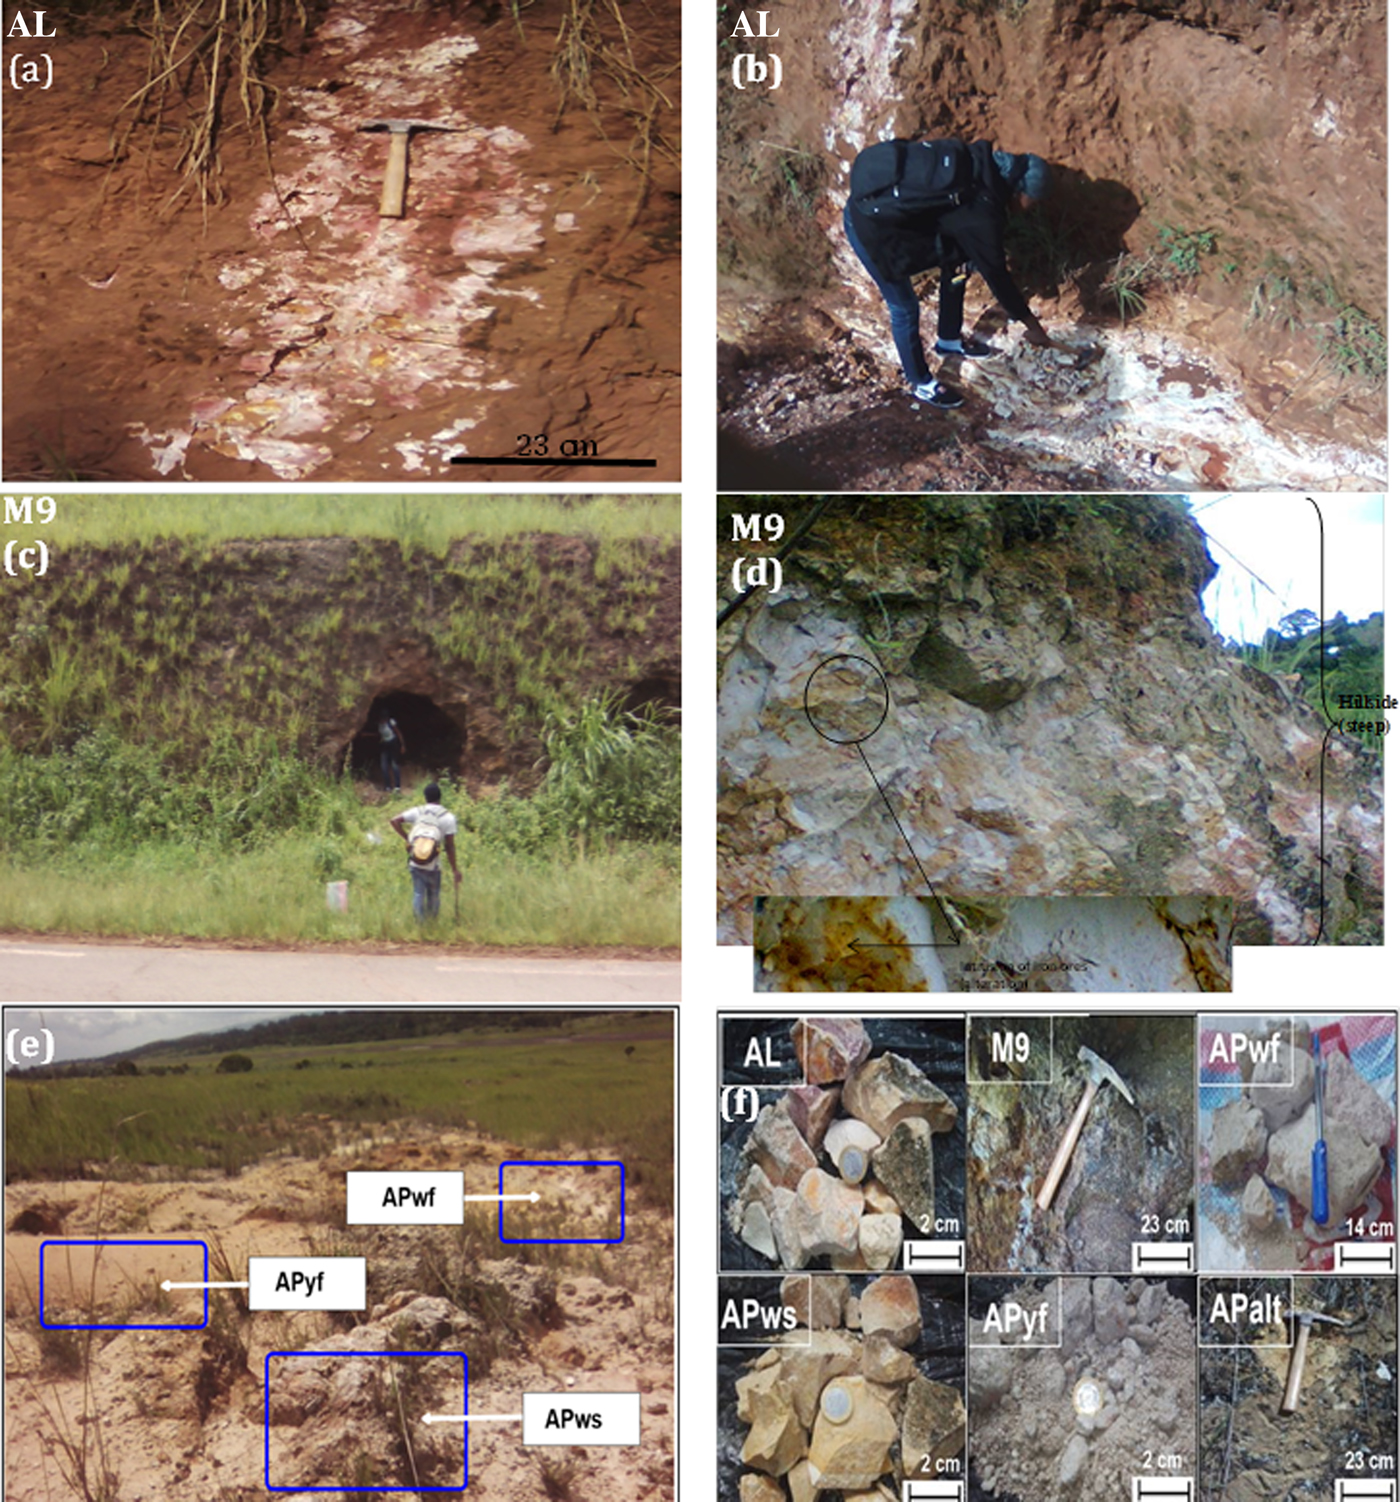
Site 2 (Mile 9, Mankon; Fig. 2c,d) corresponds to a large outcrop along the roadside. The parent rock is highly weathered. The outcrop surface appears altered with reddish dots that may be due to iron oxidation. Sampling was performed in a nearby cave. The collected clay (M9) was slightly hard.
Site 3 (Bamenda Airport; Fig. 2e) has three types of clays at the outcrop, namely: a whitish sandy and soft clay (APws) with quartz grains on the hillside; a yellowish, sand-free and soft clay (APyf) on the hilltop similar to APws, but with variable colour and texture; and a whitish, sand-free clay (APwf) also on the hilltop. These were probably derived from the alteration of granite. Site 4 (Alamandum, Airport area) displays whitish clays with yellowish spots. They correspond to weathered basaltic bedrock at an advanced stage of alteration (APalt).
Analytical methods
The selected clay samples were subjected to granulometric, plasticity, chemical (XRF, organic matter content, methylene blue index) and mineralogical analyses. They were then fired between 1000 and 1300°C to test their suitability for application in ceramics. Mineralogy was determined with XRD on random powder aggregates using a Bruker Advance D8 ECO diffractometer (Cu-Kα1 radiation, 40 kV, 30 mA) in the laboratory of Argiles, Géochimie et Environments Sédimentaire (AGEs) at the University of Liège, Belgium. The measurements were carried out in the 2θ range from 2° to 45° with a step size of 0.02° and 2 s per step. Identification of mineral phases and semi-quantitative analysis were carried out with Eva and Topaz software, respectively (Scarlett et al., Reference Scarlett, Madsen, Cranswick, Lwin, Groleau, Stephenson, Aylmore and Agron-Olshina2002). Fourier-transform infrared (FTIR) spectra were recorded on a Nicolet NEXUS FTIR spectrometer. A scanning electron microscope (Philips ESEM XL30 FEG) was used to observe the microstructure of kaolinite on gold-coated samples.
Particle-size distribution (ASTM norm D-422) was performed in two steps: (1) sieving to determine the distribution of the ≥80-μm size fraction; and (2) hydrometer sedimentation for the <80 μm size fraction. Forty grams of the fine fraction was treated with Na-hexametaphosphate N/1000 under agitation for 24 h. The Atterberg limits (liquid limit [LL], plastic limit [PL] and plasticity index [PI]) were obtained with the Casagrande method (ASTM norm D-4318, American Society for Testing and Materials, 2000).
Chemical composition was determined with XRF spectroscopy on pressed powder pellets using S4 PIONNER Brucker equipment. The samples were dried at 40°C and ground manually with an agate mortar to obtain a powder with a particle size of <250 µm. The organic matter content was determined after calcination of the samples in an oven at 550°C for 4 h. The methylene blue test determines the capacity of clay to adsorb cations from solution via ion exchange. The number of ions available for this exchange depends on the abundance and type of clay minerals (Norme Française-AFNOR NFP18-592, 1990).
The test specimens (8 cm × 4 cm × 1.8 cm) were shaped with a 10 kN hydraulic press. The drying shrinkage (up to 110°C) and firing shrinkage values were obtained according to the relative variation in the length of the specimen from the equations 1 and 2:
 $${\hbox{drying shrinkage}} = 100\left( {L_{\rm p} - L_{\rm d}} \right) / L_{\rm p}$$
 $${\hbox{firing shrinkage}} = 100\left( {L_{\rm m} - L_{\rm f}} \right) / L_{\rm m}$$
where L m is the length of the mould and L p, L d and L f are the lengths of the pressed, dried and fired specimens, respectively. The water absorption and bending strength were determined using ASTM norms C373-72 (American Society for Testing and Materials, 1972) and C674-77 (American Society for Testing and Materials, 1977), respectively.
RESULTS
Mineralogical and physicochemical characteristics
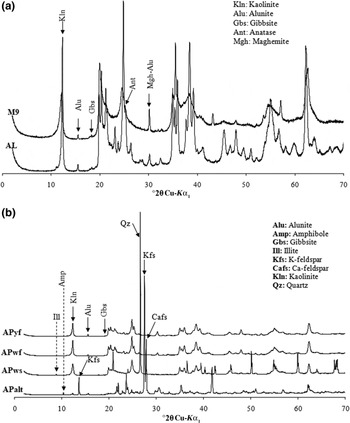
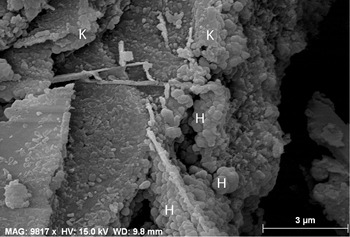
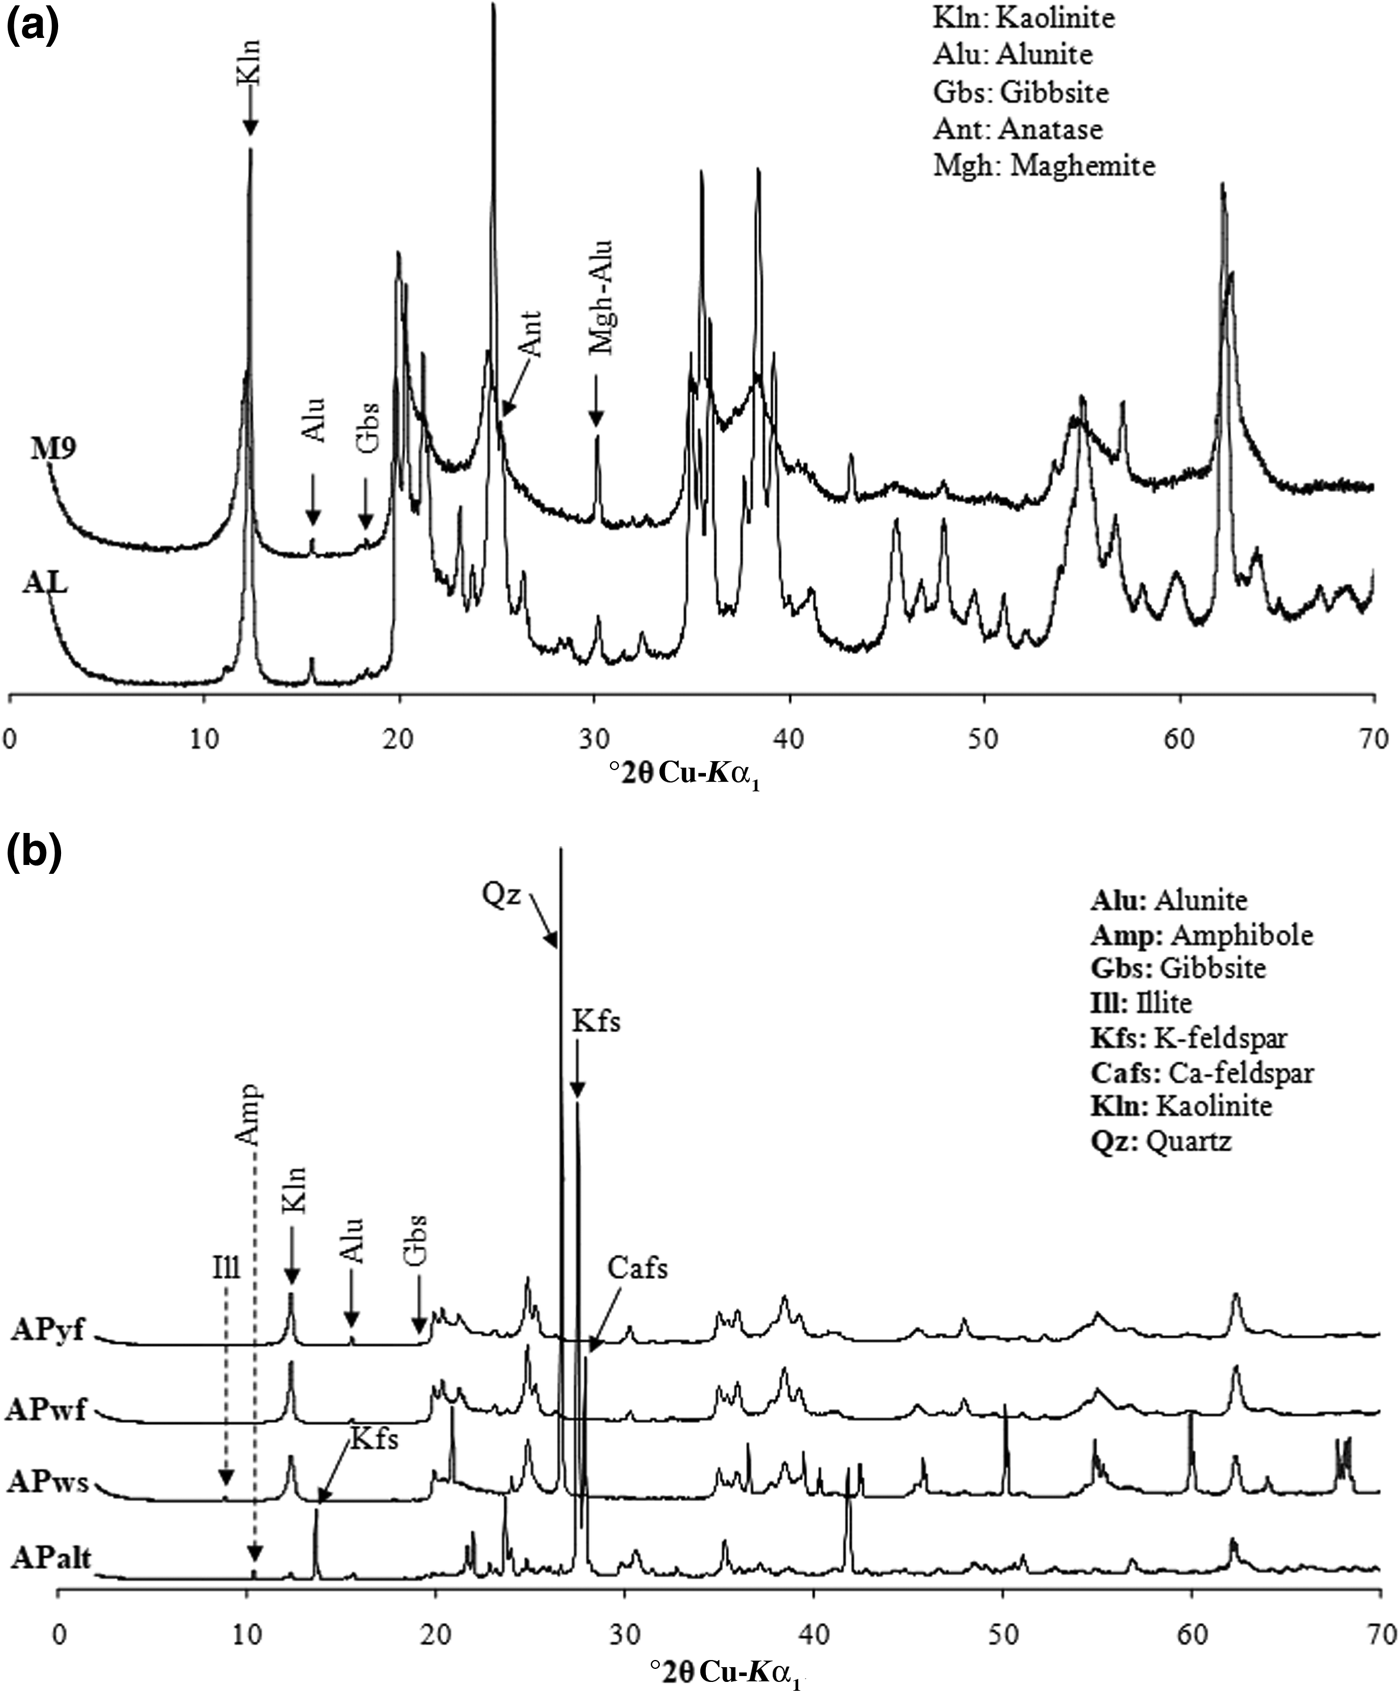
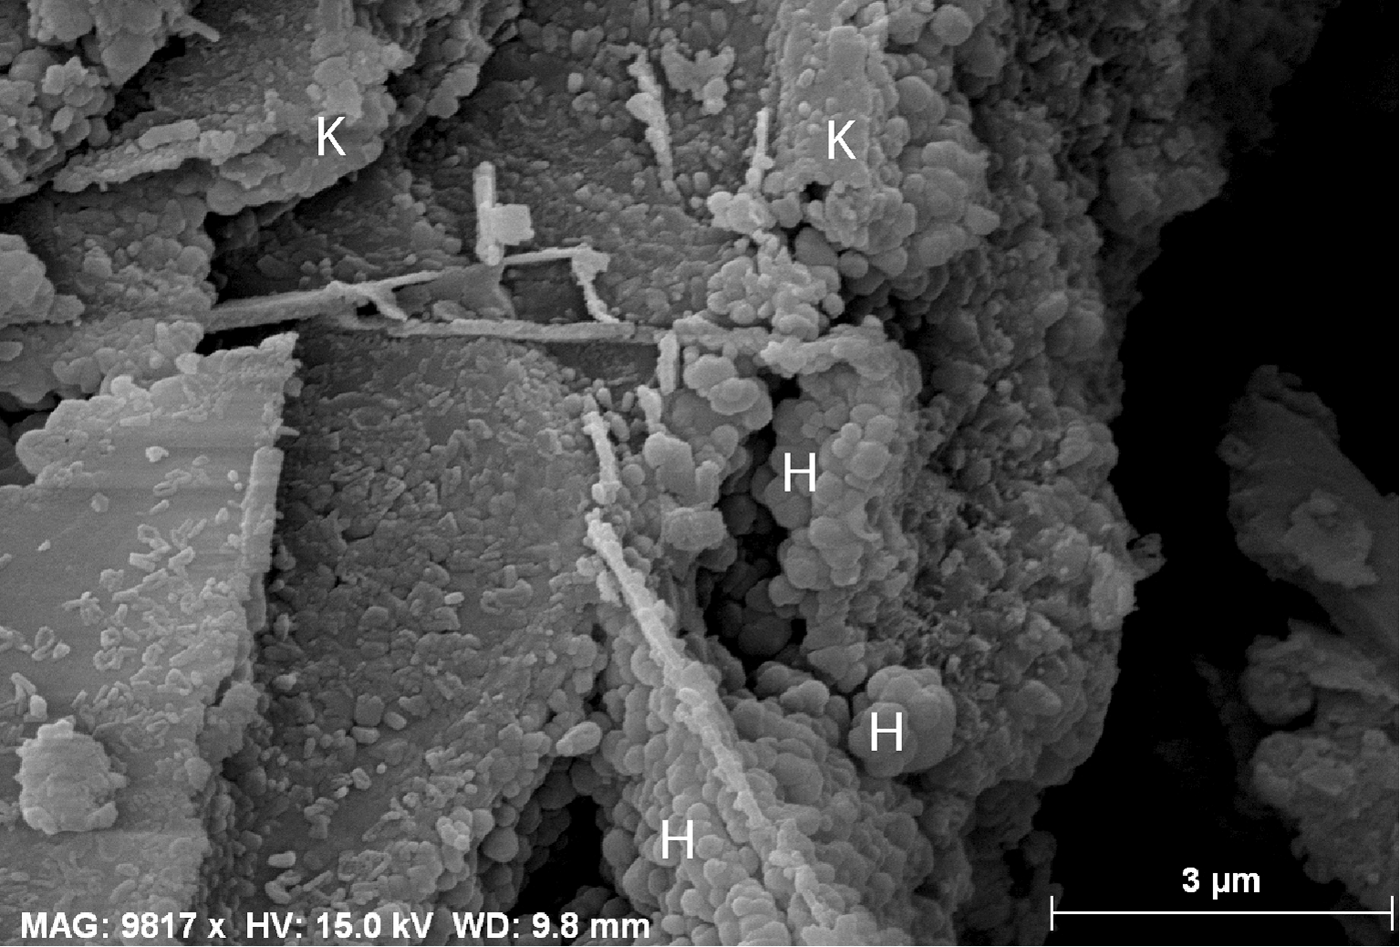
The XRD results (Fig. 3a,b) indicate similar mineralogical compositions for samples AL, M9, APwf and APyf, with prominent peaks at 7.16 Å (APws, APyf and APwf), 7.20 Å (AL) and 7.31 Å (M9). The d peaks at 7.20 and ~3.5 Å are assigned to kaolinite, whereas the 7.31-Å peak, coupled with an intense reflection at ~4.4 Å, may correspond to 7 Å halloysite (Quantin et al., Reference Quantin, Gautheyrou and Lorenzoni1988; Pialy, Reference Pialy, Nkoumbou, Villieras, Razafitianamaharavo, Barres, Pelletier, Ollivier, Bihannic, Njopwouo, Yvon and Bonnet2008). The peak at 7.31 Å is probably indicative of the coexistence of detrital kaolinite and halloysite in sample M9. The SEM images confirm the presence of spheroidal halloysite in sample M9 (Fig. 4). Trace anatase (1–5%, main peak at 3.51 Å) and alunite (2%, main peak at 5.71 Å) are also present, while maghemite and traces of gibbsite and hematite are also observed in sample M9. Sample APws displays high quartz (32%), kaolinite (63.9%) and illite (3.7%) contents. Sample APalt has abundant K-feldspar (~25% microcline) and plagioclase (61.8%) and small kaolinite (8.5%) and amphibole (4.4%) contents.
XRD traces of whole-rock samples: (a) AL and M9; (b) others samples. Five samples (AL, M9, APwf, APyf and APws) contain kaolinite as major minerals. Sample APws also contains quartz and illite, while sample APalt also contains K-feldspar and plagioclase.
SEM image of sample M9: note here the presence of the spheroidal form of halloysite.
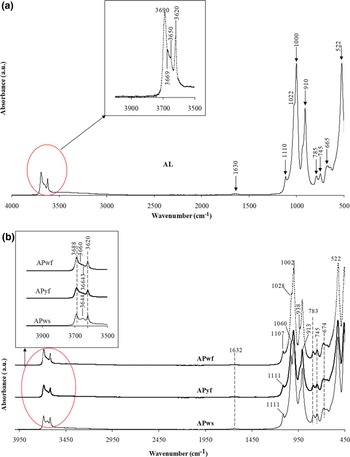
The FTIR spectra of four of the samples (AL, APws, APwf, APyf) are presented in Fig. 5a,b. The XRD data reveal that these clay materials are mixtures of kaolinite, illite, anatase, gibbsite, alunite and feldspars. The spectra display four strong OH-stretching bands (3688, 3669, 3650, 3620 cm–1) characteristic of kaolinite (Farmer, Reference Farmer and Farmer1974), though the bands at 3669 and 3650 cm−1 appear as shoulders, whereas the band at 3620 cm–1 is considered to represent the contributions of kaolinite and occasional illite. Regarding the lower OH-stretching frequency range (3500 cm–1), the FTIR spectra do not display the bands assigned to the Fe–Al–OH vibration in agreement with the chemical composition of these samples. This suggests that the clays do not contain significant amounts of octahedral Fe. Stretching bands at 3669 and 3654 cm–1 indicate a well-ordered kaolinite (Boulingui et al., Reference Boulingui, Nkoumbou, Njoya, Thomas and Yvon2015) in the AL sample (Fig. 5a). The remaining bands are related accessory minerals that accompany kaolinite, such as quartz and feldspars. These series of bands encountered are:
• 1111, 1107, 1060, 1028 cm–1, which may be related to the Si–O-stretching vibration in kaolinite/quartz;
• 938 and 910–913 cm–1, which correspond to the inner surface and inner Al–OH–Al bending vibrations of kaolinite;
• 783–785, 745, 674, 665 cm–1, which correspond to Si–O-stretching vibrations.
IR spectra of analysed samples: (a) AL; (b) samples APws, APys and APwf. Four strong OH-stretching bands (3688, 3669, 3650, 3620 cm–1), characteristic of kaolinite, are present.
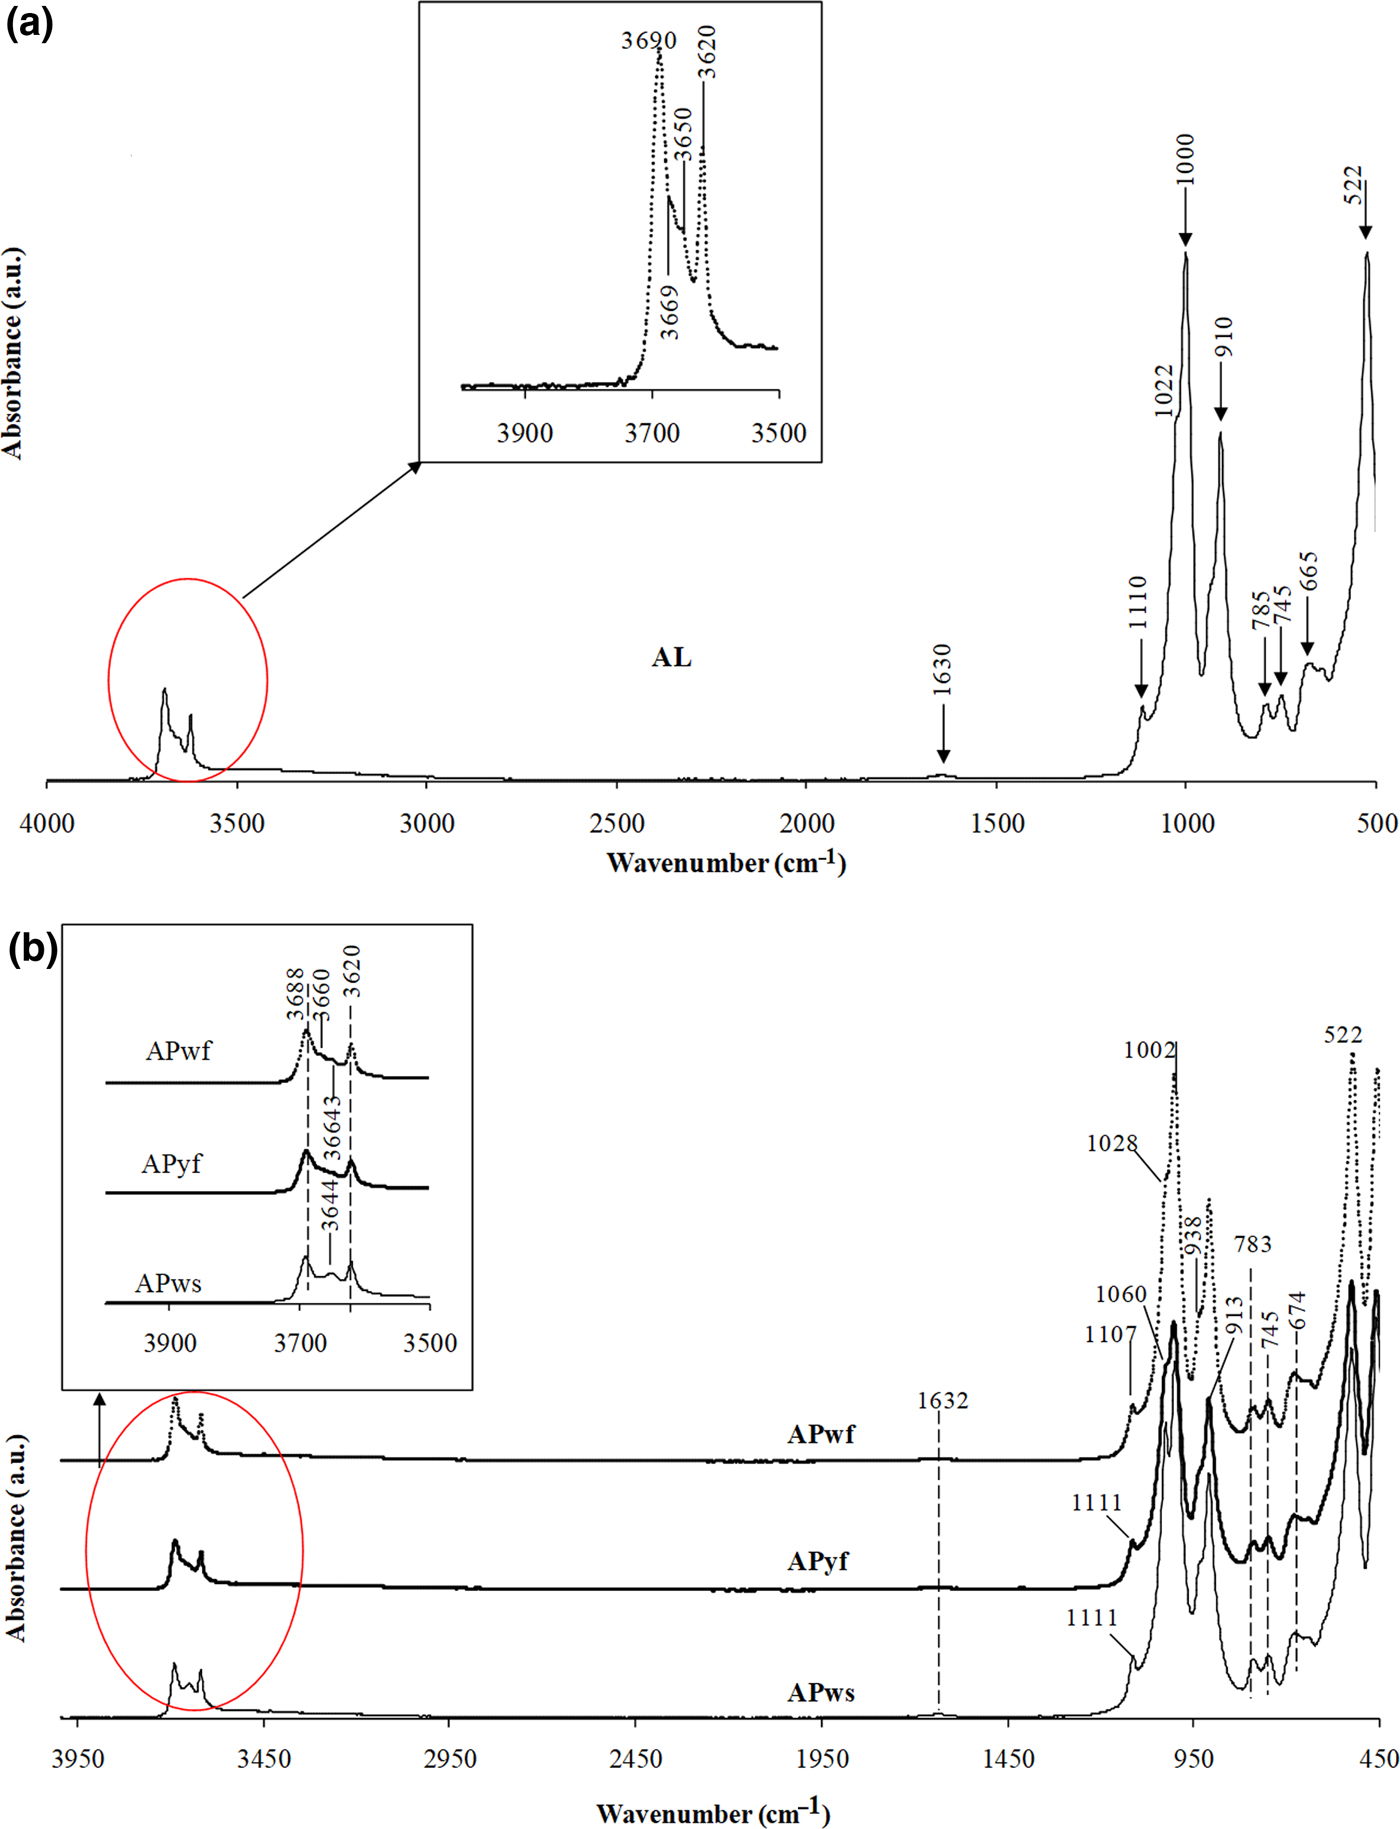
The results of the FTIR study confirm and complement the mineralogical composition determined by XRD. There is high-quantity kaolinite (64–97%) in five samples (AL, M9, APyf, APwf and APws) and it is associated with halloysite in sample M9.
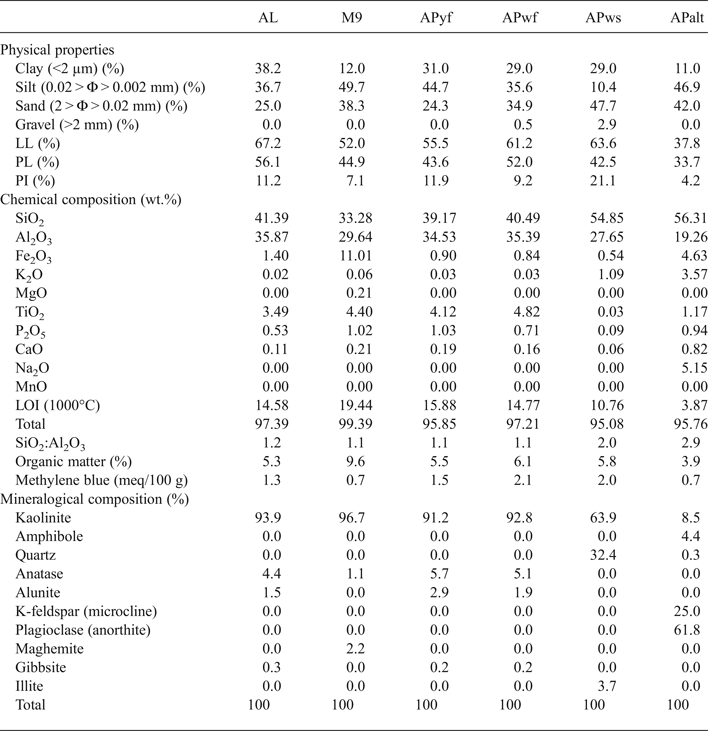
The chemical compositions of the clays are listed in Table 2. Sample APalt is depleted in Al2O3 (19%) and contains abundant SiO2 (56%), Fe2O3 (5%) and alkalis (K2O + Na2O, 9%). The TiO2 content in APalt and APws is <1% being ~4% in the remaining samples. APalt is has a low loss on ignition (LOI) at 1000°C (4%) compared to the remaining samples (11–19%) and a low organic matter content (4%) compared to the remaining clays (5–10%). The samples contain ~33–55% SiO2 and ~28–36% Al2O3 and small abundances of alkalis and alkaline earth elements. The values of methylene blue obtained in all samples are 0.7–2.0 meq/100 g.
Mineralogical and chemical compositions and physical properties of the kaolin clays.
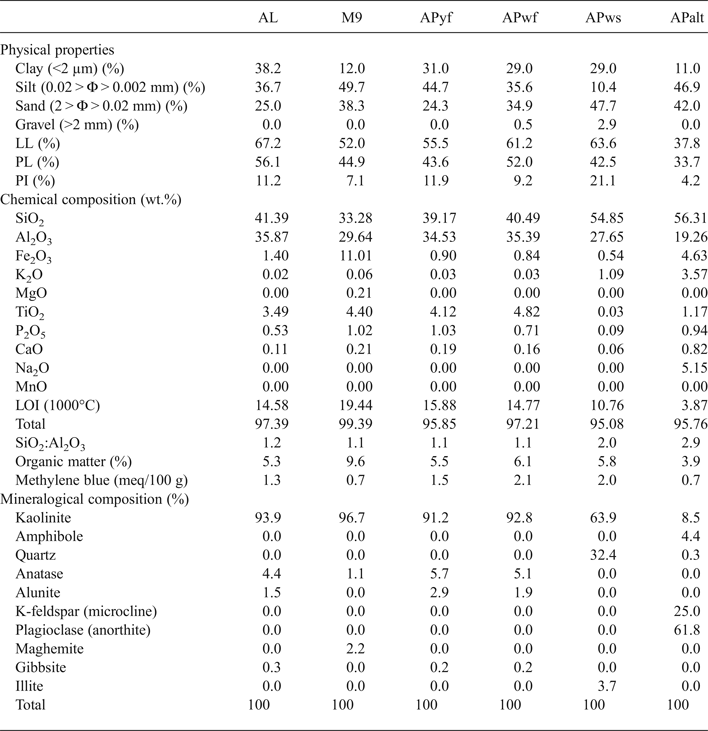
The <2 μm clay fraction is 11–12% in APalt and M9, being higher (29–38%) in the AL, APyf, APwf and APws samples. The gravel fraction (>2 mm) is only present in sample APws (3%). APws also has the greatest (48%) sand fraction (2 > Φ > 0.02 mm) and the smallest (10%) silt fraction (0.02 > Φ > 0.002 mm). The silt and sand fractions vary between 25% and 50% in the remaining samples (Table 2). Finally, the PI varies from 4% (APalt) to 21% (APws), while the LL varies between 52% and 67%.
Firing properties
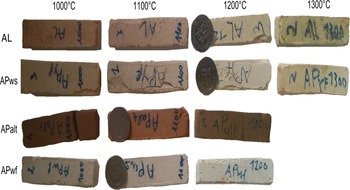
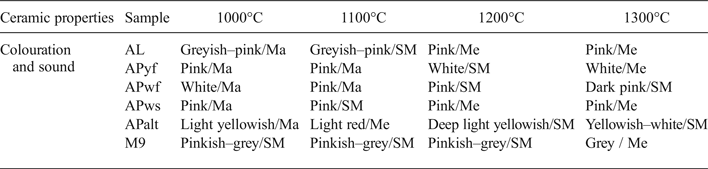
The colour of firing specimens between 1000°C and 1300°C varies between samples with increasing temperature (Table 3, Fig. 6). Sample AL has greyish–pink to pink colour, while M9 is pinkish–grey. The colour of APyf varies from pink to white, while that of APwf varies from white to pink. No change in colour was observed for APws. APalt varies from light yellowish to deep light yellowish. The sound also varies with increasing temperature. The matt sound is observed at 1000°C for all samples except M9, which has a slightly metallic sound. Beyond 1000°C, the sound becomes slightly metallic to metallic except for in samples APyf and APwf, which stayed matt at 1100°C. APalt gave a metallic sound at 1100°C and a slightly metallic sound at 1200°C.
Fired products and the variation of colour with increasing temperature: AL, greyish to pink; APyf, pink to white; APwf, white to pink; APws, remains white; APalt, light to deep light yellowish.
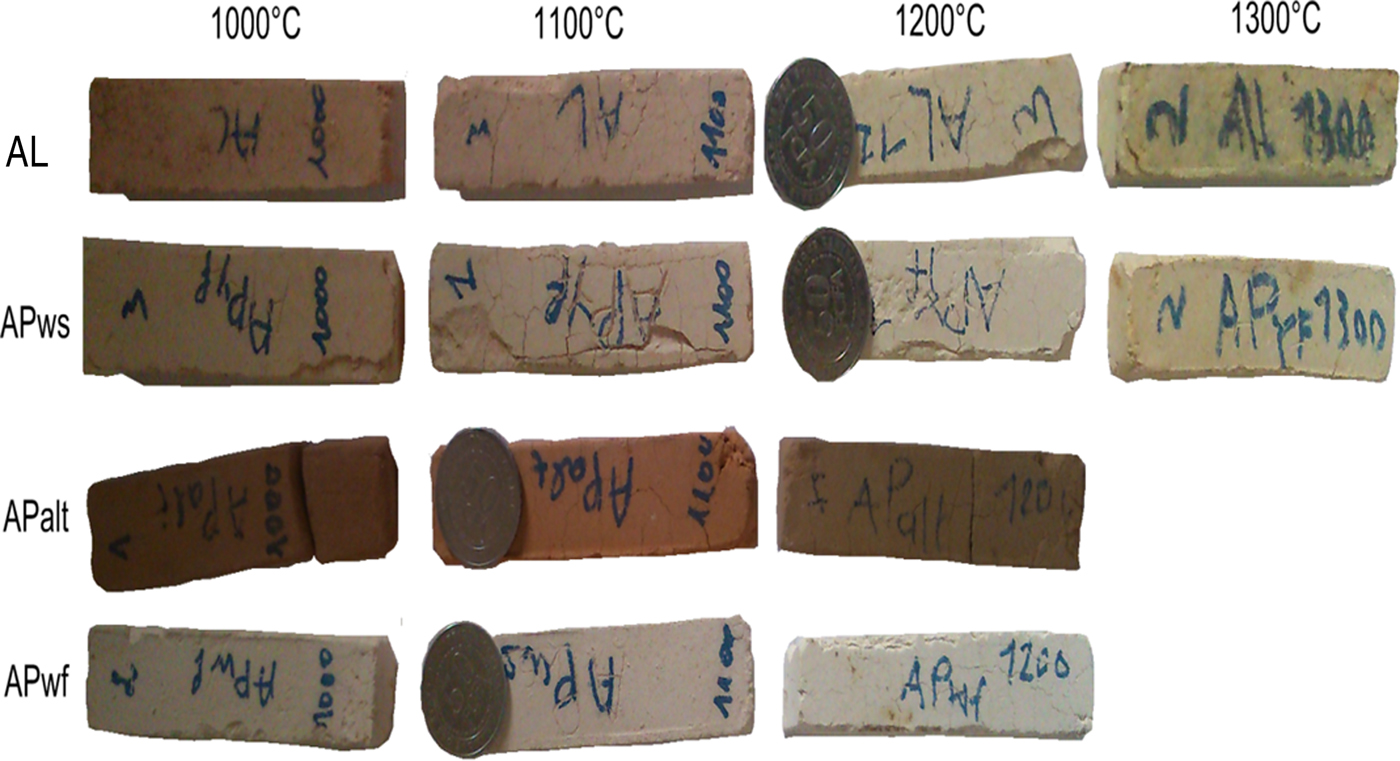
Colour and sound of firing specimens.
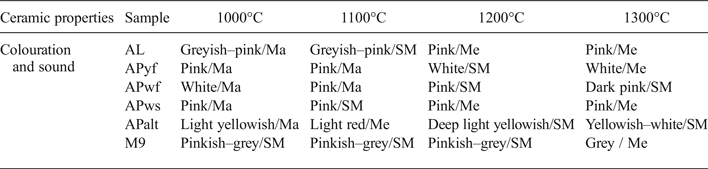
Ma = matt; Me = metallic; SM = slightly metallic.
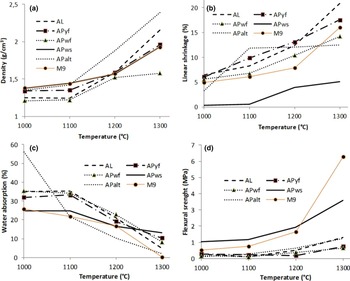
The bulk density of the fired samples increased with increasing temperature (Fig. 7a); it varies from 1.21 g cm–3 at 1000°C to 2.16 g cm–3 at 1300°C. APalt shows the highest bulk density at temperatures >1100°C. The density of sample AL also increases at temperatures >1200°C. APyf shows the lowest bulk density values among all samples.
(a) Bulk density, (b) linear shrinkage, (c) water absorption and (d) flexural strength of firing specimens.
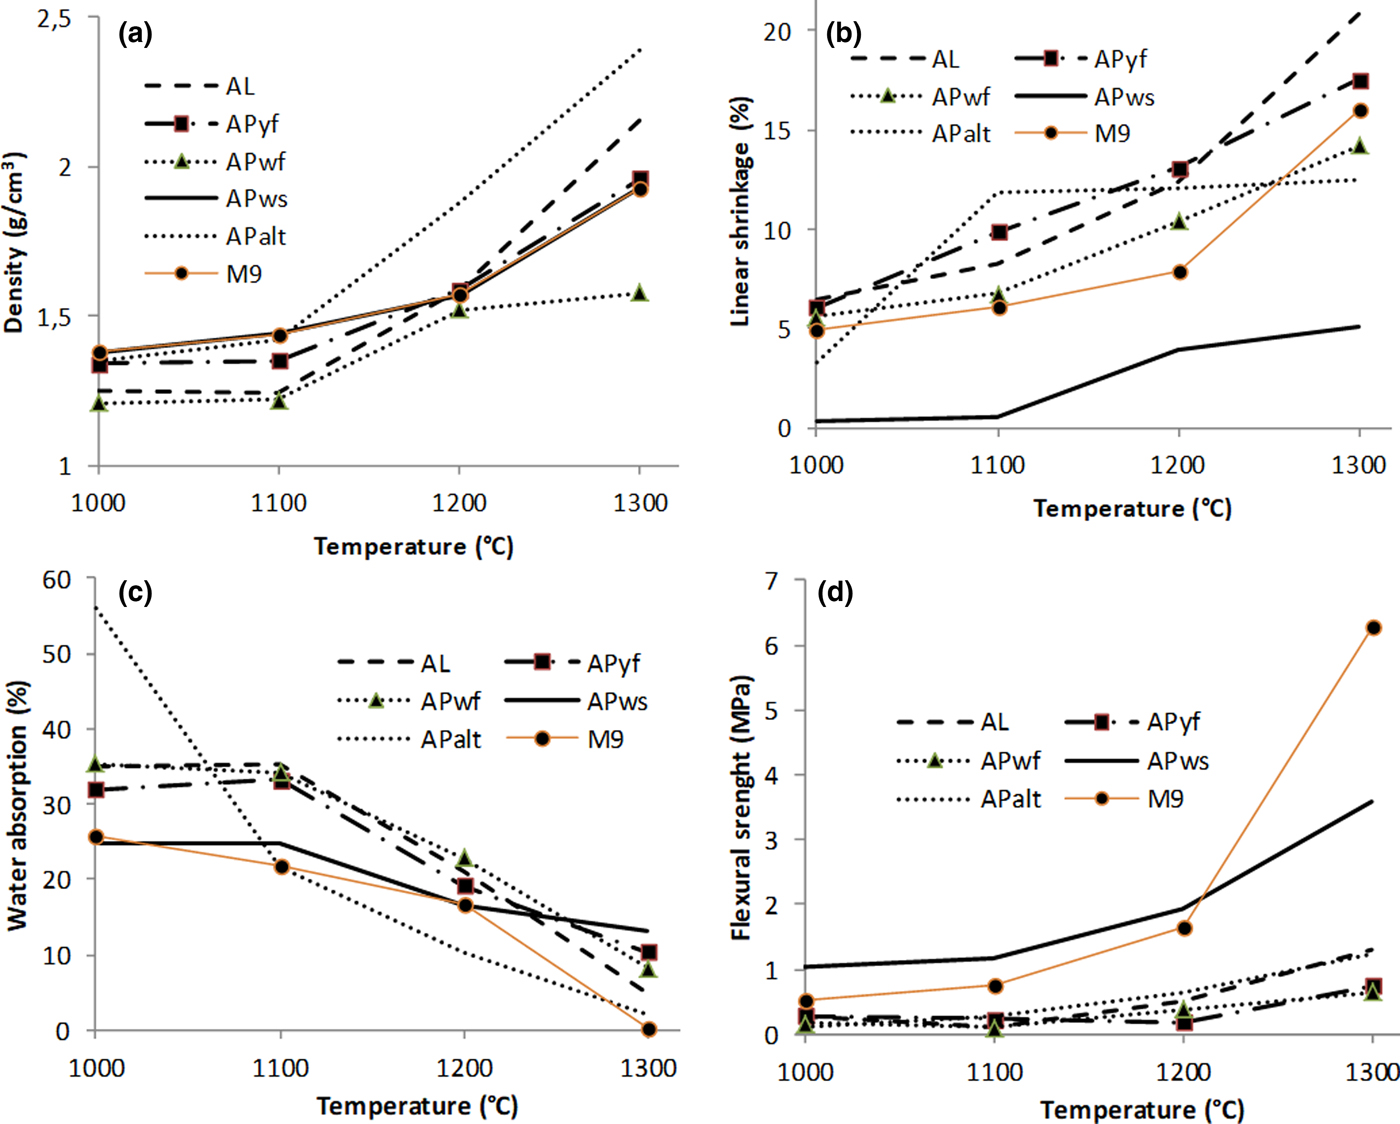
The linear shrinkage increases with increasing temperature except in sample APalt, in which it slightly decreases at >1100°C (Fig. 7b). APws and, at 1000°C, APalt display significantly lower linear shrinkages (0.37–5.00%) than the remaining samples (6–20%). Water absorption decreases with increasing temperature in all samples (Fig. 7c). APalt presents the greatest water absorption value (56%) at 1000°C, which then decreases at 1100°C (22%) and at 1300°C (2%). APws displays constant water absorption from 1200°C to 1300°C. Flexural strength varies from 0.11 to 6.27 MPa, with sample M9 having the highest value at 1300°C (Fig. 7d). The flexural strength of APws is significantly greater (>1 MPa) below 1300°C.
DISCUSSION
Mineralogical characterization
Among the samples analysed, only APws, with its high quartz content, may be considered as a sandy clay developed on granitic rocks. The absence of quartz in the remaining samples suggests that they were derived from weathering of the basaltic bedrock. This observation is consistent with the geological context of the study area. However, trace quantities of alunite suggest the presence of a volcanic parental material during the weathering process, which is favoured by the circulation of SO4-rich fluids (Scott, Reference Scott1992).
The abundance of kaolinite in four samples (AL, APyf, APwf and APws) with the predominance of halloysite in M9 may be linked to intense hydrolysis (monosialitization) of the parental rocks (Ossah, Reference Ossah1975; Wouatong, Reference Wouatong, Kitagawa, Takeno, Tchoua and Njopwouo1996). The presence of gibbsite reflects complete removal of silica (alitization process). The abundance of kaolinite and the presence of gibbsite are characteristic of tropical weathering conditions (e.g. Wilson, Reference Wilson2004; Herrmann et al., Reference Herrmann, Anongrak, Zarei, Schuler and Spohrer2007).
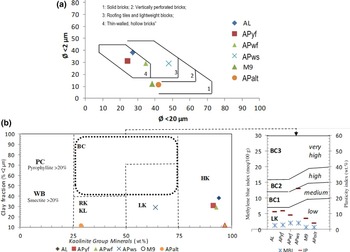
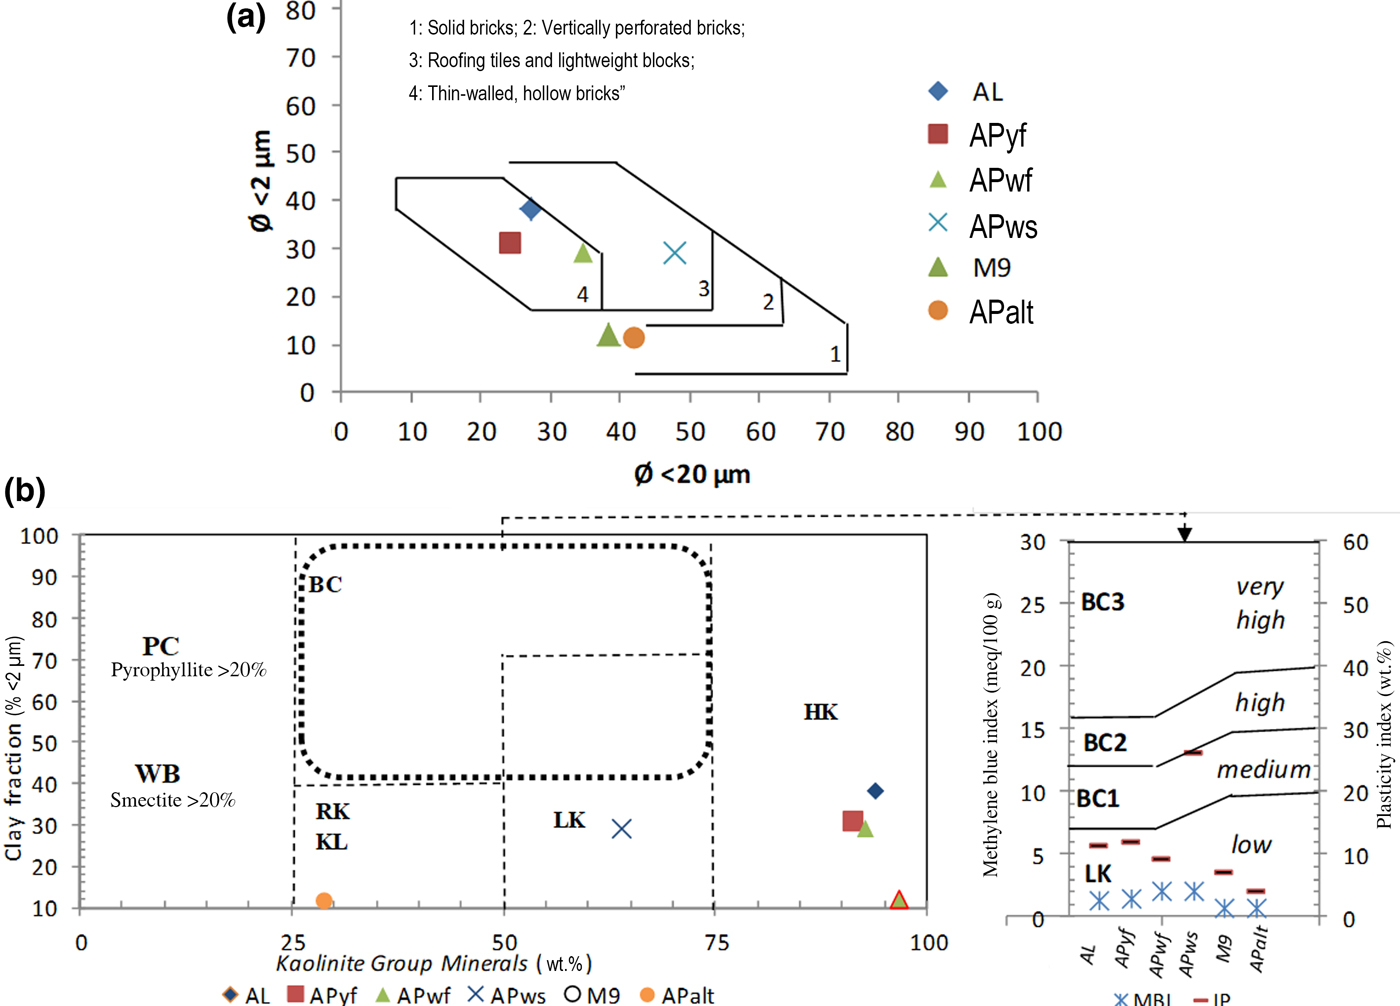
Among the six samples studied, five samples (AL, M9, APyf, APwf and APws) may be considered as kaolin raw materials. Their kaolinite contents (associated with halloysite in sample M9) varying from 64% to 97%, allows for their classification as high-grade kaolin (HK) raw materials (Fig. 8a). This grade of kaolin raw materials produces highly refractory ceramics and is typically used in small amounts (10–15%) in engobes (clay slip coating) and glazes, as well as in porous and vitrified bodies (Ekosse, Reference Ekosse2000; Reeves et al., Reference Reeves, Sims and Cripps2006; Nkoumbou et al., Reference Nkoumbou, Njoya, Njoya, Grosbois, Njopwouo, Yvon and Martin2009; Dondi et al., Reference Dondi, Mariarosa and Chiara2014), in accordance with the observations of Kamseu et al. (Reference Kamseu, Leonelli, Boccaccini, Veronesi, Miselli, Giancarlo and Chinje2007).
(a) Position of studied samples in Winkler's diagram. (b) Classification of light firing clays according to their amounts of kaolinite group minerals and clay fractions, as well as their methylene blue index and Atterberg plasticity index (IP) (Dondi et al., Reference Dondi, Mariarosa and Chiara2014). KL = kaolinitic loam; BC = ball clay; PC = pyrophyllic clay; WB = white bentonite.
The large amount of K-feldspar (microcline) and Ca-rich plagioclase in APalt confirms that hydrolysis is still ongoing. Due to the small kaolinite content (8.5%), sample APalt should not be considered as a kaolin raw material.
Chemical characterization
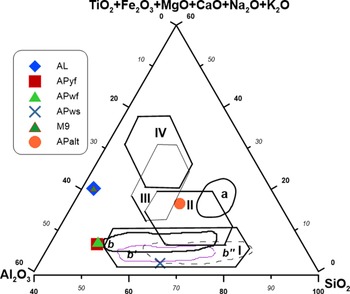
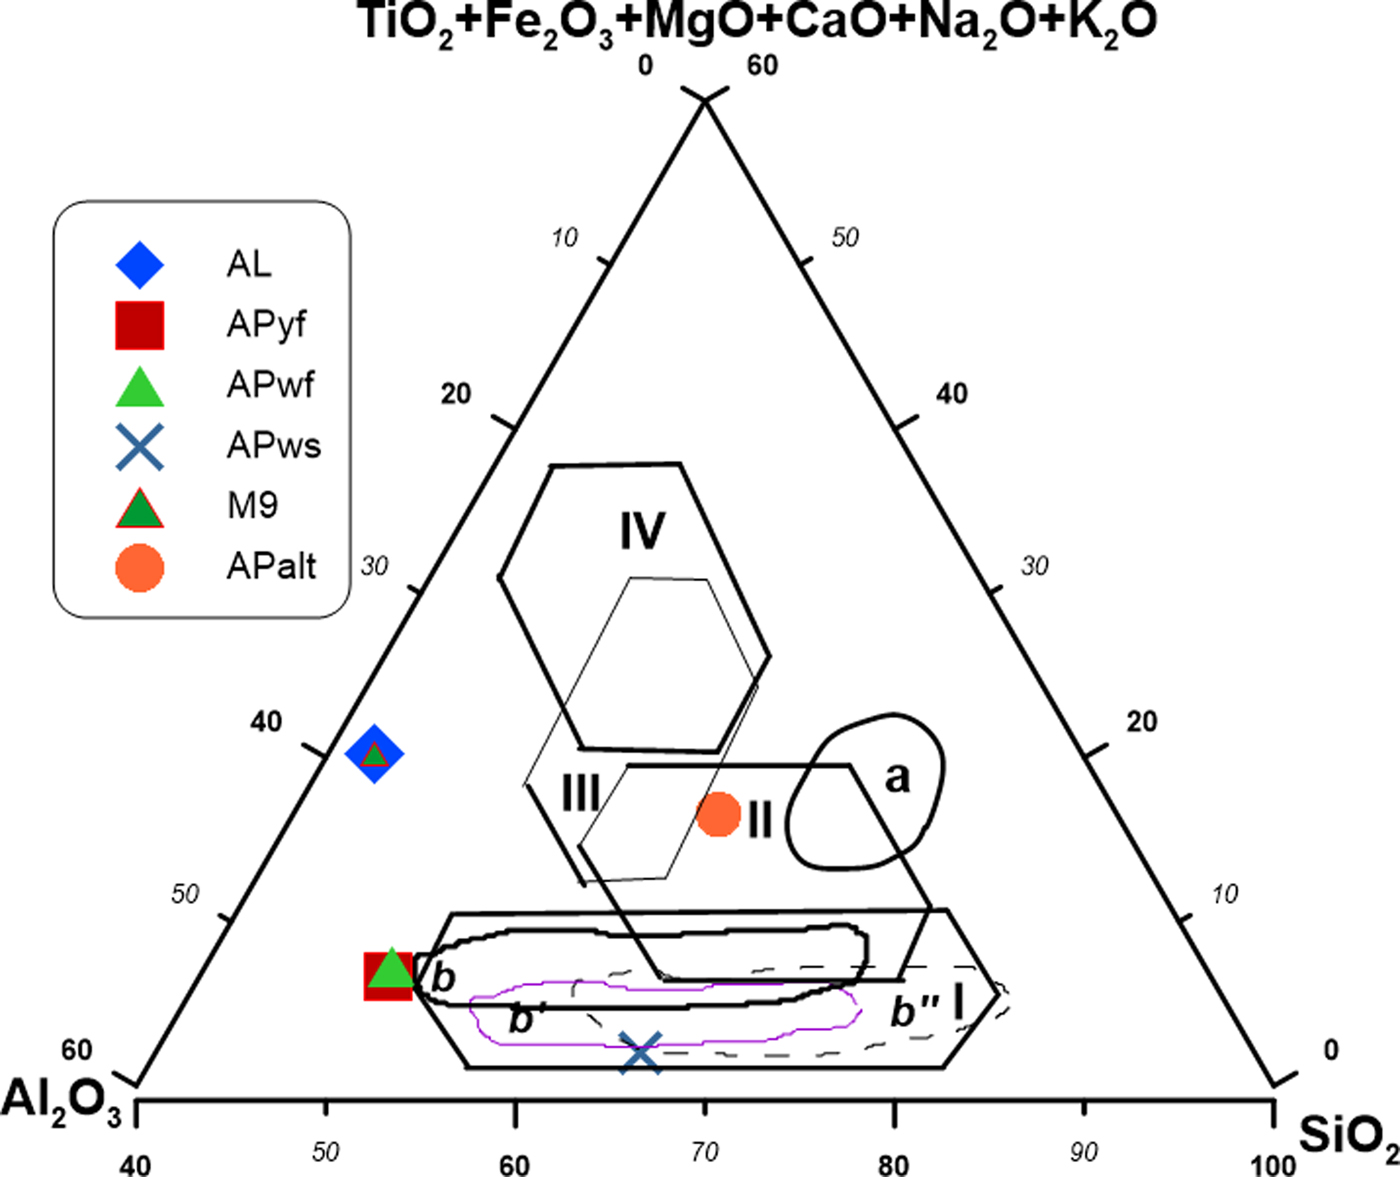
The chemical compositions of the studied clay samples were correlated with their mineralogical compositions. The amount of SiO2 and Al2O3 (>25%) in kaolin is in agreement with the presence of kaolinite and the small quartz content observed in XRD traces. The LOI at 1000°C (14–19%) largely represents organic matter losses and water from dehydroxylation of kaolinite, which confirms the presence of non-swelling clays (K/H). The low Fe2O3 (<1%) and TiO2 (<1%) contents in some samples suggest the absence of iron minerals and anatase, respectively, and may explain the whitish colour during firing. The presence of maghemite in sample M9 in association with illite reflects the greater iron oxide content (11%) compared to the remaining samples. The large contents of alkali and alkaline earth elements in APalt are in agreement with the abundant feldspar (Table 2). The K2O contribution (1.09%) in APws reflects the presence of illite in this sample. A SiO2:Al2O3 ratio of ~1 is characteristic of kaolinitic clay materials. SiO2:Al2O3 ratios of ~2 indicate a mixture of kaolinite/illite (Elfil et al., Reference Elfil, Srasra and Dogguy1995), and the small amount of total alkali (K2O + Na2O) in the kaolin samples indicates a high degree of kaolinization (Kamseu et al., Reference Kamseu, Leonelli, Boccaccini, Veronesi, Miselli, Giancarlo and Chinje2007). The alkalis and alkaline earth elements and the pH values play significant roles in the kaolinization process in humid tropical climatic zones. The fluid not only facilitates the formation of kaolinite, but also improves the quality of kaolin by depleting the argillaceous saprolite in impurities such as Fe and Ti (Dill, Reference Dill2016). The synthetic triangular diagram shows that APws might be suitable for the white sandstone tiles of the German, English and French industries, compatible with the white body domain (Fig. 9).
Synthetic triangular diagram according to Fiori et al. (Reference Fiori, Fabbri, Donati and Venturi1989), Strazzera et al. (Reference Strazzera, Dondi and Marsigli1997) and Ngun et al. (Reference Ngun, Mohamad, Sulaiman, Okada and Ahmad2011): SiO2/Al2O3/other oxides. Domains II and a = red sandstone tile (Italy); domains b, b′ and b″ = white sandstone tile of the German, English and French industries, respectively, compatible with domain I (white bodies); domains III and IV = ‘cottoforte’ and ‘majolica’ porous tiles, respectively.
Methylene blue values between 0.7 and 2.0 meq/100 g suggest that these clays are in the domain of silty clayey soils with low plasticity, characteristic of low-grade kaolins (Dondi et al., Reference Dondi, Mariarosa and Chiara2014). In addition, the kaolins have considerable organic matter contents (4–10%). The organic matter may be beneficial for low-plasticity clays such as the kaolins, as it increases plasticity and viscosity (Dill, Reference Dill2016). However, because it has a negative effect on the fabrication of ceramics, it is preferable to decompose the organic matter by using oxidizing firing atmospheres and pre-treating the clays (Nzeukou et al., Reference Nzeukou, Traina, Medjo, Kamseu, Njoya, Melo, Kamgang, Cloots and Fagel2014; Barrchina et al., Reference Barrchina, Calvet, Fraga and Carda2017). The organic matter burns off during firing, increasing the loss of mass as well as the Fe content (Dill, Reference Dill2016). This contributes to an increase in the porosity of the ceramic products and is not advantageous when it is abundant because it forms faults in ceramic tiles known as ‘black cores’ (Christidis, Reference Christidis2011; Barrchina et al., Reference Barrchina, Calvet, Fraga and Carda2017).
Physical characterization
The particle-size distribution of clay materials is important in ceramic fabrication, especially the clay fraction, which influences plasticity (De Modesto & Bernadin, Reference De Modesto and Bernardin2008; Andrade et al., Reference Andrade, Al-Qureshia and Hotza2011). The plasticity of APws (Table 2) is high due to an illite content of 3.7% and an abundant clay fraction (29%). Overall, the analysed samples mainly show low plasticity (<20%), except for APws (21%; medium plasticity). The low to medium plasticity is confirmed by the methylene blue values (poor adsorption of <2%). The classification diagram of light firing clays (Dondi et al., Reference Dondi, Mariarosa and Chiara2014) (Fig. 7b) classifies AL, M9, APyf and APwf as HKs, APws as low-grade kaolin (LK) and APalt, which is poor in kaolinite, as raw kaolin (RK). In the ceramic cycle, the behaviour of LKs is influenced by components associated with kaolinite in the plastic and non-plastic fractions. For instance, the technological performance of materials rich in kaolinite and poor in feldspars and expandable clay minerals does not substantially differ from that of HK, although their use is restricted to vitrified and porous bodies (usually in percentages greater than those of HKs), and generally they are not used in engobes and glazes (Dondi et al., Reference Dondi, Mariarosa and Chiara2014). Due to the low plasticity, the RK in tile-making might not fulfil the requirements for ceramic clays, but may be used as a sort of mix, thanks to comparable amounts of kaolinite, quartz and flux (feldspars, rock fragments) whose technological behaviour has to be balanced by the other clays and fluxes. APws, with its illite content, may be used as an additive in tile-making to enhance the percentage of the glass phase and lower the water absorption due to lowering of the melting point. Because of pyroplastic deformation, linear shrinkage decreases with illite content (Ferrari & Gualtieri, Reference Ferrari and Gualtieri2006).
Technological characterization
Samples M9 and APalt are ideal for solid bricks (Fig. 8a). APws plots in the domain of ‘roofing tiles and lightweight blocks’, while AL, APyf and APwf are optimal for thin-walled hollow bricks. Therefore, the particle-size distributions of the analysed samples are adequate for industrial ceramics. After firing (1000–1300°C), the colour of the various test pellets changes with increasing temperature and might be linked to the presence of anatase and Al2O3 (Pialy, 2009; Dondi et al., Reference Dondi, Mariarosa and Chiara2014). APwf and APws become whitish at temperatures >1200°C, probably due to their low Fe2O3 content (<1%). A metallic sound was noted at temperatures >1100°C in APalt, indicating the beginning of the glassy phases and mullite development. A ceramic material with good performance is characterized by a metallic sound (Nzeukou et al., Reference Nzeukou Nzeugang, Medjo Eko, Fagel, Kamgang Kabeyene, Njoya, Balo Madi, Mache and Melo Chinje2013). As the firing temperature increases, the sound of the specimens becomes metallic. Eventually, they all become metallic by 1300°C, suggesting that they could be used in both local and industrial ceramic industries (tiles, refractory bricks, faience). The absence of a metallic sound indicates that there was no transformation during sintering and illustrates the presence of refractory oxides that have not yet reached their melting temperature (Melo et al., Reference Melo, Kamseu and Djangang2003; Kamseu et al., Reference Kamseu, Leonelli, Boccaccini, Veronesi, Miselli, Giancarlo and Chinje2007).
The bulk density of the fired samples remains slightly less than 2.29 g cm–3, which is in the range generally required for ceramics applications (Karfa, Reference Karfa, Blanchart, Jernot and Gomina2007). Sample AL has the highest bulk density and sample APwf has the lowest bulk density. The slight decrease in bulk density of AL at 1100°C might be attributed to the fact that melting is still at a primary stage. Indeed, when a ceramic pellet contains feldspar, the onset of softening occurs at 750°C and is favoured by the presence of iron, which is a good conductor of heat (Lambercy, Reference Lambercy1993). This is confirmed by the XRD results. However, at 1000°C, all samples had almost the same bulk density, except APwf, which exhibited a lower apparent density. Because little change in the bulk density occurred at this firing temperature, the packing state of APwf was somewhat lower than for the other samples. The slight increase above 1000°C is due to the formation of a glassy phase, which might be attributed to the presence of feldspar (Ca-plagioclase at 62% and microcline at 25%) and the development of mullite (Melo et al., Reference Melo, Kamseu and Djangang2003; Kamseu et al., Reference Kamseu, Leonelli, Boccaccini, Veronesi, Miselli, Giancarlo and Chinje2007).
Linear shrinkage increases as the temperature increases. However, in APws, the linear shrinkage is significantly less than the other samples (0.37–5.00%). This is advantageous for wall tile composition and may be due to the presence of quartz (Swapan et al., Reference Swapan, Kausik, Nar and Ritwik2005). The more quartz there is in a material, the less it will shrink, with adequate densification and strength values (Kamseu et al., Reference Kamseu, Leonelli, Boccaccini, Veronesi, Miselli, Giancarlo and Chinje2007). Linear shrinkage influences the reactivity of a material during firing. Therefore, an increase in linear shrinkage indicates that chemical transformation has taken place in the material. Lemaître et al. (Reference Lemaître, Leonard and Delmon1977) showed that at >1000°C, recrystallization occurred in the fired product by transformation of metakaolinite to mullite or by formation of a spinel phase less than. The presence of kaolinite, confirmed by XRD, is favourable for this reaction. The APws sample displays little linear shrinkage. This may be attributed to its large quartz content (32.4%) in contrast to the other samples.
The rate of water absorption decreases with firing temperature, but remains high for red ceramic bodies. The greatest tendency for this decreasing movement was observed from 1100°C for all samples. This may be due to the presence of a fluxing element that would produce a liquid phase likely to induce low open porosity (Kamseu et al., Reference Kamseu, Leonelli, Boccaccini, Veronesi, Miselli, Giancarlo and Chinje2007; Nzeukou et al., Reference Nzeukou, Traina, Medjo, Kamseu, Njoya, Melo, Kamgang, Cloots and Fagel2014). In applications for red porous bodies (wall tiles at 1120–1180°C; Dondi et al., Reference Dondi, Mariarosa and Chiara2014), fluxes are necessary to reduce these values of water absorption to <10% or <1% (at temperatures <1300°C) for soft porcelain composition (Kamseu et al., Reference Kamseu, Leonelli, Boccaccini, Veronesi, Miselli, Giancarlo and Chinje2007).
The development of flexural strength is mainly influenced by the mullite development or by the flux components, which favour the formation of a vitreous phase and densification, and hence improve the mechanical strength. Flexural strength varies from 0.11 to 6.27 MPa, being maximal in M9 at 1300°C. Below this temperature, the flexural strength value of sample APws is significantly greater (>1 MPa) than those of the other samples. This might be attributed to the higher quartz content of the clay, which decreases the linear shrinkage and provides adequate strength (Kamseu et al., Reference Kamseu, Leonelli, Boccaccini, Veronesi, Miselli, Giancarlo and Chinje2007). The studied samples are suitable for red or light vitrified raw materials for ceramics. Appropriate formulations need to be prepared.
CONCLUSION
Kaolin clays crop out in Mankon, northwest Cameroon. Kaolinite predominates in most of the samples examined (coexisting with halloysite in sample M9), associated with quartz, alunite, anatase and maghemite. The particle sizes of the raw materials consist of sand (24–47%), silt (36–49%) and clay (11–38%). The kaolins have a weak affinity for methylene blue and consequently a low plasticity. The proportion of major oxides may be correlated with the abundance of the minerals present. During ceramic testing, pellets were produced and fired between 1000°C and 1300°C to evaluate their potential for the production of ceramic products made of the kaolin materials. The fired specimens showed variable colour (whitish, light and pink). All pellets displayed an increase in linear shrinkage and bulk density and low flexural strength with increasing temperature. Appropriate formulations need to be prepared in order to assess their behaviour in the production of red or white vitrified firing products.