Introduction
Psychopathy and antisocial personality disorder (ASPD) have been of longstanding interest to researchers and practitioners alike because of the costly toll they exact on society. Given that these disorders share many common features, a crucial question concerns what distinguishes one from the other. This question is currently at the forefront of major developments in diagnostic nosology, with proposed revisions to the upcoming Diagnostic and Statistical Manual of Mental Disorders, fifth edition (DSM-5; APA, 2012) including a ‘callous–unemotional’ variant of child conduct disorder and a revised ASPD diagnosis incorporating better representation of psychopathic features.
Researchers maintain that what distinguishes psychopathy from ASPD is a characteristic set of interpersonal–affective symptoms (Hare et al. Reference Hare, Hart and Harpur1991; Rogers et al. Reference Rogers, Duncan, Lynett and Sewell1994). Besides exhibiting unrestrained, aggressive behavior, psychopaths display features such as glibness, superficial charm, callousness and shallow affectivity (Hare, Reference Hare2003; Patrick et al. Reference Patrick, Fowles and Krueger2009) that are not represented in the current criteria for ASPD. In the dominant clinical assessment instrument for psychopathy, the Psychopathy Checklist – Revised (PCL-R; Hare, Reference Hare2003), these features are encompassed by items associated with PCL-R Factor 1 (Harpur et al. Reference Harpur, Hare and Hakstian1989; Hare et al. Reference Hare, Harpur, Hakstian, Forth, Hart and Newman1990). The presence of such affective–interpersonal traits in conduct-disordered children serves as a crucial predictor of the later development of psychopathy, as distinct from adult antisocial behavior (Frick, Reference Frick1998). In contrast, ASPD is associated predominantly with items indexing the antisocial deviance (Factor 2) component of the PCL-R (Patrick et al. Reference Patrick, Zempolich, Levenston, Raine, Brennan, Farrington and Mednick1997).
Further, there is increasing evidence for separate neurobiological underpinnings to these psychopathy-specific features, distinct from those associated with general antisocial–externalizing tendencies (Patrick & Bernat, Reference Patrick, Bernat, Berntson and Cacioppo2009). While both disorders are marked by dysfunction in the frontal regions of the brain necessary for impulse control, executive function and planning, brain structures implicated in the processing of fear (e.g. amygdala) appear aberrant in psychopathic individuals, and not in individuals with ASPD (Blair, Reference Blair2003). The current study sought to extend understanding of these high-impact disorders by examining, for the first time, differential relations of psychopathy and ASPD with brain reactivity to aversive noise probes occurring in isolation or in the context of visual foreground processing. Specifically, the noise probe-elicited P300 response (‘probe P3’; Roth et al. Reference Roth, Dorato and Kopell1984; Schupp et al. Reference Schupp, Cuthbert, Bradley, Birbaumer and Lang1997) – an event-related potential (ERP) component that occurs in relation to sudden, startling acoustic stimuli – was examined during and in between presentations of affective and neutral pictures in a large sample of incarcerated males assessed for these disorders.
The probe P3 has typically been measured in relation to abrupt noise probes presented to subjects during the processing of visual foregrounds. The occurrence of an unexpected intense noise evokes a rapid-onset startle reflex that functions to interrupt ongoing cognitive–behavioral processing and reorient the individual toward the intrusive event (Graham, Reference Graham, Kimmel, van Olst and Orlebeke1979; Herbert et al. Reference Herbert, Kissler, Junghöfer, Peyk and Rockstroh2006). The probe P3 is a cortical response following the initial startle reflex that indexes the extent to which the individual attends to and ascribes meaning to the aversive noise probe following its initial interruptive impact (Lang et al. Reference Lang, Bradley and Cuthbert1992).Footnote 1Footnote † In this sense, the probe P3 response reflects a cortical ‘call to arms’ (Graham, Reference Graham, Kimmel, van Olst and Orlebeke1979; Herbert et al. Reference Herbert, Kissler, Junghöfer, Peyk and Rockstroh2006) – an index of the brain's dedication of resources toward processing and coping with the unexpected event. Recent research indicates that activity underlying the probe P3 originates from fronto-central regions of the cortex and the temporoparietal junction (Keil et al. Reference Keil, Bradley, Junghöfer, Russmann, Lowenthal and Lang2007) – brain regions associated with action orientation (Hauk & Pulvermüller, Reference Hauk and Pulvermüller2004) and empathy/morality (Decety & Lamm, Reference Decety and Lamm2007). Since psychopaths have been described as deficient in normal affective reactions including empathy and fear, the probe P3 response could serve as a valuable index of emotional reactivity deficits underlying this disorder. Further, to the extent that probe P3 is modulated by attentional engagement with foreground stimuli, this response may be helpful for evaluating hypotheses regarding attentional versus emotional dysfunction in psychopaths (Newman et al. Reference Newman, Schmitt and Voss1997).
The current study examined P3 reactivity to aversive noise probes within a picture-viewing task in prisoners assessed for psychopathy and ASPD, in order to test for affective reactivity and attentional processing differences between the two disorders. Two aspects of probe P3 response were examined. The first was the general amplitude of the P3 response to noise probes, measured during intertrial intervals (ITIs) when no picture was present (i.e. as an index of baseline reactivity) and during picture-viewing trials (i.e. as an index of reactivity during visual foreground processing). Inasmuch as the P3 response to auditory events is presumed to reflect processes of stimulus evaluation and cognitive analysis of informational aspects of the stimulus (Lovrich et al. Reference Lovrich, Novick and Vaughan1988), amplitude of the P3 to noise probes indexes the degree to which the brain continues to process the noise as a meaningful event following initial perceptual registration of the noise stimulus (Graham, Reference Graham, Kimmel, van Olst and Orlebeke1979; Herbert & Kissler, Reference Herbert and Kissler2010). Given the intense, unexpected nature of the noise-probe stimulus, probe P3 amplitude can be viewed as indexing allocation of cognitive resources for purposes of ascertaining the need for sustained defensive mobilization (Herbert et al. Reference Herbert, Kissler, Junghöfer, Peyk and Rockstroh2006; Czigler et al. Reference Czigler, Cox, Gyimesi and Horváth2007).
The P3 response in more standard cognitive processing (e.g. oddball) tasks shows reliable reductions in relation to disinhibitory disorders generally (Iacono et al. Reference Iacono, Carlson, Malone and McGue2002; Patrick et al. Reference Patrick, Bernat, Malone, Iacono, Krueger and McGue2006), including ASPD (Bauer et al. Reference Bauer, O'Connor and Hesselbrock1994; O'Connor et al. Reference O'Connor, Bauer, Tasman and Hesselbrock1994). Findings for cognitive-task P3 in psychopathy have been more mixed, with some older studies reporting enhanced amplitude in psychopathic offenders (see Raine, Reference Raine1993) and more recent studies reporting reduced amplitude in PCL-R defined psychopaths (e.g. Kiehl et al. Reference Kiehl, Hare, Liddle and McDonald1999, Reference Kiehl, Bates, Laurens, Hare and Liddle2006). By contrast, the noise-probe P3 has emerged as a focus of study more recently, and thus limited data are available regarding its individual difference correlates. The one individual difference study that has been reported to date (Drislane et al. Reference Drislane, Lucy, Yancey, Vaidyanathan and Patrick2011) found enhanced overall probe P3 amplitude in a picture viewing task among adult participants scoring high as compared with low on a measure of dispositional fear. Notably, the measure of dispositional fear/fearlessness in this study (see Kramer et al. Reference Kramer, Patrick, Krueger and Gasperi2012; see also Vizueta et al. Reference Vizueta, Patrick, Jiang, Thomas and He2012) consisted of items from existing fear scales and affective–interpersonal items from the Psychopathic Personality Inventory (Lilienfeld & Andrews, Reference Lilienfeld and Andrews1996) reflecting fearlessness (Benning et al. Reference Benning, Patrick, Hicks, Blonigen and Krueger2003, Reference Benning, Patrick and Iacono2005).
The second aspect of P3 we examined was modulation of the response as a function of foreground stimulus meaningfulness or significance. Prior studies with normal adult participants have revealed a diminished amplitude of probe P3 response to noise probes occurring during viewing of either pleasant or unpleasant pictures as compared with neutral pictures (Cuthbert et al. Reference Cuthbert, Schupp, Bradley, McManis and Lang1998). In neural terms, this quadratic modulation pattern reflects enhanced allocation of cortical processing resources to foreground stimuli that are attentionally engaging – resulting in diminished availability of resources to process intervening noise probes (Lang et al. Reference Lang, Bradley, Cuthbert, Lang, Simons and Balaban1997; Cuthbert et al. Reference Cuthbert, Schupp, Bradley, McManis and Lang1998). This modulatory effect on probe P3 provides an index of the degree to which greater versus lesser engagement due to visual foreground salience moderates cortical–elaborative processing of the aversive probe stimulus.
Our major hypothesis, based on prior evidence indicating that psychopathy is distinguished from ASPD by diminished sensitivity to aversive events (Patrick et al. Reference Patrick, Bradley and Lang1993; Blair et al. Reference Blair, Jones, Clark and Smith1997), and evidence for enhanced probe P3 amplitude in relation to dispositional fear (Drislane et al. Reference Drislane, Lucy, Yancey, Vaidyanathan and Patrick2011), was that individuals diagnosed as psychopathic would show generally reduced amplitude of probe P3 response – reflecting diminished cortical post-processing of noise-probe stimuli (i.e. reduced cortical ‘call to arms’) relative to non-psychopaths. In contrast, participants diagnosed with ASPD were not expected to demonstrate this deficit. As a corollary, based on evidence linking emotional deficits in psychopathy to the core interpersonal–affective features of the disorder (Blair, Reference Blair2001; Blonigen et al. Reference Blonigen, Hicks, Krueger, Patrick and Iacono2005; Patrick & Bernat, Reference Patrick, Bernat, Berntson and Cacioppo2009; Vaidyanathan et al. Reference Vaidyanathan, Hall, Patrick and Bernat2011), we hypothesized that scores on Factor 1 of the PCL-R – rather than Factor 2, which is more closely associated with ASPD (Harpur et al. Reference Harpur, Hare and Hakstian1989; Hare et al. Reference Hare, Harpur, Hakstian, Forth, Hart and Newman1990, Reference Hare, Hart and Harpur1991) – would account for psychopathy-related reductions in probe P3 amplitude.
In evaluating these specific hypotheses, the current design enabled us to assess for psychopathy- and ASPD-related differences in allocation of attention to foreground stimuli through two condition contrasts: (1) comparison of probe P3 amplitude during neutral pictures as compared with no-picture (intertrial) intervals; and (2) comparison of probe P3 amplitude during viewing of affective (pleasant, unpleasant) as compared with neutral pictures. The first of these contrasts permitted evaluation of whether the predicted diminution in overall probe P3 response might reflect a psychopathy-related deficit in the ability to process noise probes specifically during competing picture-foreground engagement (e.g. per the response modulation hypothesis of Newman et al. Reference Newman, Schmitt and Voss1997), as opposed to a general deficit in post-processing of probes attributable to weak defensive (fear) reactivity. The second contrast enabled us to evaluate whether psychopathy-related diminution of probe P3 during picture-viewing might reflect overcommitment of attentional resources to the processing of affective scenes in particular – in which case, psychopathic participants would be expected to show exaggerated probe P3 inhibition for affective versus neutral pictures.
Method
Participants
Participants were 143 male prisoners recruited from a state prison in Minnesota who received $20, deposited to their institutional accounts, for participating. The mean age of participants was 32.31 years (s.d. = 8.68, range = 19–59). With regard to race, the majority of inmates were Caucasian (56.9%), African American (28.5%) and Hispanic (9.0%), with the remaining 5.6% of other or mixed race. Following a detailed description of the study procedures, written informed consent was obtained. A pre-test questionnaire was administered to screen for the presence of visual or hearing impairments, which were the only exclusionary criteria employed in the study. Data for three participants were dropped due to equipment malfunction.
The study was approved by the Institutional Review Board of the University of Minnesota, and by the Research Review Committee of the Minnesota Department of Corrections.
Measures
Psychopathy Checklist – Revised
Subjects were assigned scores on the PCL-R using information from a semi-structured interview and prison file records. Primary diagnostic ratings were assigned by the interviewer. Secondary ratings were provided by an independent diagnostician who reviewed a video recording of the diagnostic interview and file information. Inter-rater reliability for PCL-R scores was very high (Cronbach's α = 0.98, 0.94 and 0.95 for PCL-R total, Factor 1 and Factor 2 scores, respectively). PCL-R total and factor scores for the two raters were averaged for each participant. Overall sample means for PCL-R total, Factor 1 and Factor 2 scores were 25.62, 9.62 and 12.46, respectively (s.d. =7.73, 3.59 and 3.74). Consistent with prior research, scores on PCL-R Factors 1 and 2 were moderately correlated (r = 0.59). For analyses of psychopathy groups (see below), subjects with overall PCL-R scores ⩾30 (n = 49) were classified as psychopathic and those with overall scores ⩽20 (n = 29) were classified as non-psychopathic (Hare, Reference Hare2003).
ASPD
Subjects were also assessed for child and adult symptoms of ASPD using interview questions patterned after relevant items from the Structured Clinical Interview for DSM-IV Axis II Personality Disorders (SCID-II; First et al. Reference First, Spitzer, Williams and Gibbon1997), in conjunction with collateral information from prison file records. Primary diagnostic ratings for ASPD were assigned by the interviewer, and secondary ratings were assigned by an independent diagnostician. A participant was considered to have met criteria for the diagnosis if both independent raters assigned a diagnosis of ASPD. Inter-rater reliability for ASPD diagnoses as indexed by the κ statistic was 0.78. One subject could not be diagnosed due to missing diagnostic information from one rater, leading to a total of 139 subjects assessed for ASPD. A total of 91 participants were diagnosed with ASPD, whereas 48 were not. Of the 91 participants diagnosed with ASPD, 46 also met criteria for a diagnosis of psychopathy. Only three of the inmates diagnosed as psychopathic did not meet criteria for ASPD.
Procedure
Picture stimuli consisted of 66 digitized scenes from the International Affective Picture System (IAPS; Lang et al. Reference Lang, Bradley and Cuthbert1999), presented for 6 s each. Noise probes were 50-ms, 105-dB white-noise bursts with abrupt (<10 μs) rise time, generated by an S81-02 Coulbourn white noise generator, and presented binaurally through insert earphones (Etymotic Research Inc., USA). Habituation probes (excluded from analyses) were presented during the first three pictures of the task (Bradley et al. Reference Bradley, Lang and Cuthbert1993). During 54 of the remaining 63 picture trials, noise probes occurred between 3 and 5 s after picture onset. To provide a no-picture comparison and to reduce predictability of the probe stimuli, nine additional noise probes were presented during intervals between picture stimuli.
The 54 probed pictures consisted of 18 pleasant, 18 neutral and 18 unpleasant IAPS scenes.Footnote 2 Pleasant pictures included erotic and action/adventure scenes (e.g. bungee-jumping, skydiving); unpleasant pictures included direct-threat scenes (e.g. aimed weapons, menacing figures) and victim (vicarious attack) scenes. Neutral scenes depicted innocuous people, buildings, kitchen utensils and other common objects (e.g. truck, fire hydrant). Pleasant and unpleasant picture sets were selected to be equivalent in average rated arousal according to IAPS norms (Lang et al. Reference Lang, Greenwald, Bradley and Hamm1993), and comparably more arousing than neutral pictures.
A total of 12 slide presentation orders were used. Within and between orders, pictures and noise probes were counterbalanced such that valence categories (pleasant, neutral, unpleasant) were represented equally across orders at each serial position, with the following constraints: no more than two slides of the same valence occurred consecutively within any stimulus order; pictures of the same content category never appeared consecutively or across orders; and pictures were rotated so as to serve in both probed and unprobed trials.
Physiological data acquisition and reduction
Pictures were viewed at a distance of 100 cm on a 52-cm computer monitor positioned at eye level. Data collection was performed using two computers configured with E-Prime software (MEL Inc., USA) for stimulus control and SCAN software (Neuroscan, Inc., USA) for physiological data acquisition.
Electroencephalographic (EEG) scalp potentials were recorded from multiple scalp sites using a Neuroscan 32-channel Quick-Cap system. Data were collected at a sampling rate of 2000 Hz with an online analog band pass filter of 0.05–500 Hz. EEG signal activity was referenced offline to the average of left and right mastoid electrodes. Following referencing, epochs from −500 ms to 1000 ms were extracted from the continuous recordings using Neuroscan EDIT software and corrected algorithmically for eye movements (Semlitsch et al. Reference Semlitsch, Anderer, Schuster and Presslich1986). The epoched and corrected EEG data were exported to Matlab (Mathworks, Inc., USA) for subsequent data processing. After applying a 5 Hz high-pass third-order Butterworth filter to reduce low frequency artifacts, the data were down-sampled to 256 Hz. Trials in which EEG activity exceeded ±100 μV, relative to a 500-ms pre-probe baseline, were excluded from further processing. Across participants, 1.83% of total trials were excluded due to artifacts.
Consistent with prior work (Schupp et al. Reference Schupp, Cuthbert, Bradley, Hillman, Hamm and Lang2004), analyses focused on the P3 component of the probe-elicited ERP measured at electrode site Pz, the site at which probe P3 occurs with maximal amplitude. The P3 response was coded from the average EEG waveform for each condition as the maximum positive deflection (from pre-probe baseline) evident between 250 and 450 ms following the onset of the probe stimulus.
Data analysis
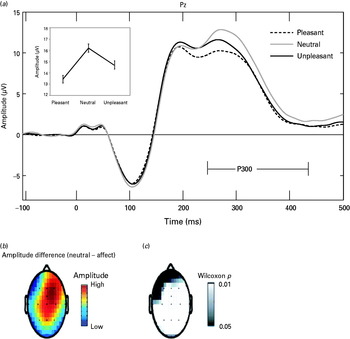
An initial analysis was performed to evaluate modulatory effects of picture foregrounds on probe P3 amplitude in the sample as a whole. To test for a modulatory effect of foreground attention in relation to picture valence, a one-way repeated-measures analysis of variance (ANOVA) was performed in which probe P3 amplitude at electrode site Pz was compared across viewing of each picture category (pleasant, neutral, unpleasant). Following prior work (Cuthbert et al. Reference Cuthbert, Schupp, Bradley, McManis and Lang1998), the predicted diminution in probe P3 during viewing of affective scenes as compared with neutral was evaluated as a quadratic trend contrast (i.e. average of pleasant/unpleasant against neutral). This contrast was predicted to be highly significant (Schupp et al. Reference Schupp, Cuthbert, Bradley, Birbaumer and Lang1997; Cuthbert et al. Reference Cuthbert, Schupp, Bradley, McManis and Lang1998). Scalp topography plots (‘head maps’; see Fig. 1) are provided as a supplement to the primary analysis of P3 at electrode Pz, in order to illustrate the distribution and significance of this effect across differing recording sites.
(a) Average event-related potential (ERP) waveforms for participants as a whole at electrode site Pz for noise probes presented during pictures of differing types (pleasant, neutral, unpleasant). Inset line plot depicts mean probe P3 amplitude (defined as peak of waveform between 250 and 450 ms) for pictures of these three types. (b) Color topographic plot (‘head map’) depicts relative magnitude of the neutral minus affective (pleasant/unpleasant) difference for probe P3 amplitude at varying scalp recording sites. (c) Grayscale topographic plot depicts scalp sites at which statistically significant (p < 0.05) differences in probe P3 amplitude were observed for affective (pleasant/unpleasant) as compared with neutral pictures. From these topographic plots, it can be seen that the inhibition of probe P3 response for affective versus neutral pictures was maximal at central-parietal scalp locations, and somewhat right-lateralized.

Following these analyses for the overall study sample, effects of diagnostic group were evaluated using a series of two-way (group × picture category) ANOVAs, with group (APSD/non-ASPD, or psychopath/non-psychopath) serving as a between-subjects factor, and foreground condition (ITI v. neutral picture, or pleasant/unpleasant picture v. neutral picture) as a within-subjects factor. To test for possible interactive effects of psychopathy and ASPD diagnoses on probe P3 amplitude, the two diagnoses were entered concurrently as binary (present v. absent) between-subject factors in a supplemental ANOVA evaluating probe P3 amplitude across pleasant, neutral and unpleasant picture categories. In addition to the ANOVAs for extreme PCL-R groups (psychopath, non-psychopath), effects for the two distinct factors of the PCL-R were evaluated through correlational analyses utilizing continuous Factor 1 and 2 scores as predictors of probe P3 summary scores reflecting either general amplitude of P3 response, or degree of foreground-attentional modulation of response. As indices of general response, we utilized mean amplitude of P3 during ITI trials, and mean across all picture trials. As indices of foreground-attentional modulation of probe P3, we examined: (1) average P3 amplitude during ITI trials minus average during neutral scenes and (2) average P3 during neutral scenes minus average for pleasant and unpleasant scenes.
Results
Overall sample: effects of picture condition on probe P3
Replicating prior findings with non-incarcerated samples, a one-way ANOVA revealed highly significant modulation of P3 response as a function of picture condition in the overall prisoner sample (omnibus F 2,278 = 37.21, p < 0.001), with amplitude markedly reduced during viewing of pleasant and unpleasant pictures compared with neutral (quadratic contrast F 1,139 = 58.49, p < 0.001; see Fig. 1).Footnote 3
Diagnostic groups: effects of ASPD and psychopathy on probe P3
In the two-way ANOVA evaluating ASPD group effects for neutral-picture and ITI trials, no main effect of group on probe P3 amplitude was evident (F 1,137 = 0.33, p = 0.57). The ASPD group × ITI/neutral-picture interaction was likewise non-significant (F 1,137 = 0.03, p = 0.87). In the counterpart analysis examining group effects for differing picture categories, neither the main effect of ASPD group nor the group × picture category interaction emerged as significant (F 1,137 = 0.34, p = 0.56 and F 2,274 = 0.99, p = 0.37), though the aforementioned main effect of picture category on probe P3 amplitude was clearly evident (omnibus F 2,274 = 30.58, p < 0.001; quadratic contrast F 1,137 = 50.16, p < 0.001). The results of these analyses indicate no differences in probe P3 reactivity or modulation for subjects with versus without ASPD.
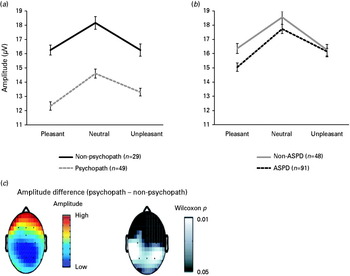
In the two-way ANOVA evaluating psychopathy group effects for neutral-picture and ITI trials, the main effect of group approached significance (F 1,76 = 3.79, p = 0.055), reflecting a trend toward diminished probe P3 amplitude across the two trial conditions for psychopathic as compared with non-psychopathic participants. The group × ITI/neutral-picture interaction was negligible (F 1,76 = 1.56, p > 0.2), indicating no group difference in comparative response to ITI versus neutral-picture probes. In the analysis of group effects for pictures of differing types, the main effect of psychopathy group emerged as significant (F 1,76 = 4.53, p < 0.05), reflecting reduced amplitude of P3 response to probe stimuli across pictures as a whole in psychopathic as compared with non-psychopathic subjects. However, the group × picture category interaction was not significant (F 2,152 = 0.37, p = 0.69), indicating no difference in degree of P3 amplitude reduction during viewing of affective versus neutral scenes in psychopaths as compared with non-psychopaths (see Fig. 2). Together, these analyses demonstrate decreased P3 reactivity to noise probes in general (i.e. across all trial types), but intact foreground-attentional modulation of probe P3 response (i.e. for affectively engaging as compared with neutral scenes), in psychopathic participants.
Average probe P3 amplitude at electrode site Pz, by picture category (pleasant, neutral, unpleasant), for psychopathy groups [psychopathic, Psychopathy Checklist – Revised (PCL-R) total score ⩾30; non-psychopathic, PCL-R total score ⩽20] (a) and antisocial personality disorder (ASPD) groups (b). Error bars reflect standard errors for specific picture means (pleasant, neutral, unpleasant) within each participant group. A main effect was evident for psychopathy group (psychopath < non-psychopath) (F 1,76 = 4.53, p < 0.05), but not for ASPD group. (c) Color topographic plot (‘head map’) depicts relative magnitude of overall probe P3 amplitude at varying scalp recording sites for psychopaths versus non-psychopaths. Grayscale topographic plot depicts scalp sites at which statistically significant (p < 0.05) differences in probe P3 amplitude were observed in psychopaths as compared with non-psychopaths. From these topographic plots, it can be seen that the amplitude reduction in probe P3 response for psychopaths as compared with non-psychopaths was maximal at parietal scalp locations.

In the supplemental ANOVA incorporating both psychopathy and ASPD diagnosis (present v. absent) as between-subject factors, the interaction between psychopathy and ASPD diagnoses was not significant (F 1,74 = 0.09, p = 0.77). The main effect of ASPD group was also negligible (F 1,74 = 1.42, p = 0.25); however, the main effect of psychopathy group emerged as significant (F 1,74 = 4.86, p < 0.05). Neither of the group (psychopathy, or ASPD) × picture category interactions was significant, nor was the three-way (ASPD × psychopathy × picture category) interaction (p's >0.40). These results indicate that reduced overall amplitude of probe P3 response is specific to psychopathy and does not depend on the presence versus absence of co-morbid ASPD.
PCL-R psychopathy factors and probe P3
For ITI-probe trials and picture-probe trials as a whole, the correlation between probe P3 amplitude and continuous scores on PCL-R Factor 1 was significant and negative (r's = –0.23 and −0.26, respectively, p's = 0.007 and 0.002). By contrast, corresponding correlations between general P3 amplitude and continuous scores on PCL-R Factor 2 were weak and non-significant, (r's = –0.11 and −0.11, respectively, p's = 0.21 and 0.21). These findings indicate that the observed reduction in general P3 amplitude for psychopathic as compared with non-psychopathic participants was attributable primarily to the affective–interpersonal features embodied in PCL-R Factor 1.
For the difference-score variable indexing probe P3 modulation for neutral scenes relative to ITI trials (i.e. average amplitude during ITIs minus average during neutral pictures), neither PCL-R factor evidenced significant prediction (r's for Factors 1 and 2 = 0.05 and −0.07, respectively, p's = 0.59 and 0.40). Similarly, for the difference-score variable indexing modulation for affective scenes relative to neutral (i.e. average amplitude during neutral pictures minus average during pleasant and unpleasant pictures), neither factor evidenced significant prediction (r's = –0.02 and 0.02, respectively, p's = 0.78 and 0.78). This latter finding indicates that participants scoring high on Factor 1 of the PCL-R, while exhibiting overall diminished P3 response to the noise-probe stimulus, showed comparable foreground-attentional modulation of probe P3 as a function of picture content.
Discussion
The findings of the present study demonstrate that offenders diagnosed with psychopathy show diminished cortical orienting to abrupt noxious stimuli, as indexed by diminished probe P3 reactivity to unwarned noise bursts occurring within or between picture-viewing intervals; in contrast, those diagnosed with ASPD do not evince this effect. Our results provide evidence for reduced evaluative post-processing of aversive noise probes in psychopathic individuals – that is, a reduction in the normal cortical ‘call to arms’ instigated by intense sensory events of an unexpected nature (Graham, Reference Graham, Kimmel, van Olst and Orlebeke1979; Herbert et al. Reference Herbert, Kissler, Junghöfer, Peyk and Rockstroh2006). In the context of this overall reduction in probe P3 response, psychopathic participants showed the expected relative decrement in probe P3 during viewing of affective as compared with neutral pictures, interpretable as increased allocation of attentional resources to more engaging perceptual foregrounds (Lang et al. Reference Lang, Bradley, Cuthbert, Lang, Simons and Balaban1997; Cuthbert et al. Reference Cuthbert, Schupp, Bradley, McManis and Lang1998).
The finding that psychopathic participants did not differ from non-psychopathic participants in relative amplitude of probe P3 during neutral-picture trials as compared with no-picture (ITI) trials argues against a ‘foreground attentional focus’ explanation of the reduction in probe P3 for these participants during picture-viewing trials as a whole (i.e. an inability to shift attention toward the intervening probe stimulus once attention was engaged by foreground picture stimuli; see Newman et al. Reference Newman, Schmitt and Voss1997). If reduced probe P3 in these participants were attributable to this sort of attentional anomaly, more pronounced inhibition of P3 would have been observed for probes occurring during neutral pictures as compared with ITIs. Moreover, the finding of normal inhibition of probe P3 during affective as compared with neutral pictures in psychopathic participants indicates that the observed attenuation of probe P3 amplitude for these participants occurred separately from alterations in attention–allocation related to differences in the saliency of visual foregrounds. That is, the observed reduction in cortical post-processing was not dependent on the degree of attention devoted to processing of picture stimuli, which exerted a separate effect on probe P3 amplitude, unrelated to psychopathy status.
A further important finding was that the overall reduction in probe P3 response was attributable specifically to the affective–interpersonal (Factor 1) component of PCL-R psychopathy. This adds to a growing body of data establishing the centrality of affective–interpersonal traits for distinguishing psychopathy from other forms of externalizing psychopathology – including child conduct disorder and adult antisocial personality (Frick, Reference Frick1998; Blair, Reference Blair2001; Blonigen et al. Reference Blonigen, Hicks, Krueger, Patrick and Iacono2005; Viding et al. Reference Viding, Blair, Moffitt and Plomin2005; Patrick & Bernat, Reference Patrick, Bernat, Berntson and Cacioppo2009; Vaidyanathan et al. Reference Vaidyanathan, Hall, Patrick and Bernat2011). Whereas other externalizing disorders typically entail heightened negative emotionality (Blonigen et al. Reference Blonigen, Hicks, Krueger, Patrick and Iacono2005; Patrick & Bernat, Reference Patrick, Bernat, Berntson and Cacioppo2009; Patrick et al. Reference Patrick, Fowles and Krueger2009), psychopathy is reliably associated with deficits in emotional processing and reactivity as indexed by physiological measures of differing types across a range of tasks. For example, psychopaths exhibit deficient fear as evidenced by an absence or attenuation of fear-potentiated startle, in contrast with ASPD-diagnosed individuals who exhibit normal potentiation of startle during aversive cuing (Vaidyanathan et al. Reference Vaidyanathan, Hall, Patrick and Bernat2011). As with the reduction in probe P3 reported here, the deficit in aversive startle potentiation has been linked specifically to the affective–interpersonal component of psychopathy (Patrick et al. Reference Patrick, Bradley and Lang1993; Patrick, Reference Patrick1994; Vaidyanathan et al. Reference Vaidyanathan, Hall, Patrick and Bernat2011).Footnote 4 Similarly, research indicates that individuals high in core psychopathic features display reduced electrodermal reactivity to distress cues (Blair et al. Reference Blair, Jones, Clark and Smith1997) and during anticipation of stressors (Hare, Reference Hare, Hare and Schalling1978; Dindo & Fowles, Reference Dindo and Fowles2011) along with reduced amygdala reactivity to fear-relevant stimuli (Marsh et al. Reference Marsh, Finger, Mitchell, Reid, Sims, Kosson, Towbin, Leibenluft, Pine and Blair2008). The present study, however, is the first to demonstrate reduced amplitude of mid-latency cortical response to abrupt, noxious-probe stimuli in offenders exhibiting these core psychopathic features.
This reduction in noise-probe P3 in relation to affective–interpersonal features of psychopathy can be contrasted with reductions in target stimulus P3 in more standard cognitive (e.g. oddball) tasks observed for individuals exhibiting ASPD (Bauer et al. Reference Bauer, O'Connor and Hesselbrock1994; O'Connor et al. Reference O'Connor, Bauer, Tasman and Hesselbrock1994) and other externalizing disorders (Iacono et al. Reference Iacono, Carlson, Malone and McGue2002; Patrick et al. Reference Patrick, Bernat, Malone, Iacono, Krueger and McGue2006), and for high-psychopathic individuals in some studies (e.g. Kiehl et al. Reference Kiehl, Hare, Liddle and McDonald1999, Reference Kiehl, Bates, Laurens, Hare and Liddle2006). Extrapolating from the findings for P3 and externalizing and the close connection between externalizing proneness and psychopathy factor 2 (Patrick et al. 2005), Gao & Raine (2009) hypothesized that the reduced cognitive-task P3 for psychopathy in some studies is probably attributable to Factor 2 as opposed to Factor 1 features. Although further work is needed to effectively evaluate this hypothesis, some evidence has emerged recently to support it (Carlson et al. Reference Carlson, Thái and McLarnon2009; Venables et al. Reference Venables, Patrick, Hohman, Tennenbaum and Bernat2010). Integrating these results with current findings, it appears likely that differing processes underlie the P3 response to abrupt startling noises in the context of picture viewing compared with P3 to infrequent stimuli in a standard oddball task. Recent research demonstrating enhanced amplitude of probe P3 during picture viewing in high- v. low-fear adults (Drislane et al. Reference Drislane, Lucy, Yancey, Vaidyanathan and Patrick2011) points to a distinct component of dispositional fear, entailing sensitivity to the occurrence of intense unexpected events, contributing to noise-probe P3 amplitude.
Considered together with prior published work, the current findings indicate that along with deficits in impulse control that occur also in ASPD, psychopathy is specifically characterized by impaired reactivity of the brain's defensive motivational system (Patrick, Reference Patrick1994; Patrick & Bernat, Reference Patrick, Bernat, Berntson and Cacioppo2009). In turn, observed differences in neurobiological correlates of psychopathy and ASPD suggest crucial differences in the nature and etiology of these disorders, with important implications for psychiatric nosology. In particular, the current results lend support to proposals for greater consideration of psychopathic features in the diagnosis of ASPD and a ‘callous–unemotional’ variant of conduct disorder in DSM-5. While traditional descriptions of these disorders focus predominantly on aggressive externalizing tendencies, increasing evidence points to the existence of a distinct subgroup of antisocial individuals for whom affective–interpersonal traits including indomitability, callousness and low dispositional fear are integral to manifest behavioral pathology.
Acknowledgements
We are grateful to the residents of Minnesota Correctional Facility – Lino Lakes for their participation, the officials and staff of the facility for their support of the project, and the Minnesota Department of Corrections for authorizing this research. In addition, we thank Noah Venables for his role in coordinating this project and his scholarly input on this article, Jason Hall, Marianna Bayevsky, Dan Blonigen, Meredith Cadwallader, Brian Hicks, Ben Steffen, Noah Venables and Melinda Ward for their assistance with data collection, and Edward Bernat for his assistance with data processing and preliminary analyses.
This research was supported by grants no. MH52384, MH65137, MH072850 and MH089727 from the National Institute of Mental Health.
Declaration of Interest
None.