Introduction
Since the discovery of ferroelectricity in Rochelle salt nearly a century ago, ferroelectrics have transitioned from an academic curiosity to serious contenders in the fields of nonvolatile memory devices, actuators for microelectromechanical systems (MEMS) devices, mechanical energy conversion, and many other applications at the forefront of modern science.[Reference Scott1–Reference Wang3] Although research on ferroelectrics remains primarily confined to the realm of epitaxial thin films, new methods for the synthesis, processing, and integration of ferroelectric nanomaterials in zero and one-dimensional forms is poised to reinvigorate research on both the applications and fundamental science of ferroelectric materials. The last decade has witnessed the rapid development of new synthetic pathways to low-dimensional ferroelectric nanomaterials, and these synthetic developments have both transformed our understanding of the fundamental physics of nanoscale ferroelectricity and spawned tantalizing new applications in solar energy conversion,[Reference Yang, Seidel, Byrnes, Shafer, Yang, Rossell, Yu, Chu, Scott, Ager, Martin and Ramesh4] biosensing,[Reference Nguyen, Deshmukh, Nagarah, Kramer, Purohit, Berry and McAlpine5] and many other areas. In this review, we summarize these recent achievements related to the synthesis, physics, and applications of these nanomaterials. In addition, we highlight areas in which the concurrent development of powerful new characterization tools, new synthetic pathways offering improved material control, and an improved base of fundamental understanding offer new opportunities to address longstanding questions within the field.
An introduction to ferroelectrics
Prior to reviewing recent developments in the field of ferroelectric nanomaterials, we shall begin with a brief overview of the basic properties of ferroelectrics for the unfamiliar reader. As the dielectric analog of more familiar ferromagnetic materials, ferroelectrics possess many of the basic characteristics of the latter class of materials, including an order parameter with multiple stable states, hysteresis during cycling between these states, and the formation of domain structures (Fig. 1). In analogy with ferromagnets, which exhibit a permanent magnetic moment that may be reoriented with a sufficiently strong magnetic field, the order parameter in ferroelectrics is a spontaneous electrical polarization that can be similarly reoriented under a sufficiently strong electric field.[Reference Kittel6–Reference Lines and Glass8] Different spatial orientations of the spontaneous polarization, as with ferromagnets, give rise to domain structures. To understand the origin of this spontaneous polarization, we turn to the archetypal inorganic ferroelectric, BaTiO3. As the material is cooled below a critical temperature, known as the Curie temperature in analogy with ferromagnets, the originally cubic crystal undergoes a spontaneous symmetry-breaking distortion to a tetragonal phase through the relative displacement of the Ti ionic sublattice with respect to the negatively charged oxygen sublattice, leading to the separation of the centers of negative and positive charge in the unit cell and an electric dipole moment (Fig. 1). The alignment of many of these dipole moments across an entire crystal, like the coherent alignment of electronic spins in a ferromagnet, leads to a net, macroscopic polarization. In some cases, the orientation of this spontaneous dipole moment can be reversed by application of an electric field without inducing dielectric breakdown. We term these crystals ferroelectric, and we label those crystals with a spontaneous polarization that cannot be reoriented as pyroelectric. These two classes of materials, which we refer to as polar materials, are the focus of this review. The utility of these materials arises not only from the existence of multiple stable polarization states, but also from the fact that all pyroelectric crystals are necessarily piezoelectric by symmetry, allowing for interconversion of mechanical and electrical impulses.
The vast majority of common ferroelectrics are complex oxide materials, and most of these are based on the perovskite structure, defined by the general formula ABO3, and, in many cases, a small symmetry-breaking distortion from a cubic phase.[Reference Rabe, Ahn and Triscone7] Many other classes of ferroelectrics exist, however, including semiconductors such as GeTe and SbSI and hydrogen-bonded materials such as potassium dihydrogen phosphate (KDP).[Reference Lines and Glass8] In addition, in materials with a magnetic sublattice such as BiFeO3 and YMnO3, ferroelectric ordering may be accompanied by ferromagnetic ordering, in many cases leading to magnetoelectric coupling between the order parameters.[Reference Rabe, Ahn and Triscone7] The discovery of new ferroelectrics remains an active area of research, and these new semiconducting and multiferroic materials continue to push the frontiers of ferroelectricity in the present day.
An introduction to the basics of ferroelectricity. (a) Unit cell of the prototypical perovskite ferroelectric BaTiO3 above (left) and below (right) the Curie temperature (T c). The tetragonal distortion and displacement of the Ti cations (red arrow) below T c result in a separation of the centers of negative and positive charge, leading to a spontaneous electric dipole moment. Alignment of these dipole moments across an entire crystal leads to a net macroscopic spontaneous polarization. (b) Schematic illustration of the domain structure of a ferroelectric material. Domains with the same polarization orientation (red arrows) form to minimize electrostatic energy, similar to the formation of ferromagnetic domains. (c) Polarization switching in a ferroelectric. Cycling of the electric field results in switching of the direction of the spontaneous polarization and a characteristic hysteresis loop resembling the magnetization-magnetic field hysteresis loops of ferromagnetic materials.

Synthesis of ferroelectric nanomaterials
The last three decades have featured an explosion in the development of both zero and one-dimensional nanostructures.[Reference Murray, Kagan and Bawendi9, Reference Law, Goldberger and Yang10] The vapor–liquid–solid (VLS) growth scheme, colloidal chemistry, and hydro/solvothermal techniques have exhibited particular versatility. Despite the considerable successes of these methods for a broad range of materials, quality syntheses of ferroelectric nanomaterials have been noticeably lacking in the literature, and most of the successes have been confined to a single material, BaTiO3. This dearth of literature is curious given the rapidly increasing interest in ferroelectrics and related polar materials such as multiferroics, and is rendered still more curious by the success of both vapor and solution-based techniques in the synthesis of complex oxides with other functionalities, including the magnetic spinel ferrites.[Reference Sun, Zeng, Robinson, Raoux, Rice, Wang and Li11] In this section, we shall examine progress in the synthesis of ferroelectric nanomaterials using colloidal chemistry, hydrothermal and solvothermal methods, and an aqueous/organic two-phase approach that is beginning to yield exciting results. We will also examine the prospects for vapor-phase growth of one-dimensional nanostructures and future challenges in ferroelectric nanomaterial synthesis.
Colloidal synthesis
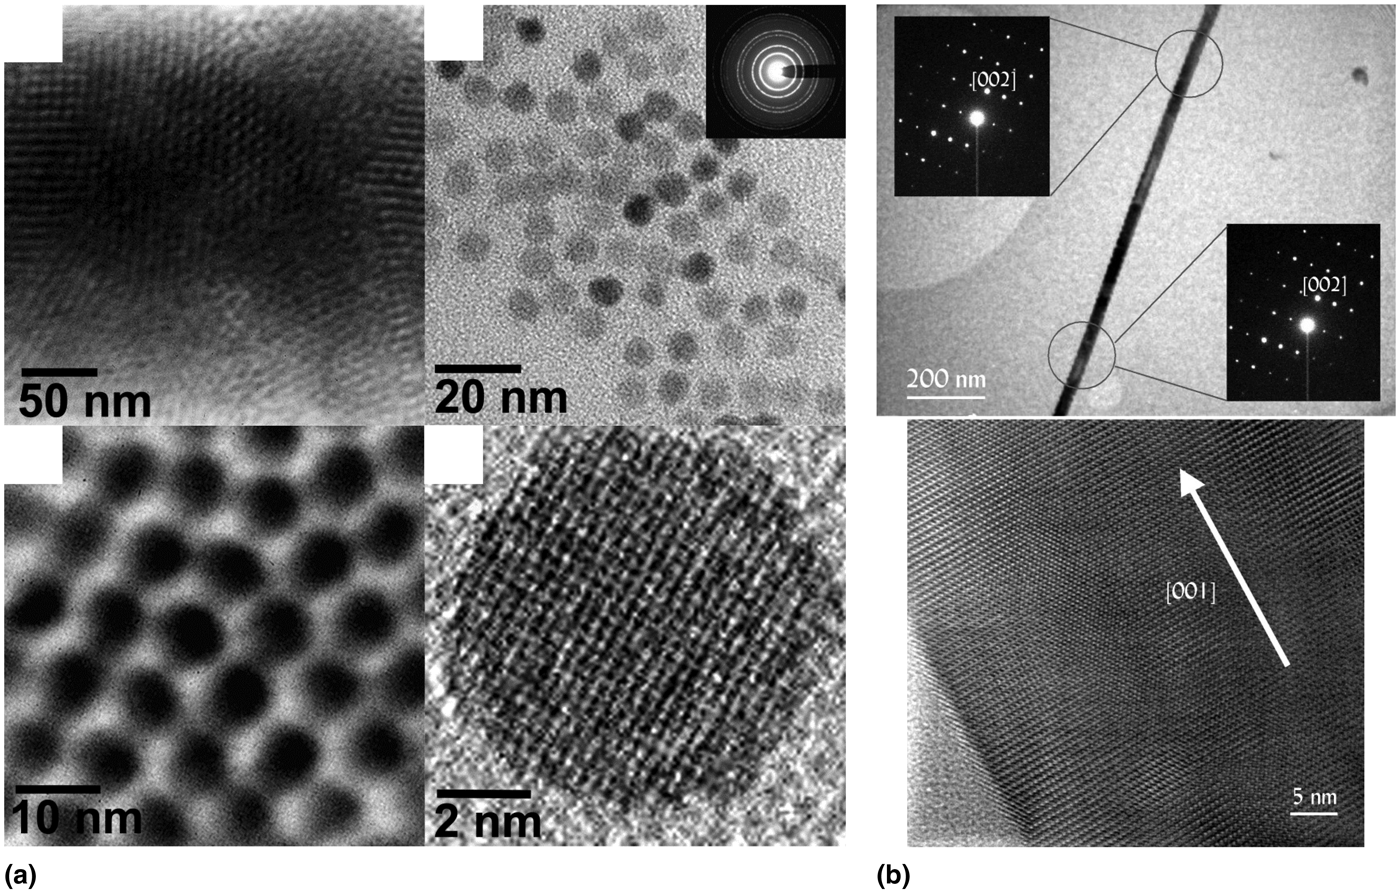
Early attempts at the synthesis of ferroelectric nanomaterials employed colloidal techniques involving decomposition of reactive organometallic precursors in the presence of long-chain surfactant molecules that passivate particle surfaces and prevent aggregation in solution. Early work by O'Brien et al. demonstrated the synthesis of monodisperse BaTiO3 nanocrystals via hydrolytic decomposition of a bimetallic alkoxide precursor in the presence of oleic acid ligands (Fig. 2).[Reference O'Brien, Brus and Murray12] A subsequent study by Urban et al. demonstrated the synthesis of single-crystal nanowires of both BaTiO3 and the incipient ferroelectric SrTiO3 through hydrolysis and subsequent high-temperature growth using a simpler bimetallic alkoxide (Fig. 2).[Reference Urban, Yun, Gu and Park13] The synthesis of the binary semiconductor ferroelectric GeTe has recently been demonstrated through reaction of Ge(II) precursors with a trioctylphosphine–Te complex in the presence of trioctylphosphine and dodecanethiol stabilizers, and weak ferroelectric ordering has also been detected in nanorods of the ferroelectric semiconductor Sb2S3.[Reference Polking, Zheng, Ramesh and Alivisatos14, Reference Varghese, Barth, Keeney, Whatmore and Holmes15] Despite these notable successes, the synthesis of monodisperse, soluble ferroelectric nanoparticles by standard organic-phase colloidal methods remains enormously challenging. These challenges may be due in part to the paucity of bimetallic alkoxide precursors for hydrolytic synthesis and the presence of a spontaneous polarization, which may drive aggregation in solution.
Single-crystal BaTiO3 nanomaterials synthesized via organic-phase colloidal chemistry. (a) Transmission electron microscope (TEM) images of monodisperse BaTiO3 nanospheres capped with oleic acid ligands synthesized by hydrolysis of a bimetallic alkoxide precursor. Reproduced with permission from Ref. Reference O'Brien, Brus and Murray12, copyright 2001 American Chemical Society. (b) Single-crystal BaTiO3 nanowires synthesized through hydrolysis of another bimetallic alkoxide, also in the presence of oleic acid stabilizers. Selected area electron diffraction patterns (top panel) and high-resolution TEM images (bottom panel) indicate that the wires are single crystals. Reproduced with permission from Ref. Reference Urban, Yun, Gu and Park13, copyright 2002 American Chemical Society.
Hydrothermal and solvothermal synthesis
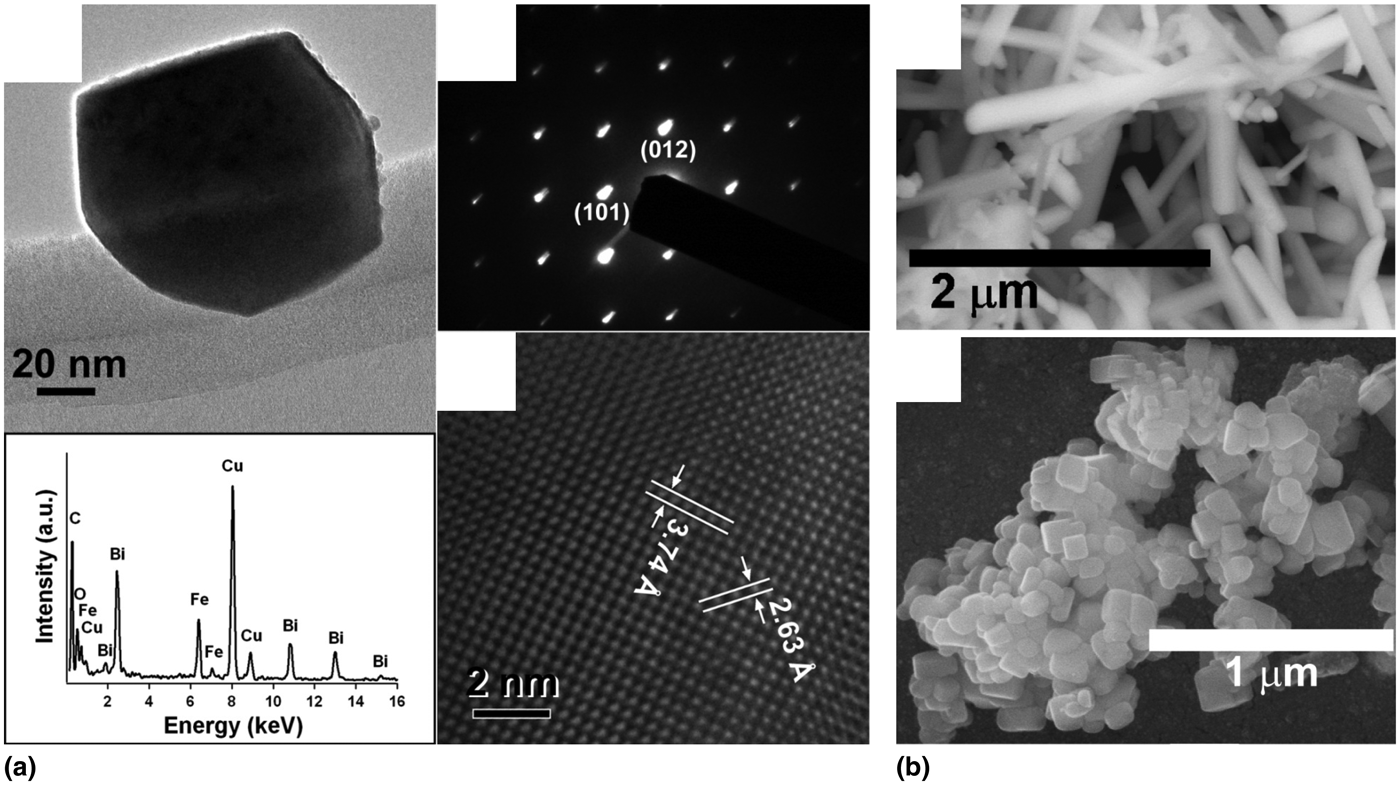
Hydrothermal and solvothermal methods have yielded a greater range of ferroelectric materials than those produced by colloidal chemistry, although size dispersion and aggregation remain serious challenges. Nanostructures of BaTiO3, PbTiO3, and Pb(ZrxTi1−x)O3 (PZT) have been prepared by hydro/solvothermal means, often through reaction of Ti isopropoxide with Ba metal or acetate salts.[Reference Page, Proffen, Niederberger and Seshadri16, Reference Moon, Kerchner, Krarup and Adair17] Wong and co-workers also prepared both BaTiO3 and SrTiO3 using oxalate chemistry at high pressure (Fig. 3).[Reference Mao, Banerjee and Wong18] This general approach involving high-temperature, high-pressure reaction of metal salts has also been employed for synthesis of other perovskites, such as the colossal magnetoresistive material La1−xBaxMnO3.[Reference Urban, Ouyang, Jo, Wang and Park19] In addition, Caruntu and co-workers have recently reported the growth of reasonably well-dispersed nanocrystals of the ferroelectric (and leading nonlinear optical material) LiNbO3 via decomposition of a single-source precursor under high pressure.[Reference Mohanty, Chaubey, Yourdkhani, Adireddy, Caruntu and Wiley20] The hydrothermal approach has recently shown promise for the synthesis of the multiferroic perovskite BiFeO3 through reaction of Bi and Fe salts in the presence of tartaric acid or ethylene glycol followed by calcination (Fig. 3).[Reference Ghosh, Dasgupta, Sen and Maiti21, Reference Park, Papaefthymiou, Viescas, Moodenbaugh and Wong22] Templated growth procedures using either pre-existing arrays of nanowires, such as TiO2 or ZnO, or lattice-matched substrates have also enjoyed modest success in the formation of quasi-one-dimensional nanostructures.[Reference Zhou, Tang and Sodano23–Reference Rørvik, Grande and Einarsrud26] Although solvothermal techniques have broadened the range of available ferroelectric nanomaterials, these techniques generally yield products with poor size dispersion and serious agglomeration, rendering these materials of limited use for either applications requiring uniform particles or fundamental studies at the single-particle level.
Perovskite nanostructures produced by hydrothermal synthesis methods. (a) Nanocrystals of the multiferroic material BiFeO3 synthesized by a hydrothermal reaction in the presence of ethylene glycol. The four panels include a low-resolution TEM image, an electron diffraction pattern, a high-resolution TEM image, and an energy dispersive x-ray spectroscopy scan illustrating the stoichiometry (clockwise from top left). Reproduced with permission from Ref. Reference Park, Papaefthymiou, Viescas, Moodenbaugh and Wong22, copyright 2007 American Chemical Society. (b) Scanning electron microscope images of hydrothermally prepared nanostructures of both BaTiO3 (top panel) and the incipient ferroelectric SrTiO3 (lower panel). Reproduced with permission from Ref. Reference Mao, Banerjee and Wong18, copyright 2003 American Chemical Society.
Aqueous/organic multiphase synthesis
The development of a new synthetic method by Li and co-workers using both an aqueous and an organic phase at high pressures has enabled the high monodispersity and ligand passivation provided by colloidal techniques to be combined with the versatility of the hydrothermal approach.[Reference Wang, Zhuang, Peng and Li27] In this method, metal salts are dissolved in the aqueous phase, and organic capping ligands such as oleic acid are dissolved in the organic phase (Fig. 4). Decomposition of the metal carboxylates formed in-situ at high temperature and pressure results in oxide nanocrystals capped with carboxylate ligands that segregate in the organic phase. This method was leveraged by Do, Gao, and others to create highly monodisperse, organic-soluble nanocrystals of rare-earth oxide nanocrystals, particularly CeO2.[Reference Yang and Gao28, Reference Nguyen and Do29] Recently, two-phase techniques have been applied to the synthesis of ferroelectric oxides by Caruntu and co-workers, with impressive results (Fig. 4).[Reference Adireddy, Lin, Cao, Zhou and Caruntu30] Adireddy et al. reported the synthesis of highly monodisperse nanocrystals of BaTiO3 with controlled sizes and shapes. In this work, the reaction of Ti butoxide with Ba nitrate in the presence of oleic acid at elevated pressure produces nanocrystals capped with oleic acid ligands that are well dispersed in organic solution. Broader application of this method may provide a promising path forward for the synthesis of other types of ferroelectric perovskites with controlled sizes, shapes, and surface structures that can be readily redispersed.
An aqueous/organic two-phase method for producing ligand-passivated and monodisperse ferroelectric nanocrystals. (a) Schematic illustration of the synthesis process. Metal salts in the aqueous phase form metal carboxylates in-situ that subsequently decompose to nucleate nanocrystals. The growing nanocrystals are passivated by long-chain organic ligands dissolved in the organic phase, in which the particles remain. Reproduced with permission from Ref. Reference Wang, Zhuang, Peng and Li27, copyright 2005 Nature Publishing Group. (b) TEM image of monodisperse BaTiO3 nanocubes prepared by this aqueous/organic two-phase synthesis procedure. Nanocubes capped with oleic acid ligands dissolved in an organic phase with sizes as small as ~5 nm can be obtained. Reproduced with permission from Ref. Reference Adireddy, Lin, Cao, Zhou and Caruntu30, copyright 2010 American Chemical Society.
Future directions in ferroelectric nanomaterial synthesis
Although considerable progress has been made in the synthesis of high-quality nanostructures of ferroelectrics, these materials continue to lag far behind the state of more common metal and semiconductor materials. Notably, promising solution-phase synthesis routes have thus far not been accompanied by significant progress in the vapor-phase growth of one-dimensional nanostructures. While nanowires of the semiconducting ferroelectrics GeTe and Sb2S3 have been synthesized by several groups using vapor-phase methods, few reports exist for traditional perovskite oxide materials.[Reference Yu, Wu, Gu and Park31, Reference Yang, Bachmann, Pippel, Berger, Woltersdorf, Gösele and Nielsch32] Nanotubes and epitaxial nanowires of PbTiO3 and PZT have been grown by templated MOCVD growth on ZnO nanowires[Reference Fujisawa, Kuri, Nakashima, Shimizu, Kotaka and Honda24] or vapor–solid growth on SrTiO3 substrates,[Reference Chen, Liu, Chen, Liu, Chen, Wu, Wang, He, Chu and Chueh25] respectively, but reports of the growth of single-crystal perovskite nanowires of controlled, uniform diameter by vapor-phase methods are practically nonexistent. A great deal of open territory thus exists for the development of syntheses of high-quality nanowires by vapor-phase means.
The field of ferroelectrics would also benefit from an expansion of the library of available materials, particularly those exhibiting multiferroic properties. Given the difficulty of ambient-pressure colloidal synthesis for traditional oxides and the relatively poor size and shape control afforded by solvothermal techniques, the expansion of two-phase aqueous/organic synthetic methods to traditional ferroelectrics with larger polarization such as PbTiO3 and multiferroics such as BiFeO3 and YMnO3 would appear an area ripe for intense exploration. The nanoscale synthesis of polar complex fluoride compounds also remains, to the best of our knowledge, almost entirely unexplored. Numerous ferroelectric (and even multiferroic) complex fluorides exist, such as BaMnF4 and related materials.[Reference Scott and Blinc33] Monodisperse colloidal nanocrystals of other complex fluorides, including doped compounds with the same general formula ABF4, have been grown successfully for photonic upconversion applications.[Reference Ostrowski, Chan, Gargas, Katz, Han, Schuck, Milliron and Cohen34]
The development of heterostructures, particularly of the core–shell variety, may provide another strategy to enhance polar phase stability and expand functionality. It would be particularly exciting to examine the strain-mediated magnetoelectric coupling in nanostructures composed of perovskite oxides and magnetic spinel ferrites, similar to BaTiO3–CoFe2O4 nanocomposites examined in thin film structures.[Reference Zheng, Wang, Lofland, Ma, Mohaddes-Ardabili, Zhao, Salamanca-Riba, Shinde, Ogale, Bai, Viehland, Jia, Schlom, Wuttig, Roytburd and Ramesh35] It is conceivable that a well-established colloidal synthesis protocol for ferrites could be adapted for heterogeneous nucleation on perovskite nanocrystals grown through the two-phase route.[Reference Sun, Zeng, Robinson, Raoux, Rice, Wang and Li11] Strain engineering in nanoparticle heterostructures may also be exploited to stabilize novel material phases under ambient conditions. An intriguing step in this direction was recently reported by Chu and co-workers, who reported the growth of heterostructures composed of BiFeO3 nanodots in the non-equilibrium tetragonal phase on LaAlO3 nanoparticles formed by laser ablation.[Reference Kuo, Chen, Ji, Liu, Chen and Chu36]
An improved ability to tailor nanomaterial size and morphology may also enable the stabilization of non-equilibrium phases in single-component nanostructures under ambient conditions. Many common ferroelectrics, including BaTiO3,[Reference Kwei, Lawson, Billinge and Cheong37] PZT,[Reference Lines and Glass8] and BiFeO3[Reference Zeches, Rossell, Zhang, Hatt, He, Yang, Kumar, Wang, Melville, Adamo, Sheng, Chu, Ihlefeld, Erni, Ederer, Gopalan, Chen, Schlom, Spaldin, Martin and Ramesh38] exist near morphotropic phase boundaries separating phases with different crystallographic symmetry. The addition of a surface energy term to the free energy and internal strain arising from the free surface can lead to dramatic changes in the phase diagram of materials at reduced dimensions.[Reference Tolbert and Alivisatos39] Non-equilibrium phases have been stabilized in simple oxide materials such as ZrO2 that exist close to a tetragonal-monoclinic phase boundary,[Reference Sato, Abe and Ohara40] and phases not otherwise observed in nature have been seen in other systems, most notably the epsilon phase in Co nanoparticles.[Reference Sun and Murray41] Indeed, a recent study by Louis et al. on BaTiO3 and KNbO3 nanowires reported a previously unobserved monoclinic ferroelectric phase not known to be present in bulk material.[Reference Louis, Gemeiner, Ponomareva, Bellaiche, Geneste, Ma, Setter and Dkhil42] It will be interesting to see whether size and morphological control can be leveraged in other ferroelectric nanostructures to stabilize novel material phases, such as the tetragonal phase of BiFeO3 with one of the highest spontaneous polarization values yet reported.[Reference Wang, Neaton, Zheng, Nagarajan, Ogale, Liu, Viehland, Vaithyanathan, Schlom, Waghmare, Spaldin, Rabe, Wuttig and Ramesh43]
Fundamental science of ferroelectric nanomaterials
We now switch our attention to the physics of such ferroelectric nanocrystals, with a particular focus on work examining the stability of the polar state as a function of size. As synthetic techniques have evolved to produce higher-quality materials, so too has our understanding of the behavior of ferroelectricity at reduced dimensions. Early work on nanocrystalline ceramics suggested a rapid decay of ferroelectric polarization below a size scale of ~100 nm,[Reference Uchino, Sadanaga and Hirose44] while more recent studies have complicated the picture by suggesting a dissolution of the coherence of local ferroelectric distortions[Reference Smith, Page, Siegrist, Redmond, Walter, Seshadri, Brus and Steigerwald45–Reference Petkov, Gateshki, Niederberger and Ren47] or even the formation of exotic polarization states with continuous polarization rotation.[Reference Naumov, Bellaiche and Fu48, Reference Fu and Bellaiche49] In addition, our picture of other basic ferroelectric properties, such as the evolution of domain structure with size and the size-scaling of the ferroelectric phase transition, is also becoming clearer due to both improved synthetic techniques and characterization tools. We highlight in this section new insights into the size-scaling of ferroelectric domain structures, phase transitions, and the stability of the polar phase. We further examine emerging areas of research, in particular studies of individual, discrete nanocrystals and the search for exotic polarization states. Finally, we will describe outstanding questions relating to the fundamental physics of low-dimensional ferroelectricity and propose future strategies for addressing these questions.
Ferroelectric stability at the nanoscale
Early studies of size effects in ferroelectrics on nanocrystalline ceramics frequently noted the apparent decline in the overall ferroelectric polarization as a function of particle size at size scales less than approximately 100 nm.[Reference Uchino, Sadanaga and Hirose44, Reference Frey and Payne50–Reference Chattopadhyay, Ayyub, Palkar and Multani54] This decline in polarization was generally attributed to the influence of the depolarization field at small dimensions, and it was widely believed that screening of the polarization-induced surface charges by metallic electrodes was necessary to stabilize the ferroelectric state. A seminal study by Spanier et al., however, demonstrated a stable ferroelectric polarization in single-crystal BaTiO3 nanowires down to diameters of only a few nanometers.[Reference Spanier, Kolpak, Urban, Grinberg, Ouyang, Yun, Rappe and Park55] Calculations using density functional theory in this work showed that molecular adsorbates on the surface provided an even greater screening effect than that provided by metallic electrodes, and subsequent work on thin films highlighted the dramatic effects of atmospheric moisture and other adsorbates in manipulating the domain arrangements in two-dimensional systems.[Reference Shin, Nascimento, Geneste, Rundgren, Plummer, Dkhil, Kalinin and Baddorf56] Rigorous structural studies by the groups of Steigerwald,[Reference Smith, Page, Siegrist, Redmond, Walter, Seshadri, Brus and Steigerwald45] Petkov,[Reference Tripathi, Petkov, Selbach, Bergum, Einarsrud, Grande and Ren46, Reference Petkov, Gateshki, Niederberger and Ren47] and others using atomic pair-distribution function analysis confirmed the presence of ferroelectric structural distortions in particles as small as 5 nm, and recent work has demonstrated a net polar distortion in single nanocrystals with sub-5 nm dimensions using direct atomic-scale imaging.[Reference Polking, Urban, Milliron, Zheng, Chan, Caldwell, Raoux, Kisielowski, Ager, Ramesh and Alivisatos57, Reference Polking, Han, Yourdkhani, Petkov, Kisielowski, Volkov, Zhu, Caruntu, Alivisatos and Ramesh58] The realization that ferroelectricity can be preserved down to far smaller dimensions than previously imagined opened up new territory for both fundamental study and practical applications.
Evolution of domain structure with size
Although the evolution of domain structure with size in ferromagnetic materials had been well described theoretically by Kittel and verified experimentally, the scaling of domain structure in ferroelectrics has been subject to rigorous experimental investigation only more recently.[Reference Kittel6] The domain spacing, which was predicted to scale approximately as the square root of the sample dimensions, is a delicate balance among electrostatic energy, domain wall formation energy, and internal strain.[Reference Kittel6] Studies by Gregg and co-workers on individual free-standing pieces of BaTiO3 cut from a bulk single crystal by a focused ion beam have yielded considerable insights into the evolution of domain patterns with both size and morphology (Fig. 5).[Reference Schilling, Adams, Bowman, Gregg, Catalan and Scott59–Reference Schilling, Bowman, Catalan, Scott and Gregg61] Studies of the size-scaling of domain structures demonstrated the validity of the classical Kittel scaling relation over orders of magnitude in size, down to a size limit of approximately 100 nm.[Reference Schilling, Adams, Bowman, Gregg, Catalan and Scott59] A study of discrete nanodots fabricated using the same method illustrated the presence of quadrant-like domain structures, although no simple flux-closure structures could be observed.[Reference Schilling, Byrne, Catalan, Webber, Genenko, Wu, Scott and Gregg60] An additional study by this team demonstrated control of 90° domain arrangements by varying the morphology and size of single-crystal nanowires.[Reference Schilling, Bowman, Catalan, Scott and Gregg61] Additional work by Luk'yanchuk et al. attributed the presence of ferroelastic 90° domain walls, for which no electrostatic driving force exists, in such structures to the presence of internal strains arising from a surface “dead” layer created by ion milling.[Reference Luk'yanchuk, Schilling, Gregg, Catalan and Scott62] Internal strains may thus play a much larger role than previously thought in governing the size-scaling of ferroelectricity. This body of work has yielded powerful insights into the influence of size, morphology, and surface structure on domain arrangements at dimensions approaching the nanoscale. Owing to the use of focused ion beam milling, which creates a damaged surface layer several nanometers in thickness and is limited to structure dimensions of ~100 nm, these studies were unable to explore the possibility of a transition to a single-domain regime, and separating the effects of surface damage from intrinsic depolarization effects remains challenging. Recent work on GeTe nanocrystals demonstrated a transition to a single-domain regime at a size scale of approximately 30–50 nm.[Reference Polking, Zheng, Ramesh and Alivisatos14] Other recent studies on BaTiO3 nanocubes also point to stable single-domain states in discrete nanocrystals at a size scale of <~50 nm.[Reference Szwarcman, Prosandeev, Louis, Berger, Rosenberg, Lereah, Bellaiche and Markovich63] Finer control over morphology and size will be necessary to fully elucidate the transition from the monodomain to the multidomain regime in nanomaterials with both size and morphology. The monodisperse BaTiO3 nanocubes described in the previous section on synthesis would appear to provide in this respect a promising starting point for such a detailed analysis.
Domains in freestanding ferroelectric nanostructures. (a) Domain patterns in fabricated ferroelectric nanodots show complex configurations that persist down to the smallest length scales studied (~100 nm). Reproduced with permission from Ref. Reference Schilling, Byrne, Catalan, Webber, Genenko, Wu, Scott and Gregg60, copyright 2007 American Chemical Society. (b) Scaling of domain periodicity with size in freestanding nanostructures. Domain spacing scales with the square root of side length for both nanodots and nanorods for all sizes observed experimentally, consistent with classical scaling laws. Reproduced with permission from Ref. Reference Schilling, Adams, Bowman, Gregg, Catalan and Scott59, copyright 2006 American Physical Society.
Ferroelectric coherence at the nanoscale
Implicit in much early work on low-dimensional ferroelectricity was the assumption that a decline in ferroelectric polarization at a global scale reflected a decline in ferroelectric distortions at a local scale. Spectroscopic experiments on BaTiO3 thin films frequently showed the presence of tetragonal symmetry above the Curie temperature, and studies of BaTiO3 nanocrystals with Raman spectroscopy, which is highly sensitive to local symmetry, in many cases showed tetragonal symmetry in particles otherwise believed to be in the cubic state.[Reference Shiratori, Pithan, Dornseiffer and Waser64] Recent studies combining a probe sensitive to global structure, such as Rietveld refinement of powder x-ray diffraction data, with a probe sensitive to local structure, such as atomic pair distribution function (PDF) analysis, have yielded powerful new insights into the fundamental changes that occur in ferroelectric ordering at the nanoscale.[Reference Smith, Page, Siegrist, Redmond, Walter, Seshadri, Brus and Steigerwald45–Reference Petkov, Gateshki, Niederberger and Ren47] These studies demonstrated the presence of clear tetragonal distortions in BaTiO3 down to particle sizes of only a few nanometers and illustrated clear structural changes relative to bulk material below a size scale of ~100 nm, as demonstrated in previous work. Importantly, however, although measurements with Rietveld refinement of powder diffraction data showed a decline in the overall tetragonal distortion with decreasing size, PDF measurements illustrated ion displacements on a local scale that were often larger than those for bulk material (Fig. 6). This disparity arises from a decline in the coherence of ferroelectric distortions across the particle volume. Recent work on monodisperse BaTiO3 nanocrystals with different morphologies indicates a profound influence of particle shape on this structural coherence, implicating internal strains as an additional cause of disordering.[Reference Polking, Han, Yourdkhani, Petkov, Kisielowski, Volkov, Zhu, Caruntu, Alivisatos and Ramesh58] Cubic particles with more low-energy surface facets were found to have far greater coherence lengths for tetragonal distortions when compared with spherical particles, even those with larger volumes. Despite the decline in ferroelectric coherence, a net polarization in nanocrystals as small as 5 nm has been confirmed to be stable by both atomic-resolution imaging and electrical switching.[Reference Polking, Han, Yourdkhani, Petkov, Kisielowski, Volkov, Zhu, Caruntu, Alivisatos and Ramesh58] Atomic-resolution transmission electron microscope (TEM) images illustrated a significant net, coherent polarization in both GeTe and BaTiO3 nanocrystals grown by solution-phase techniques (Fig. 7). More recent work with electron microscopy has also illustrated a tetragonal distortion in BaTiO3 nanocubes that is larger than that for bulk material within the particle core but accompanied by a nearly undistorted “shell” region near the surfaces that reduces the overall distortion to more bulk-like values.[Reference Szwarcman, Prosandeev, Louis, Berger, Rosenberg, Lereah, Bellaiche and Markovich63] These structural studies reveal a picture of ferroelectric order that, although robust down to nanometer-scale dimensions, becomes markedly inhomogeneous in nature.
Coherence of ferroelectric distortions at the nanoscale. (a) Unit cell parameters of BaTiO3 nanoparticles as a function of size obtained from Rietveld refinement of powder x-ray diffraction patterns. Although the overall tetragonal distortion defined as the ratio of the c axis ([001]) lattice constant to the a axis ([100], [010]) lattice constant decreases for smaller BaTiO3 nanoparticles (top panel), the local Ti cation displacements (Given here in fractional coordinates, where a value of 0.500 represents the Ti position for the undistorted, cubic phase) increase with decreasing size (bottom panel), suggesting larger but less spatially coherent local ferroelectric distortions. (b) Changes in the unit cell parameters of BaTiO3 nanoparticles with sizes of 26, 45, and 70 nm and bulk material through the phase transition. The phase transition (near 130 °C) becomes noticeably more diffuse as particle size decreases. Both panels reproduced with permission from Ref. Reference Smith, Page, Siegrist, Redmond, Walter, Seshadri, Brus and Steigerwald45, copyright 2008 American Chemical Society.
Atomic-scale mapping of ferroelectric polarization in individual nanocrystals. (a) Atomic-scale analysis of local polarization patterns in individual GeTe nanocrystals. Mapping of local atomic displacements obtained from atomic-resolution TEM images (top panel) reveals a coherent and linearly ordered polarization along the [111] axis (bottom panel). (b) Atomic-scale analysis of local polarization patterns in individual BaTiO3 nanocrystals. Mapping of local atomic displacements also shows a coherent and linearly ordered polarization along the [001] axis (bottom panel). Reproduced with permission from Ref. Reference Polking, Han, Yourdkhani, Petkov, Kisielowski, Volkov, Zhu, Caruntu, Alivisatos and Ramesh58, copyright 2012 Nature Publishing Group.
Toroidal polarization states
As recent experimental work has changed the picture of nanoscale ferroelectrics as miniaturized bulk materials with diminished but coherent polarization, theoretical studies using ab initio techniques have uncovered still more intriguing behavior. At reduced dimensions, ferromagnetic materials frequently form flux-closure domain structures to reduce magnetostatic energy stored in fringing fields.[Reference Kittel6] Below the single-domain limit, energy may be minimized by formation of toroidal magnetization states characterized by continuous rotation of magnetic flux around a central core. Such toroidal magnetization states have been elegantly demonstrated experimentally by, for example, Snoeck et al. using off-axis electron holography.[Reference Snoeck, Gatel, Lacroix, Blon, Lachaize, Carrey, Respaud and Chaudret65] The anisotropy energy of the spontaneous polarization in ferroelectrics, however, is, in general, far greater than the anisotropy of the spontaneous magnetization in ferromagnets,[Reference Lines and Glass8] although this anisotropy may become vanishingly small in the vicinity of a morphotropic phase boundary.[Reference Rossetti, Khachaturyan, Akcay and Ni66] The spontaneous polarization is thus far more difficult to reorient along an arbitrary axis, leading many to believe that toroidal polarization states requiring continuous flux rotation would not exist in nature. A seminal ab initio study by Naumov et al. on PZT nanostructures, however, demonstrated stable vortex polarization states in nanodots and periodic arrangements of vortices in nanowires (Fig. 8).[Reference Naumov, Bellaiche and Fu48] An ultimate limit for the stability of the toroidally ordered polar state of 2.6 nm was also reported, further pushing the size limits of the polar phase. Subsequent work expanded these results to BaTiO3[Reference Fu and Bellaiche49] and GeTe[Reference Durgun, Ghosez, Shaltaf, Gonze and Raty67] and demonstrated a smooth transition between vortex and conventional polarization states with increasing polarization screening.[Reference Ponomareva, Naumov, Kornev, Fu and Bellaiche68] In an effort to aid the search for toroidal ordering, Bellaiche and coworkers have also provided a list of properties that should be exhibited by such nanodots, including a c/a ratio (tetragonal distortion) of less than one for tetragonal ferroelectrics that could be observed by standard diffraction techniques.[Reference Prosandeev and Bellaiche69] The existence of continuous flux rotation and flux-closure-like domain structures has recently been directly demonstrated in ferroelectric thin films using atomic-resolution microscopy. Nelson et al. demonstrated the first example of a flux-closure-like structure with continuous flux rotation in a BiFeO3 thin film grown on an insulating TbScO3 substrate,[Reference Nelson, Winchester, Zhang, Kim, Melville, Adamo, Folkman, Baek, Eom, Schlom, Chen and Pan70] and Jia et al. followed up this study with a detailed analysis of continuous flux rotation in PZT thin films also grown on insulating TbScO3 using a combination of atomic-resolution microscopy and rigorous image simulations (Fig. 8).[Reference Jia, Urban, Alexe, Hesse and Vrejoiu71] Despite these breakthroughs in thin-film systems, true single-domain vortex polarization states in discrete nanodots have yet to be observed conclusively. A notable effort by Rodriguez et al. demonstrated piezoresponse force microscope (PFM) data consistent with a flux closure-like domain arrangement in fabricated nanodots, but the size scale of these dots (~100 nm) is significantly above the single-domain regime.[Reference Rodriguez, Gao, Liu, Lee, Naumov, Bratkovsky, Hesse and Alexe72] Studies with electron holography similar to the work of Snoeck et al. on ferromagnetic nanocubes have shown evidence of a linear polarization state and external fringing fields, but no evidence of toroidal ordering has yet been uncovered.[Reference Polking, Han, Yourdkhani, Petkov, Kisielowski, Volkov, Zhu, Caruntu, Alivisatos and Ramesh58, Reference Szwarcman, Lubk, Linck, Vogel, Lereah, Lichte and Markovich73] The lack of single-domain vortex states may be attributable to the aforementioned efficient screening of polarization-induced charges by surface adsorbates. It is notable that examples of continuous flux rotation in thin films occurred in films grown on insulating substrates rather than on a more typical metallic SrRuO3 back electrode that provides effective screening. Stabilizing vortex states in freestanding nanocrystals may thus require an analogous arrangement consisting of a ferroelectric core surrounded by a highly insulating epitaxial shell.
Novel polarization states in ferroelectric nanomaterials. (a) Schematic illustrations of polarization patterns in PZT nanodots of various shapes. Despite the large anisotropy energy of ferroelectrics, vortex-like polarization states with a stable toroid moment have been predicted theoretically in small, single-domain ferroelectric nanostructures. Reproduced with permission from Ref. Reference Prosandeev and Bellaiche69, copyright 2007 American Physical Society. (b) Direct observation of continuous flux rotation in a PZT thin film on an insulating TbScO3 substrate by atomic-resolution TEM. Local polarization vectors are indicated by the small yellow arrows. Reproduced with permission from Ref. Reference Jia, Urban, Alexe, Hesse and Vrejoiu71, copyright 2011 American Association for the Advancement of Science.
Size-dependent polar phase transition
Like the question of the stability of the polar state at finite dimensions, the nature of the phase transition from the high-temperature prototype phase to the low-temperature polar-ordered phase has also been the subject of some contention. Studies of nanocrystalline ceramics and nanopowders of BaTiO3 and PbTiO3 have frequently shown a decrease in Curie temperature with particle size below a size scale of ~100 nm, but estimates for the degree of suppression of the ordering temperature vary considerably.[Reference Frey and Payne50–Reference Chattopadhyay, Ayyub, Palkar and Multani54] Some reports have suggested a critical size for the disappearance of the polar phase transition as small as 10–30 nm,[Reference Zhao, Buscaglia, Viviani, Buscaglia, Mitoseriu, Testino, Nygren, Johnsson and Nanni52] while others cite values closer to 50 nm or even larger.[Reference Schlag and Eicke53] The study of the phase transition in individual BaTiO3 wires by Spanier et al. cited earlier found a suppression of the Curie temperature to below ambient temperature at a diameter of 3 nm.[Reference Spanier, Kolpak, Urban, Grinberg, Ouyang, Yun, Rappe and Park55] Although wide scatter exists in measurements of the Curie point, a shift in the temperature of the paraelectric-ferroelectric phase transition with decreasing particle size has been consistently observed, often following a 1/d trend (where d is the particle diameter). The significantly lower critical size for the suppression of ferroelectricity in the Spanier study may be related to effective passivation of the wires with oleic acid ligands. A change to a more diffuse phase transition with decreasing size has also been consistently observed. Analysis of the polar phase transition with differential scanning calorimetry (DSC) and Raman spectroscopy in particular has often shown a pronounced broadening of the temperature range of the phase transition.[Reference Smith, Page, Siegrist, Redmond, Walter, Seshadri, Brus and Steigerwald45, Reference Shiratori, Pithan, Dornseiffer and Waser64] Some portion of this effect may be related to inhomogeneity in particle size, but studies on relatively monodisperse particles have shown significant broadening of the transition as well.[Reference Smith, Page, Siegrist, Redmond, Walter, Seshadri, Brus and Steigerwald45] The increasing diffuseness of the phase transition with decreasing particle size is thus likely to be at least to some extent of intrinsic origin. The results of detailed structural studies with PDF and TEM mentioned earlier suggest increasing inhomogeneity of polarization as a likely cause of this broadening. Deconvoluting size inhomogeneity from intrinsic effects, however, will ultimately require single-particle studies. An interesting effort in this direction was recently presented by Szwarcman et al. on individual BaTiO3 nanocubes.[Reference Szwarcman, Vestler and Markovich74] The localized surface plasmon resonance of gold nanoparticles grown on the nanocubes was used in this work as a local probe of the material phase. The group concluded that surface effects dominated the behavior of the smallest (~16 nm) nanocubes, but particle aggregation makes interpretation of the results somewhat problematic. The precise physical origins of the increasing diffuseness of the phase transition at finite size also remain at issue. Although depolarization effects have been traditionally implicated, a recent study of the size-dependent polar phase transition in highly conducting GeTe found a similar decrease in the polar phase transition temperature with decreasing size and a significant decrease in the magnitude of the polar distortion.[Reference Polking, Urban, Milliron, Zheng, Chan, Caldwell, Raoux, Kisielowski, Ager, Ramesh and Alivisatos57] The metallic conductivity of GeTe provides strong internal screening of depolarization fields; it is thus likely that internal strain effects at finite size also contribute to the suppression of the phase transition temperature and stability of the polar state.
Future possibilities for fundamental study
Although much progress has been made towards developing a clear picture of ferroelectricity at the nanoscale, many important questions remain. The parallel development of synthetic techniques for monodisperse ferroelectric nanocrystals with well-defined morphologies and new tools for nanoscale in situ characterization with TEM and scanning-probe microscopy provide, in our view, rich opportunities.
In situ studies of the ferroelectric phase transition and ferroelectric switching in individual particles represent a particularly exciting route for future exploration. The recent development of MEMS-based heating holders for the TEM allows for atomic-resolution imaging at elevated temperatures with minimal thermal drift and rapid stabilization.[Reference Allard, Bigelow, Jose-Yacaman, Nackashi, Damiano and Mick75] In situ heating of monodisperse BaTiO3 nanocubes, such as those demonstrated by Caruntu and co-workers,[Reference Adireddy, Lin, Cao, Zhou and Caruntu30] could allow the ferroelectric phase transition to be characterized at the single-particle level for the first time. A combination of a global structural probe, such as electron diffraction, with a probe sensitive to local symmetry breaking, such as electron energy loss near edge structure, could allow the evolution of both local and global ferroelectric distortions through the phase transition to be analyzed free from ensemble averaging effects. Analysis with direct atomic-resolution imaging could yield even more exciting conclusions. The parallel development of new in situ electrical biasing sample holders could provide another exciting new direction. A simple parallel plate capacitor-like structure patterned using electron beam lithography on a silicon nitride heating chip could be used to apply an electric field across individual ferroelectric nanocubes to observe polarization switching in situ at atomic resolution. The use of discrete nanocubes provides an opportunity to study polarization switching at the simplest level, free from interference from substrates, other domains, and other complicating factors.
The combination of topographic information and nanoscale spectroscopy provided by recently developed instruments integrating AFM/PFM with tip-enhanced Raman spectroscopy may provide another powerful pathway to studies of polarization switching and phase transitions on a single-domain scale.[Reference Berweger, Neacsu, Mao, Zhou, Wong and Raschke76] The sensitivity of Raman spectroscopy to subtle changes in crystallographic symmetry may allow detection of local (and incoherent) structural perturbations accompanying ferroelectric phase transitions that would be highly challenging to resolve with TEM. In addition, the ability to readily combine this high sensitivity to local structure with polarization switching may furnish new insights into switching mechanisms at the single-domain scale and the origins of fatigue/retention effects.
The demonstration of polarization switching in thin BaTiO3 nanowires[Reference Spanier, Kolpak, Urban, Grinberg, Ouyang, Yun, Rappe and Park55] and more recently in sub-10 nm BaTiO3 nanodots[Reference Polking, Han, Yourdkhani, Petkov, Kisielowski, Volkov, Zhu, Caruntu, Alivisatos and Ramesh58] raises questions regarding the stability of the polarization as a function of time. The so-called superparamagnetic effect is well known in ferromagnetic nanocrystals at reduced size.[Reference Murray, Kagan and Bawendi9, Reference Sun and Murray41] In the superparamagnetic regime, ambient thermal energy becomes comparable with the anisotropy energy of the magnetization, which scales with particle size, allowing for random, thermally induced collective reorientation of all spins within a single-domain particle. The existence of an analogous superparaelectric effect remains an open question. Analysis of individual sub-10 nm BaTiO3 nanocubes with PFM could provide an avenue for exploring this question. The PFM phase signal provides direct information on the direction of the spontaneous polarization, with a 180° phase shift corresponding to a 180° flip in the direction of the spontaneous polarization. Random, rapid flips in the phase signal by 90° or 180° over time would provide a clear signature of superparaelectric behavior.
A final area ripe for future study centers around the search for toroidal polarization states in nanomaterials, which incorporates synthetic, theoretical, and characterization challenges. Given the effective screening of surface charges that produce the depolarization fields necessary to generate polarization vortices, it will likely be necessary to generate core–shell structures in which polarization charges are trapped at an epitaxial interface with an insulating shell layer, analogous to ferroelectric layers on insulating substrates in which flux rotation has been observed. Overgrowth of SrTiO3 shells on BaTiO3 (or preferably PbTiO3) nanocubes may provide an appropriate system for observation of vortex states. Both BaTiO3 and SrTiO3 have been made using solution-phase synthetic techniques, so heterogeneous nucleation of SrTiO3 on BaTiO3 nanocubes may not be prohibitively difficult. The observation of novel polarization states in nanodots also presents challenges for theoretical modeling. Thorough understanding of polarization screening by capping ligands is lacking, as is work on the influence of internal strains on polarization coherence and character. A thorough theoretical treatment of screening provided by typical capping ligands and nanomechanical modeling to analyze the influence of morphology on internal strain fields and polarization would be quite beneficial in this area. A good step in this direction has recently been taken by Yasui and Kato, who analyzed in detail the effects of surface adsorbates and microstrain on ferroelectric ordering in small BaTiO3 nanocubes,[Reference Yasui and Kato77] but further studies along these lines will be necessary to provide a complete picture of the size and shape-dependent interplay of depolarization effects, polarization, and internal strain. Characterization of appropriately engineered nanostructures with atomic-resolution TEM may then provide the first experimental evidence of true monodomain vortex states.
Applications of ferroelectric nanostructures
The drive to understand nanoscale ferroelectrics is motivated to a large extent by applications of their unique spontaneous polarization and exceptional piezoelectric properties. While much attention within the ferroelectrics community has traditionally been focused on nonvolatile memory devices,[Reference Scott1, Reference Scott and Paz de Araujo2, Reference Lee, Han, Lotnyk, Schubert, Senz, Alexe, Hesse, Baik and Gösele78] recent years have seen the emergence of new applications for nanoscale ferroelectrics in mechanical and solar energy conversion,[Reference Wang3, Reference Yang, Seidel, Byrnes, Shafer, Yang, Rossell, Yu, Chu, Scott, Ager, Martin and Ramesh4] high-energy density nanocomposites,[Reference Ducharme79] and biosensing.[Reference Nguyen, Deshmukh, Nagarah, Kramer, Purohit, Berry and McAlpine5] In this section, we will highlight some of the recent achievements in these emerging fields and examine future challenges and prospects. Both improved techniques for the controlled synthesis of well-defined, high-quality ferroelectric nanomaterials and new fundamental insights into the nature of low-dimensional polar order will continue to fuel research on these technologies for many years to come.
Ferroelectric nanomaterials for nonvolatile memories
For many years, the possibility of high-density, low-power nonvolatile memory devices has been a major driving force behind the study of ferroelectric nanomaterials. Although memory devices based on ferromagnetic bits have long been the mainstay of the industry, magnetic memories are rapidly approaching fundamental physical limits associated with superparamagnetic effects. Ferroelectrics, which exhibit a much larger anisotropy, can maintain a thermally stable polarization down to size scales of only a few nanometers.[Reference Naumov, Bellaiche and Fu48, Reference Spanier, Kolpak, Urban, Grinberg, Ouyang, Yun, Rappe and Park55, Reference Polking, Han, Yourdkhani, Petkov, Kisielowski, Volkov, Zhu, Caruntu, Alivisatos and Ramesh58] Recent experimental confirmation of ferroelectric phase stability at such dimensions in freestanding nanodots would in principle allow storage densities in the Tbit/in2 range.[Reference Spanier, Kolpak, Urban, Grinberg, Ouyang, Yun, Rappe and Park55, Reference Polking, Han, Yourdkhani, Petkov, Kisielowski, Volkov, Zhu, Caruntu, Alivisatos and Ramesh58] Realizing such devices, however, remains a daunting challenge.
The development of techniques for the templated growth of nanodots, particularly on doped SrTiO3 substrates, has recently provided an interesting avenue to high-density memory devices. Deposition of ferroelectric nanoislands and nanorods using block copolymers[Reference Lee, Han, Lotnyk, Schubert, Senz, Alexe, Hesse, Baik and Gösele78, Reference Kim, Hong, Park, Zhe, Kim, Jang, Kim and No80] and titania nanotube[Reference Im, Jun, Lee, Lee, Yang, Jeong and Lee81] templates has led to potential storage densities exceeding the Tbit/in2 threshold, and formation of PbTiO3 and BiFeO3 nanodots with dimensions of the order of ~10 nm has been realized in a controlled fashion using dip pen lithography on SrTiO3 substrates (Fig. 9).[Reference Kim and Son82, Reference Son, Shin, Ryu, Kim and Jang83] BiFeO3 also offers the possibility of multiferroic switching, potentially allowing for multistate devices. Robust ferroelectric switching has been observed in such nanoislands down to lateral dimensions of less than 10 nm.[Reference Kim, Kim, Han, Jesse, Hyun, Lee, Kalinin and Kim84] A new solution-phase approach employing block copolymer micelles filled with PbTiO3 precursor has also yielded promising results for memory arrays. In this approach, a solution of discrete micelles can be spin-cast onto a substrate, and PbTiO3 nanoislands with diameters of about 20 nm can be created via subsequent thermal annealing.[Reference Kim, Han, Kim, Lee, Alexe, Baik and Kim85] The development of well-dispersed nanocubes of BaTiO3 raises the possibility of self-assembled memory devices as well. Monodisperse BaTiO3 nanocubes have recently been organized into densely packed layers using an evaporative self-assembly approach,[Reference Kato, Mimura, Dang, Imai, Wada, Osada, Haneda and Kuwabara86] allowing for potentially unprecedented storage densities.
Nanoscale ferroelectric nonvolatile memory arrays. (a,b) Atomic-force microscope image (a) and high-resolution TEM image (b) of discrete nanodots of PbTiO3 fabricated using dip-pen lithography. Epitaxial dots smaller than 10 nm can be fabricated. Reproduced with permission from Ref. Reference Son, Shin, Ryu, Kim and Jang83, copyright 2009 American Chemical Society. (c,d) Arrays of PZT nanodots formed using a block copolymer template. The nanodots can be individually electrically addressed, potentially leading to information storage densities exceeding 1 Tbit/in2. Reproduced with permission from Ref. Reference Lee, Han, Lotnyk, Schubert, Senz, Alexe, Hesse, Baik and Gösele78, copyright 2008 Nature Publishing Group.
The discovery of robust ferroelectric order down to ~5 nm size scales in GeTe, and the more recent discovery of ferroelectric switching in GeTe, raises new possibilities for memory devices. Recently demonstrated multiferroic switching in Mn-doped GeTe may allow for multistate memory devices,[Reference Przybylińska, Springholz, Lechner, Hassan, Wegscheider, Jantsch and Bauer87] and combining the ferroelectric and amorphous-to-crystalline phase-change properties of GeTe, as proposed by Durgun et al., may provide an avenue to tri-state memory devices.[Reference Durgun, Ghosez, Shaltaf, Gonze and Raty67]
Ferroelectric nanomaterials for energy conversion
In addition to a spontaneous polarization, ferroelectrics also possess large piezoelectric (relating strain and polarization) and pyroelectric (relating temperature changes and polarization) coefficients that have garnered attention in recent years for conversion of either mechanical or thermal energy, respectively, to electrical current. In addition, the discovery of photovoltaic effects in ferroelectrics,[Reference Choi, Lee, Choi, Kiryukhin and Cheong88] often accompanied by anomalously large above-band-gap voltages,[Reference Yang, Seidel, Byrnes, Shafer, Yang, Rossell, Yu, Chu, Scott, Ager, Martin and Ramesh4] has attracted interest for solar energy conversion as well, although ferroelectric nanomaterials have yet to be explored for this purpose.
Recently, a significant body of literature has emerged on piezoelectric nanogenerators in which mechanical motion can be converted into electrical current by arrays of piezoelectric nanowires (Fig. 10).[Reference Wang and Song89–Reference Qi, Jafferis, Lyons, Lee, Ahmad and McAlpine92] A generic device consists of aligned piezoelectric (especially PZT) nanowires spanning an electrode array. In some cases, nanowire mats span interdigitated electrodes or are embedded in a polymer matrix to form a composite structure.[Reference Chen, Xu, Yao and Shi91] Aligned nanowire arrays may also be formed by growth and subsequent patterning on an inorganic substrate followed by transfer to polydimethylsiloxane.[Reference Qi, Jafferis, Lyons, Lee, Ahmad and McAlpine92] In many cases these arrays are sandwiched between flexible polymer layers to enable deformation of the entire device, leading to deformation of the nanowires and consequent piezoelectric charge generation. Although many nanowires are composed of the classic piezoelectric material PZT,[Reference Chen, Xu, Yao and Shi91] other nanogenerators have been demonstrated using more environmentally friendly ZnO,[Reference Wang and Song89, Reference Qin, Wang and Wang90] KNbO3,[Reference Jung, Chen, Yun, Lee, Zhou, Jo, Chou and Wang93] and NaNbO3.[Reference Jung, Lee, Hong, Ding, Chen, Chou and Wang94] When a mechanical force is applied to a nanogenerator device, the deformation-induced piezovoltage results in a voltage spike across the electrodes and a corresponding transient current (Fig. 10). Release of the applied mechanical stress then results in a current pulse of opposite polarity. Cyclic application of mechanical force can then result in the generation of an alternating current that could potentially be used for powering devices. Such piezoelectric nanogenerators could provide an efficient means of converting random vibrations, including those produced by the human body, into useful electrical energy. Applications of such nanogenerators have already been envisaged in the form of running shoes that harvest the energy produced during the compression of the sole and in the form of in-vivo biosensors powered by mechanical motion inside the body.[Reference Wang3]
Mechanical energy harvesting and biosensing using piezoelectric nanowires. (a) Schematic illustration of a typical nanowire energy harvesting device. Nanowires (shown in red) span arrays of electrodes and are often imbedded in a flexible matrix. Reproduced with permission from Ref. Reference Chen, Xu, Yao and Shi91, copyright 2010 American Chemical Society. (b) Operation of a piezoelectric nanogenerator. Application and removal of force from the structure results in current pulses arising from the generation of a piezovoltage by mechanical strain. Such structures can be employed to harvest mechanical energy, such as that produced by biological motion. Reproduced with permission from Ref. Reference Chen, Xu, Yao and Shi91, copyright 2010 American Chemical Society. (c) Detecting mechanical motion of individual cells using a piezoelectric PZT nanoribbon array. The nanoribbons measure mechanical deformations of cells in response to electrical signals applied via a glass pipette (PPT). (d) Measuring simulated respiration in cow lung tissue. An array of PZT nanowires embedded in PDMS is placed in contact with cow lung tissue (top photo), and mechanical motion during the simulated respiration is recorded via induced piezoelectric voltage spikes (bottom plot). Reproduced with permission from Ref. Reference Nguyen, Deshmukh, Nagarah, Kramer, Purohit, Berry and McAlpine5, copyright 2012 Nature Publishing Group.
The use of the pyroelectric effect, in which a change in temperature induces a change in polarization, for conversion of thermal energy has also been recently explored. Several groups have reported pyroelectric energy conversion devices based on aligned arrays of polar nanowires composed of ZnO and KNbO3.[Reference Yang, Guo, Pradel, Zhu, Zhou, Zhang, Hu, Lin and Wang95, Reference Yang, Jung, Yun, Zhang, Pradel, Guo and Wang96] Changes in the spontaneous polarization in these nanowires in response to a change in device temperature generate a voltage across planar electrodes between which the nanowire arrays are sandwiched. Temperature cycling can then produce an alternating current for powering nanoscale devices in a manner analogous to that for piezoelectric devices. Such nanogenerators could prove quite useful for small-scale waste heat recovery applications.
Nanoscale ferroelectrics for high-energy density nanocomposites
High-energy density nanocomposites have emerged as a major direction in nanoscale ferroelectrics research and may provide a promising avenue toward high-performance capacitors for energy storage applications. Achieving a maximum possible energy density in such a capacitor requires maximizing two important factors: the breakdown field of the structure and the dielectric constant.[Reference Ducharme79] Inorganic ferroelectrics such as BaTiO3 and PZT have exceptionally large static dielectric constants, often measuring in the tens or even hundreds or thousands,[Reference Lines and Glass8] but generally have subpar breakdown fields. Polymers, on the other hand, in many cases have superior breakdown fields but relatively low dielectric constants. A common approach to high-energy density capacitors has thus been to disperse high-permittivity nanoparticles of ferroelectrics within a matrix of a polymer with an exceptionally large dielectric strength.[Reference Tang, Lin, Andrews and Sodano97–Reference Jung, Kang, Yang, Won and Kim103] The ferroelectric polymer polyvinylidene difluoride (PVDF) is by far the most common choice due to its high breakdown strength (~500 MV/cm) and relatively large dielectric constant (~65) arising from its ferroelectric ordering.[Reference Ducharme79] Nanocomposites based on PVDF have been made most frequently with BaTiO3 nanoparticles,[Reference Almadhoun, Bhansali and Alshareef99–Reference Jung, Kang, Yang, Won and Kim103] although PZT-based composites have also been realized.[Reference Tang, Lin, Andrews and Sodano97] The use of nanorods of BaxSr(1−x)TiO3, the dielectric constant of which can be compositionally tuned to values of well over 1000, has also recently been demonstrated.[Reference Tang and Sodano98]
A key challenge in the development of high-energy density nanocomposites is the aggregation of ferroelectric nanoparticles due to the low surface energy of PVDF.[Reference Ducharme79] Nanocrystal aggregation results in electrical leakage pathways through the inorganic component and increases porosity in the polymer phase, both of which limit the attainable energy density. Much research has thus focused on improving the dispersal of the ferroelectric nanoparticles within the polymer matrix. Hydroxylation of BaTiO3 using a hydrogen peroxide treatment has been employed,[Reference Almadhoun, Bhansali and Alshareef99] and ethylene diamine functionalization has been used successfully for both BaTiO3 nanoparticles[Reference Li, Claude, Norena-Franco, Il Seok and Wang100] and high aspect ratio BaxSr(1−x)TiO3 nanorods.[Reference Tang and Sodano98] Functionalization with phosphonic acids[Reference Kim, Doss, Tillotson, Hotchkiss, Pan, Marder, Li, Calame and Perry101] has also recently been used in BaTiO3-based composites. A second approach to improving the dispersal relies on shielding the inorganic nanocrystals with polymer layers polymerized directly on the surfaces of particles. This approach has been employed for BaTiO3–PVDF composites using a polymer bilayer[Reference Xie, Huang, Huang, Yang and Jiang102] and for BaTiO3–polystyrene composites using block copolymer shells.[Reference Jung, Kang, Yang, Won and Kim103] Although particle dispersal and lowered breakdown voltages remain problematic, ferroelectric nanoparticle/polymer composites are already starting to yield impressive results, with some devices already exceeding the performance of commercial polypropylene-based capacitors. A recent report of an energy density of 14.86 J/cm3 (versus 1.2 J/cm3 at 640 MV/cm for a standard polypropylene device) suggests these nanocomposites are poised to overtake conventional technologies.[Reference Tang and Sodano98]
Emerging and future applications of nanoscale ferroelectrics
As existing technologies based on nanoscale ferroelectrics have matured, exciting new applications continue to emerge. The application of ferroelectric nanowires to force sensing in biological systems is a particularly intriguing area for future study. A few approaches to nanoscale biological force sensing have been previously devised, including a luminescent stress sensor based on CdSe/S tetrapods,[Reference Choi, Koski, Olson and Alivisatos104] but the strong piezoelectric properties of nanoscale ferroelectrics, which allow small forces to be converted into easily measurable electrical signals, appear ideally suited to measuring stresses exerted by cells on their surroundings. In a recent experiment, McAlpine and coworkers employed arrays of PZT nanoribbons to measure the small deformations of neurons due to triggered action potentials and stresses exerted in cow lung tissue during a mimicked respiration process (Fig. 10).[Reference Nguyen, Deshmukh, Nagarah, Kramer, Purohit, Berry and McAlpine5] Such devices could allow sensitive detection of biological processes at the single-cell scale. In addition, the use of mechanical-to-electrical signal transduction makes ferroelectrics well-suited to large-scale parallel devices integrated with existing CMOS technology.
The integration of ferroelectrics into nanophotonic devices may provide another fruitful area for future research. The large birefringence that accompanies the spontaneous polarization has already been exploited in two-dimensional plasmonic devices to create electrically controllable optical switches,[Reference Dicken, Sweatlock, Pacifici, Lezec, Bhattacharya and Atwater105] and perovskites have served as the basis for metamaterial superlenses operating in the THz regime.[Reference Kehr, Liu, Martin, Yu, Gajek, Yang, Yang, Wenzel, Jacob, von Ribbeck, Helm, Zhang, Eng and Ramesh106] The transparency of most ferroelectrics throughout the visible spectrum (and often into the UV region) also renders them suitable for nanophotonic applications. Ferroelectric nanowires could be employed as tunable or reconfigurable nanophotonic waveguides, and the large nonlinear coefficients of ferroelectrics make them ideal candidates for second harmonic generation and other nonlinear optical processes. Efficient second harmonic generation has already been demonstrated in individual LiNbO3 nanowires,[Reference Dutto, Raillon, Schenk and Radenovic107] and integration of LiNbO3 nanowires with a plasmonic metal has been proposed theoretically to harness plasmonic field enhancement for high conversion efficiencies.[Reference Lu, Li, Hu, Cheng, Zhu and Zhu108] Second harmonic generation in BaTiO3 nanocrystals has also been examined, and biofunctionalization of these materials could lead to new bioimaging applications.[Reference Le Dantec, Mugnier, Djanta, Bonacina, Extermann, Badie, Joulaud, Gerrmann, Rytz, Wolf and Galez109, Reference Kim, Steinbrück, Buscaglia, Buscaglia, Pertsch and Grange110] Vortex polarization states, if they could be realized experimentally, may have intriguing optical properties as well. It would be interesting to see if the inherent “handedness” of a vortex polarization state could lead to chiral optical properties, including circular dichroism.
Conclusions
The development of facile procedures for the synthesis of nanoscale ferroelectrics has yielded powerful new insights into the fundamental physics of ferroelectricity at reduced dimensions that continue to fuel new applications. On the fundamental front, our understanding of nanoscale ferroelectricity has evolved from an early picture focused on quenching of the polar state at finite dimensions to a new paradigm incorporating polarization inhomogeneity at nanometer length scales and even vortex-like polarization states. Meanwhile, on a practical front, nanoscale ferroelectrics have risen from academic curiosities to leading candidates for the next generation of nonvolatile memories, energy conversion and storage devices, and biosensors. Despite this immense progress over the last two decades, much work remains to achieve the level of synthetic control common for many semiconductors and metals, to use this synthetic control for rigorous studies of nanoscale ferroelectricity, and to integrate these materials into practical devices.
The development of techniques for producing monodisperse, monocrystalline nanomaterials with controlled shapes, sizes, and surface terminations appears to be the key challenge in the realm of synthesis. This level of synthetic control, common for many colloidal quantum dots, metal nanocrystals, and even magnetic complex oxides has thus far largely been elusive for ferroelectrics. The polydisperse aggregates with high defect densities and irregular morphologies typical of many ferroelectric nanomaterials hinders deconvolution of intrinsic physics from factors related to material processing and renders scalable device fabrication impractical. Recent progress on the synthesis of monodisperse BaTiO3 nanomaterials of controlled morphologies may spark rapid progress on synthesis, fundamental science, and applications as well.
New characterization tools, including atomic-resolution TEM and scanning-probe microscopes combining AFM/PFM with tip-enhanced Raman, may fuel new breakthroughs in fundamental understanding of nanoscale ferroelectricity. Single-particle studies at atomic resolution could soon resolve longstanding questions regarding the existence of monodomain vortex polarization states, the nature of the polar phase transition at finite dimensions, and polarization switching in nanomaterials. Nanoscale ferroelectrics appear poised to make exciting progress toward functional devices in the next few years as well. The limits of room-temperature ferroelectric switching have been pushed below the 10 nm limit, allowing for unprecedented information storage densities, ferroelectric nanogenerators have already begun finding applications in converting mechanical motion and waste heat into useful energy, and ferroelectric/polymer nanocomposites are on the cusp of overtaking conventional capacitor technologies. The tantalizing prospects of these technologies and outstanding fundamental questions promise to continue to fuel intense interest in nanoscale ferroelectrics for many years to come.