





Adolescence is a stage marked by growth and development, accompanied by increased autonomy over food choices, elevated nutrient requirements(Reference Neufeld, Andrade and Ballonoff Suleiman1) and a decline in overall diet quality(2). Snacking, or the consumption of foods at eating occasions (EO) between main meals, is common among adolescents(Reference Tripicchio, Croce and Coffman3), accounting for more than one-quarter of their daily energy intake(Reference Wang, van der Horst and Jacquier4). Although adolescent snacks often include energy-dense and nutrient-poor foods, nutrient-rich foods such as fruits and dairy(Reference Croce, Fisher and Coffman5) are also consumed and can help adolescents meet their elevated nutrient requirement and improve their overall diet quality(Reference Hess, Jonnalagadda and Slavin6). However, there is limited guidance for adolescents on snack consumption in food-based dietary guidelines internationally, despite an increase in intake of non-nutritious snacks among adolescents over the past decades(7–Reference Dunford and Popkin9). To provide tailored dietary guidance aimed at improving adolescents’ food choices at snacks, it is imperative to understand the factors shaping adolescent snacking behaviour.
A conceptual model by Story et al. (Reference Story, Neumark-Sztainer and French10) describes the individual, social-environmental, physical environmental and macrosystems factors affecting adolescent dietary behaviour. Individual factors include, but are not limited to, sex, age, race/ethnicity, perceived barriers to healthy eating and dietary preferences. Existing studies have reported mixed findings on sex differences in adolescent snacking, with some reporting higher snack frequency among girls and others among boys(Reference Dunford and Popkin9,Reference Tripicchio, Kachurak and Davey11,Reference Larson, Story and Eisenberg12) . Evidence on differences in snack characteristics by race and ethnicity is limited, although previous research among children (aged 5–7 years) suggests that the contribution of snacks to food group intake may vary across racial and ethnic groups(Reference Loth, Tate and Trofholz13).
Examples of social and physical environmental factors include socio-economic position, food insecurity and social support, where snacks are consumed and the source from which snacks are obtained(Reference Story, Neumark-Sztainer and French10). Studies examining socio-economic differences in adolescent snacking have produced inconsistent findings, possibly due to variation in how socio-economic position has been measured across studies(Reference Grenard, Stacy and Shiffman14–Reference Maruapula, Jackson and Holsten17). Evidence on food insecurity and adolescent snacking remains limited, although food insecurity with hunger has been associated with higher energy intake from snacks among adults in the USA(Reference Zizza, Duffy and Gerrior18). Previous studies from the USA and Canada suggest that adolescents commonly consume snacks at home and obtain them from grocery stores(Reference Tripicchio, Croce and Coffman3,Reference Vatanparast, Islam and Masoodi19) . However, few studies have examined how these factors are associated with the nutritional characteristics of snacks using methods (e.g. multilevel or mixed models) that account for the nested data structure (i.e. multiple snacks eaten across the day are nested within individuals) and thus provide accurate estimates of associations.
Previous studies exploring influences on adolescents’ snacking have mostly examined a limited range of individual and environmental factors in relation to a single characteristic of snacks, such as energy intake from snacks(Reference Tripicchio, Croce and Coffman3,Reference Vatanparast, Islam and Masoodi19) or snack frequency(Reference Dunford and Popkin9,Reference Larson, Story and Eisenberg15,Reference Fayet-Moore, Peters and McConnell20–Reference Casey, Huang and Talegawkar22) . However, snack frequency and energy intake from snacks do not capture the energy density (ED; kJ/g) or nutritional/food content of snacks. Hence, using a multilevel analysis approach, this study aimed to comprehensively investigate the individual (age, race and ethnicity), social-environmental (socio-economic position and food insecurity) and physical environmental factors (snacking location and source of snacks) associated with multiple snack characteristics (snack ED and foods consumed at snack) among a nationally representative sample of US adolescent boys and girls from the 2011 to 2018 National Health and Nutrition Examination Survey (NHANES).
Methods
Sample and study design
This cross-sectional study utilised nationally representative survey data from the 2011 to 2018 NHANES cycles, a nationally representative survey of the civilian, non-institutionalised US population. NHANES uses a complex, multistage probability sampling design, with survey procedures described in detail elsewhere(Reference Ahluwalia, Dwyer and Terry23,Reference Zipf, Chiappa and Porter24) . Written informed consent was obtained from parents of all adolescents aged 12–17 years, assent was obtained from adolescents aged 12–17 years and written informed consent was obtained from adolescents aged 18–19 years(25). The National Center for Health Statistics research ethics review board approved the study protocols(26). The data that support the findings of this study are available from the National Center for Health Statistics. Across the included cycles, 5215 adolescents participated, of whom 4686 completed the first 24-h dietary recall and were included in the present analysis.
Dietary assessment
Dietary data were obtained using two multiple-pass 24-h dietary recalls utilising the five-step multiple-pass approach, known as Automated US Department of Agriculture’s Automated Multiple-Pass Method(Reference Blanton, Moshfegh and Baer27–29). Initial dietary intake information was obtained through in-person interviews for the first 24-h period, followed by a second recall collected via telephone within a period of 3–10 d after the first recall. Participants were asked to specify the time of day they consumed each food and beverage and to classify each EO type using a predetermined list of categories. Additionally, participants were asked where they obtained the consumed food or beverage and whether it was consumed at home or elsewhere. Self-reported dietary data were obtained from adolescents aged 12–19 years. To maintain the national representativeness of the sample of adolescents, the dietary data collected from the first 24-h recall was used for the present analysis.
Snack definition
EO reported as ‘snacks’, ‘drinks’ or their Spanish equivalents were classified as snacks in the present study. Conversely, EO that the participant reported as ‘breakfast’, ‘brunch’, ‘lunch’, ‘supper’, ‘dinner’ or their Spanish equivalents were classified as meals. EO that were reported as ‘extended consumption’ or ‘other/don’t know’ were categorised as either meals or snacks if they occurred concurrently or within a 15-min window of the EO that the participant identified as a meal or snack(Reference Murakami and Livingstone30). EO with an energy intake of less than 50 kcal were excluded, and any EO that occurred within 15 min of each other were combined and treated as a single EO(Reference Leech, Spence and Lacy31). This approach, which is based on the participant’s identification of EO and the additional criteria of a 15-min time interval and a minimum energy intake of 50 kcal, has been shown to be the most effective in predicting variations in total energy intake among children and adolescents(Reference Leech, Spence and Lacy31).
Characteristics of snacks
The snack characteristics examined in this study were snack ED and food groups consumed at snacks.
Two methods were used to determine snack ED because there is no universally agreed-upon procedure for calculating ED, and existing approaches are commonly distinguished by whether beverages are included or excluded(Reference Vernarelli, Mitchell and Rolls32). Both ED measures were therefore applied to improve comparability with previous studies and to provide complementary information about snack composition. The first method included all foods and beverages, whereas the second method excluded liquids consumed as beverages in line with the method proposed by Vernarelli et al. (Reference Vernarelli, Mitchell and Rolls32). ED is influenced by various food components, such as macronutrient and water content. High water content has a strong influence on ED because water adds weight to a food or beverage without adding energy. Beverages are primarily made of water and tend to have lower ED than most foods, making ED calculations that include beverages less informative. This may make nutrient-rich beverages such as milk appear less favourable than sugar-sweetened beverages because milk fat increases ED despite its contribution of protein, Ca and other essential nutrients. However, the major difference between ED calculation methods is whether beverages are included or excluded. Examining both ED calculations ED including beverages and ED excluding beverages makes our findings comparable to previous studies and allows us to explore the role of different ED calculation methods in their association with cardiometabolic risk among adolescents. Specifically, beverages containing energy and those without energy were excluded, but tap water and milk (including non-dairy milk substitutes) were treated differently because they are often consumed as ingredients or as additional components in other food items (e.g. milk added to ready-to-eat cereals or tap water added to cooked cereals). Milk and water consumed as ingredients were included as foods in the ED calculations. To calculate the ED for each snack (including all foods and beverages, excluding beverages), the energy from each snack was divided by the corresponding weight to obtain the ED. We did not consider one ED measure to be the sole primary outcome; rather, both were examined to assess whether associations with individual, social-environmental and physical environmental factors differed depending on whether beverages were included in the calculation.
Foods consumed at snacks were categorised into the following food groups: vegetables, fruits, refined grains, whole grains, protein foods, dairy products and ‘snacks and sweets’. These food groups were selected because of their importance in the Dietary Guidelines for Americans and were used to examine individuals’ adherence to the Dietary Guidelines for Americans(7,Reference Krebs-Smith, Pannucci and Subar33) . These food groups were identified using the Food Pattern Equivalent Database (vegetable, fruit, refined grain, whole grain, protein and dairy products) and the What We Eat in America food groups (snacks and sweet foods groups)(34,Reference Bowman, Clemens and Friday35) . For each snack, the intake amount (g) of these food groups was estimated.
The factors potentially influencing adolescent snacking behaviour were identified based on the conceptual model by Story et al. (Reference Story, Neumark-Sztainer and French10). This model included individual, social-environmental and physical environmental factors Adolescents were asked to report information related to these factors during an in-person interview, although some information was provided by adults.
For individual factors, sex was reported by participants as ‘boy’ or ‘girl’. Age was reported in complete years. Participants self-identified their racial/ethnic group (Mexican American, non-Hispanic White, Other Hispanic, non-Hispanic Black and other race, including multi-racial).
Social-environmental factors included socio-economic position and food insecurity. The measure of a family’s socio-economic position was assessed using the ratio of family income to poverty, which was calculated using information obtained from an adult on the family’s income. The poverty threshold refers to the minimum income level that a family must earn to avoid living in poverty. This ratio is obtained by dividing the family’s total income by the adjusted federal poverty threshold index, which considers family size. The family poverty:income ratio (PIR) is categorised as (a) <125 % and (b) ≥125 %, representing above and below the poverty thresholds for determining eligibility to receive government assistance(36). An adult was interviewed during a household interview using the US Household Food Security/Hunger Survey Module (US-FSSM)(Reference Bickel, Nord and Price37) which included eighteen questions for households with children and adolescents below 18 years of age. Based on their responses, the food security status of the household was classified into four categories: (a) child full or marginal food security, (b) child marginal food security, (c) child low food security and (d) child very low food security.
Physical environmental factors included snacking location and source of food and beverage consumed at snacks. Information on location of consumption and source of foods and beverages was collected for each EO reported in the 24-h recall. The location of snack consumption was used to identify, whether a snack was consumed at home or elsewhere. The source of foods and beverages was categorised into seven categories from the initial source of food and beverages list: (1) grocery store; (2) convenience store; (3) school and childcare centres; (4) restaurants including fast food and full service; (5) social, which include food and beverage obtained from someone else gift; (6) vending machines and (7) community/ all other options (Supplementary File 1).
Covariates
The data release cycle was used as a covariate to account for changes in snack characteristics and source of snacks that might be attributed to changes over the years. Data release cycle includes the follows survey cycles as categories: (1) 2011–2012; (2) 2013–2014; (3) 2015–2016 and (4) 2017–2018.
Analytical sample
Of the 2370 boys and 2316 girls who had reliable first 24-h dietary recalls, 1055 of them were excluded because they did not report consuming snacks in their recall. The final analytical sample included 1835 boys and 1796 girls.
Data analysis
All statistical analyses were performed using the appropriate NHANES person and replicate weights to account for the probability of selection and complex sampling design(38). Descriptive statistics were performed using proportions and means with corresponding 95 % CI for categorical variables and continuous variables, respectively. The mean difference was tested using an F-test, whereas the differences in proportions were tested using the chi-square test.
Separate multilevel linear regression models were used to examine the associations for snack ED and snack food group consumption outcome variables with individual factors (age, race and ethnicity), socioenvironmental factors (socio-economic position and food security status) and physical environmental factors (location of snack consumption, source of food and beverage consumed at snack) (independent variables), stratified by sex. The multilevel model was used because of the nature of the data structure, in which multiple snacks (and therefore multiple estimates of snack ED and food group consumption) at different time points of the day were observed within an individual. The first level in this model and all following models included EO-level characteristic variables (the source of the snack and location of snack consumption), whereas the second level included person-level variables (age, race and ethnicity, socio-economic position, food insecurity status and data release cycle). For the snack food group consumption outcomes only, a two-part model option was also specified to account for the excessive zeros resulting from the non-consumption of specific food groups at a single snack occasion(Reference Ruf, Neubauer and Ebner-Priemer39). The first part of the two-part model was a multilevel logistic regression, where the dependent variable (binary) was consumption of a particular food group at snacks (yes/no). The second part was a multilevel linear regression, where the dependent variable was the amount consumed from a particular food group at the snack among consumers of that food group only. The food groups consumed at snacks were log-transformed to meet the assumption of normality. Model assumptions were checked and found to be met, including an assessment of multicollinearity. Statistical significance was set at P < 0·05.
In a sensitivity analysis, the distribution of snack ED and food groups consumed at snacks across PIR categories, sources of snacks and location of snack consumption for boys and girls were assessed (Supplementary File 3). Due to missing values in the PIR, 158 boys and 150 girls were not included in all the models described above. Differences in adolescents’ characteristics and snack characteristics among those excluded from all models due to missing PIR values and those without missing PIR values were examined (Supplementary File 3).
As part of the sensitivity analysis, we also used multilevel models to examine if using 5 kcal energy criterion for defining snacks influenced the associations between individual, social-environmental and physical environmental factors and snack characteristics. We used this criterion as it is commonly applied to exclude water and other very low-energy beverages(Reference Tripicchio, Bailey and Davey40). The models followed the same structure as those described earlier, with snacks defined using the 5 kcal criterion (Supplementary File 4).
Results
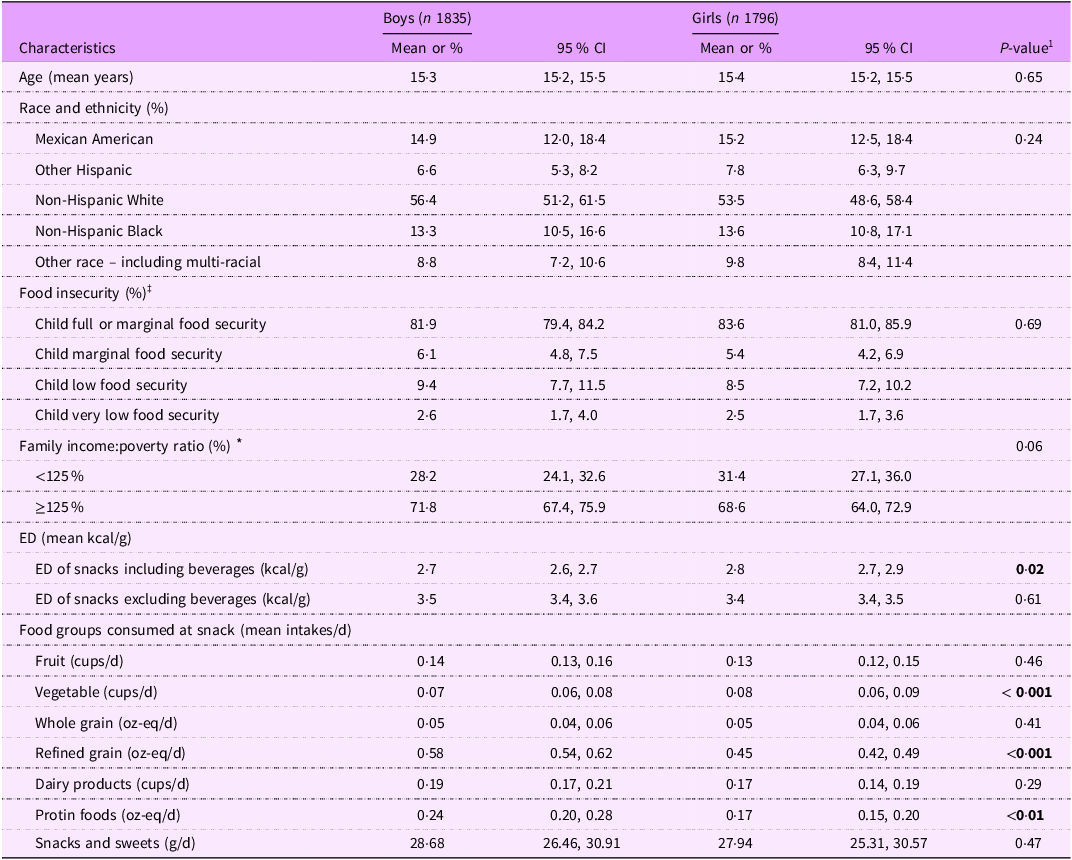
Table 1 presents the characteristics of adolescent boys and girls in the NHANES 2011–2018. There were no significant differences in age, race and ethnicity, food insecurity or PIR between boys and girls. Girls had a higher ED of snacks, including beverages, and consumed more vegetables at snacks than boys. However, boys consumed more refined grains and protein foods at snacks than girls.
Characteristics of adolescents (12–19 years) in NHANES 2011–2018

Table 1. Long description
The table compares characteristics of adolescent boys and girls in NHANES 2011-2018. It has 18 rows and 10 columns. The columns are Characteristics, Boys (n 1835) Mean or %, Boys (n 1835) 95 % CI, Girls (n 1796) Mean or %, Girls (n 1796) 95 % CI, and P-value. The rows are Age (mean years), Race and ethnicity (%), Mexican American, Other Hispanic, Non-Hispanic White, Non-Hispanic Black, Other race - including multi-racial, Food insecurity (%), Child full or marginal food security, Child marginal food security, Child low food security, Child very low food security, Family income: poverty ratio (%), <125 %, ≥125 %, ED (mean kcal/g), ED of snacks including beverages (kcal/g), ED of snacks excluding beverages (kcal/g), Food groups consumed at snack (mean intakes/d), Fruit (cups/d), Vegetable (cups/d), Whole grain (oz-eq/d), Refined grain (oz-eq/d), Dairy products (cups/d), Protein foods (oz-eq/d), Snacks and sweets (g/d).
NHANES, National Health and Nutrition Examination Survey; ED, energy density.
Values are presented as survey-weighted means or percentages with 95 % CI unless otherwise indicated.
1 P-value for differences between boys and girls based on F-test (continuous variable) or chi-square test (categorical variables).
‡ Boys, n 1798; girls, n 1759
* Boys, n 1677; girls, n 1646
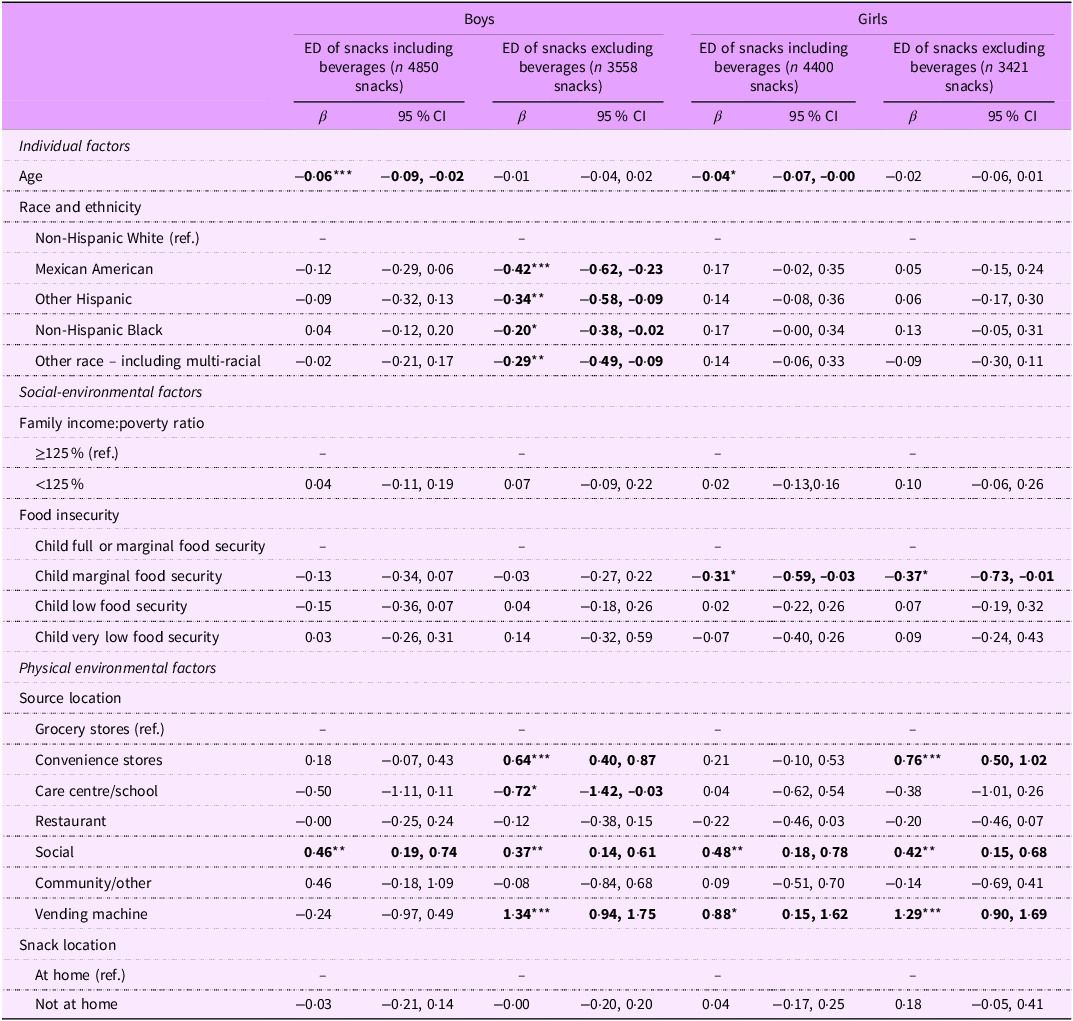
Table 2 shows the results of multilevel linear regression that examined the relationship between individual, social-environmental and physical environmental factors associated with snack ED. Compared to adolescents who reported being non-Hispanic White, those from other racial and ethnic groups consumed snacks with lower ED (excluding beverages). Furthermore, compared to girls with full or marginal food security, those with marginal food security consumed snacks with lower ED. Among both boys and girls, snacks obtained from convenience stores, vending machines and social sources had higher ED than those obtained from grocery stores. Compared to adolescent boys who obtained snacks from grocery stores, those who obtained their snacks from care centres/schools had lower ED. In addition, among boys and girls, the ED of snacks excluding beverages was higher when snacks were obtained from convenience stores.
The association between individual, social-environmental and physical environmental factors with snack energy density among adolescents (12–19 years) in NHANES 2011–2018

Table 2. Long description
The table presents the results of multilevel linear regression examining the relationship between individual, social-environmental, and physical environmental factors associated with snack energy density (ED) among adolescents aged 12-19 years. The table is divided into four main columns: Boys ED of snacks including beverages, Boys ED of snacks excluding beverages, Girls ED of snacks including beverages, and Girls ED of snacks excluding beverages. Each column includes beta coefficients (β) and 95% confidence intervals (CI) for various factors. Individual factors include age and race/ethnicity. Social-environmental factors include family income-to-poverty ratio and food insecurity levels. Physical environmental factors include source location and snack location. Notable trends include lower snack ED among non-Hispanic White adolescents compared to other racial and ethnic groups, and higher snack ED from convenience stores, vending machines, and social sources compared to grocery stores. Among boys, snacks from care centers/schools had lower ED. The table provides detailed insights into how different factors influence snack ED among adolescents.
NHANES, National Health and Nutrition Examination Survey; ED, energy density.
These results, obtained from multilevel linear regression, were further adjusted for age, race, ethnicity and survey cycle.
P-values: *P < 0.05, **P < 0.01, ***P < 0.001.
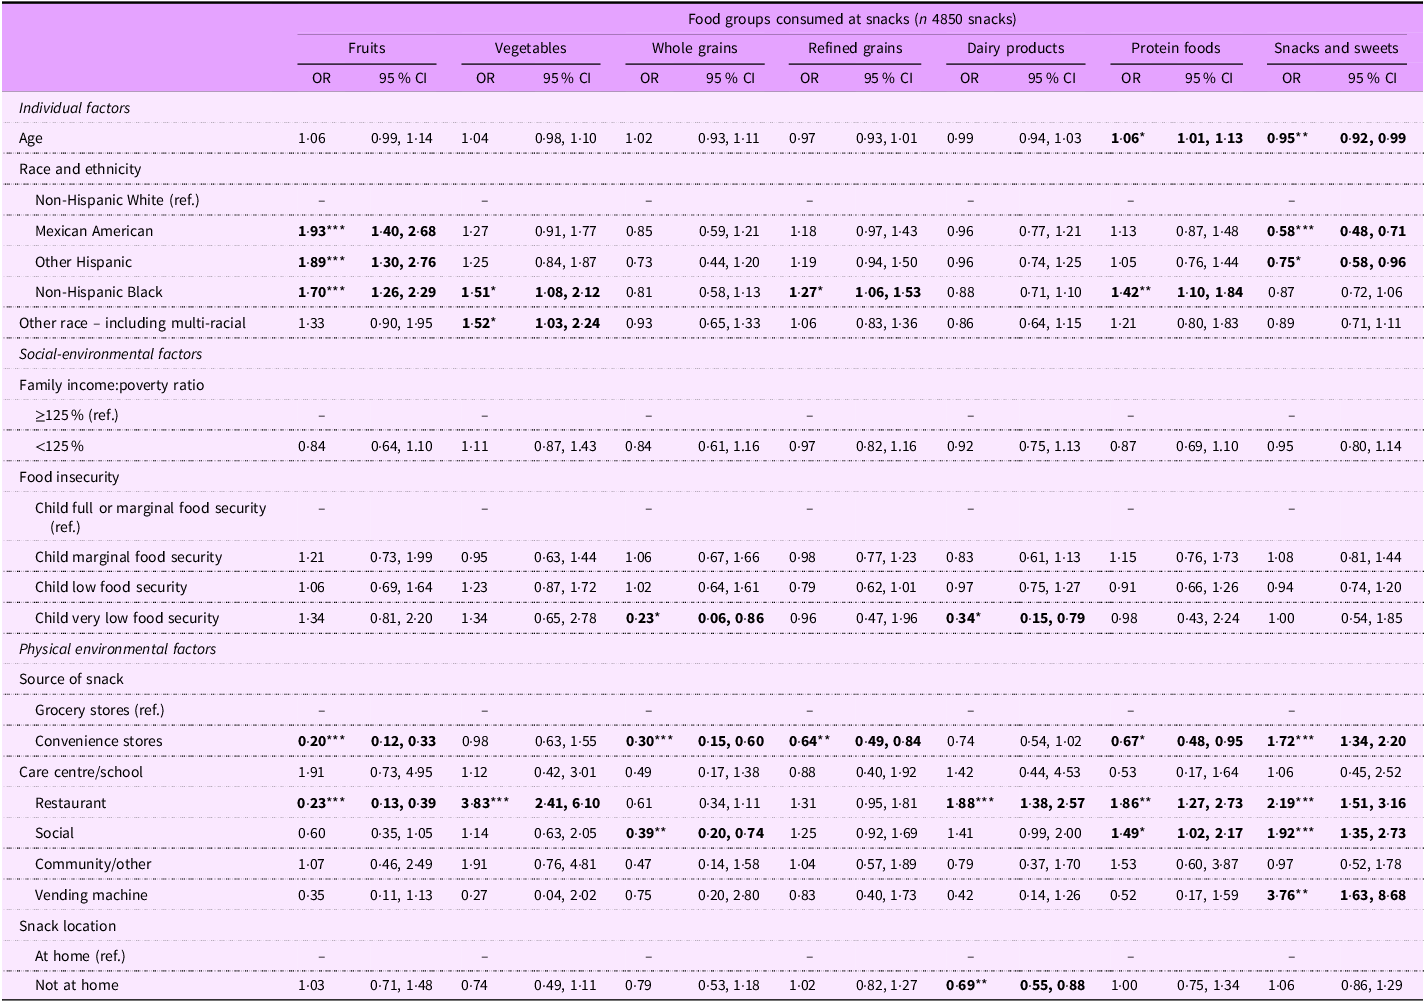
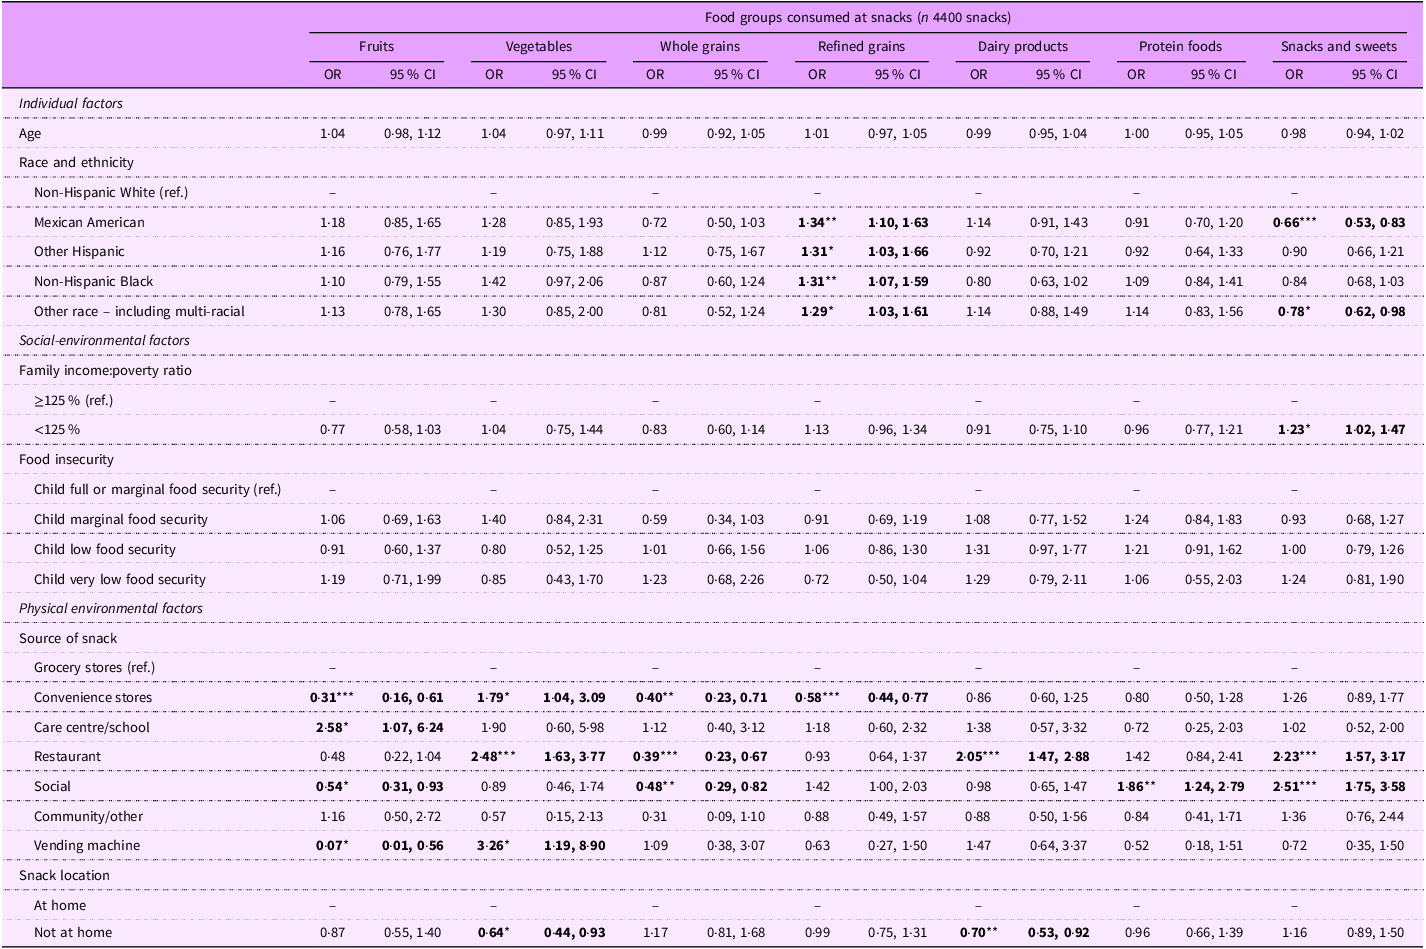
Tables 3 and 4 show the results of multilevel logistic regression (i.e. first part of the two-part model) among boys and girls consecutively exploring the relationship between individual, social-environmental and physical environmental factors and food group consumption at snacks. There was no association between age and probability of consumption of food groups at snacks among boys and girls, except among boys consuming protein foods and ‘snacks and sweets’ (e.g. savoury snacks, crackers, snack/meal bar, sweet bakery products, candy and other desserts). The odds of consuming fruit at snacks were lower among Mexican American boys, non-Hispanic Black boys and other Hispanic boys compared to non-Hispanic White boys. Non-Hispanic Black boys had higher odds of consuming protein foods and refined grains at snacks compared to non-Hispanic White boys. Compared to non-Hispanic White girls, those from the other racial and ethnic groups had higher odds of consuming refined grains at snacks.
The association between individual, social-environmental and physical environmental factors with the probability of food group consumption at snacks among adolescent boys (12–19 years) in NHANES 2011–2018

Table 3. Long description
The table presents the results of multilevel logistic regression analyzing the relationship between various factors and food group consumption at snacks among adolescent boys. It includes columns for different food groups such as Fruits, Vegetables, Whole grains, Refined grains, Dairy products, Protein foods, and Snacks and sweets. Each column contains odds ratios (OR) and 95% confidence intervals (CI) for different factors. The factors are categorized into individual factors (Age, Race and ethnicity), social-environmental factors (Family income/poverty ratio, Food insecurity), and physical environmental factors (Source of snack, Snack location). The table has 4850 snacks analyzed. Each row provides the OR and CI for each food group consumption based on the specified factors. Notable trends include lower odds of consuming fruits among Mexican American, non-Hispanic Black, and other Hispanic boys compared to non-Hispanic White boys, and higher odds of consuming protein foods and refined grains among non-Hispanic Black boys.
NHANES, National Health and Nutrition Examination Survey.
These results, obtained from the first part (e.g. multilevel logistic regression) of two-part models, were further adjusted for age, race, ethnicity and survey cycle.
P-values: *P < 0.05, **P < 0.01, ***P < 0.001.
The association between individual, social-environmental and physical environmental factors with the probability of food group consumption at snacks among adolescent girls (12–19 years) in NHANES 2011–2018

Table 4. Long description
A table with 4400 snacks consumed across different food groups by adolescent girls aged 12-19 years. The table has 10 columns: Food groups consumed at snacks, Individual factors, Social-environmental factors, Physical environmental factors, Age, Race and ethnicity, Family income/poverty ratio, Food insecurity, Source of snack, Snack location, and 8 rows for different food groups: Fruits, Vegetables, Whole grains, Refined grains, Dairy products, Protein foods, Snacks and sweets. Each cell contains odds ratios (OR) and 95% confidence intervals (CI) for different factors affecting the consumption of each food group. The table explores the relationship between individual, social-environmental, and physical environmental factors and the probability of consuming various food groups at snacks.
NHANES, National Health and Nutrition Examination Survey.
These results, obtained from the first part (e.g. multilevel logistic regression) of two-part models, were further adjusted for age, race, ethnicity and survey cycle.
P-values: *P < 0.05, **P < 0.01, ***P < 0.001.
When snacks obtained from convenience stores were compared to those obtained from grocery stores, there were lower odds of consuming fruits, whole grains and refined grains among boys and girls. Conversely, there were a higher odd of consuming vegetables among girls and ‘snacks and sweets’ among boys at snack. Moreover, there were higher odds of consuming vegetables, dairy products and foods from the ‘snacks and sweets’ group at snacks that were obtained from restaurants, compared to grocery stores. Girls also had higher odds of consuming vegetables at snacks obtained from vending machines, compared to grocery stores. Further exploration of the data shows that vegetables obtained from vending machines included potato chips and plantain chips, which are counted as vegetables in the Food Pattern Equivalent Database(Reference Bowman, Clemens and Shimizu41). Adolescent boys and girls had lower odds of consuming dairy products outside their homes. In addition, there was no association between any of the food groups consumed at snacks and PIR categories, except for ‘snacks and sweets’ among girls. Adolescent boys with very low food security have lower odds of consuming whole grain and dairy products compared to those with full or marginal food security.
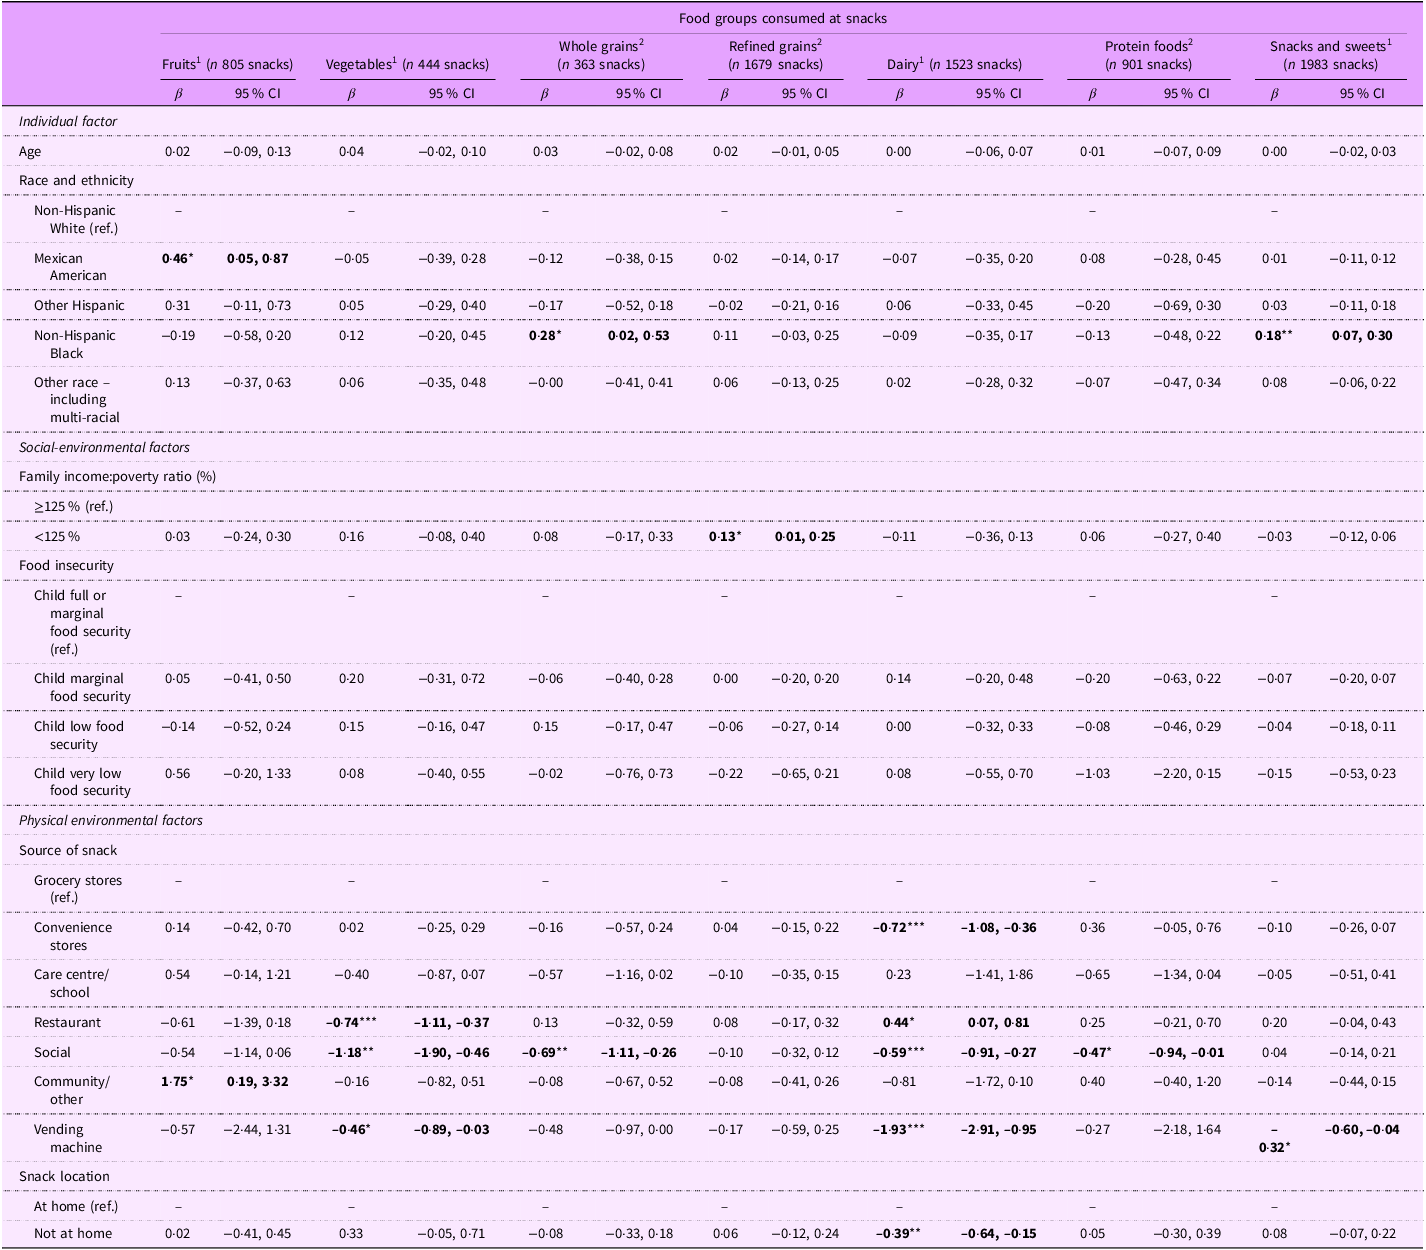
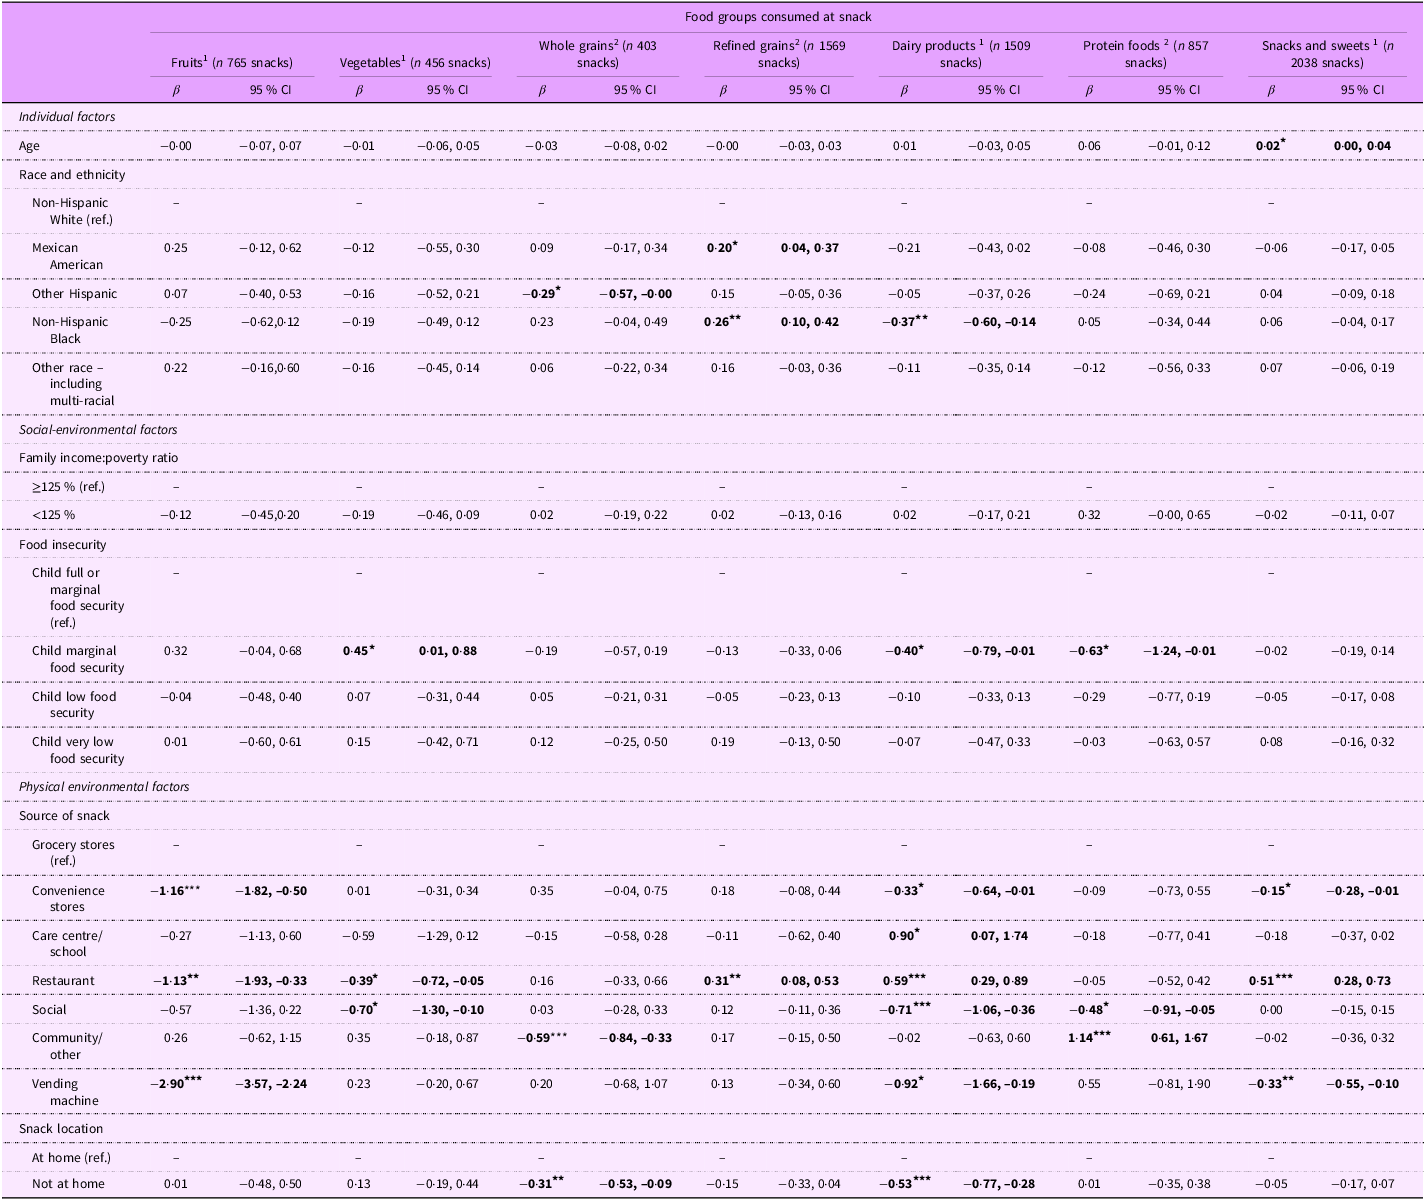
Tables 5 and 6 show the association between individual, social-environmental and physical environmental factors with the amount of food groups consumed at snacks among adolescents (among those who consumed from the food groups at snacks – i.e. second part of the two-part model). There was no association between age and food groups consumed at snacks among boys and girls, except for ‘snacks and sweets’ for girls. There was a higher consumption of fruit among Mexican American boys, whereas higher consumption of whole grains and ‘snacks and sweets’ at snacks were observed among non-Hispanic Black compared to non-Hispanic White boys. Among girls, lower consumption of dairy products and whole grains consumptions at snack were observed among non-Hispanic Black and non-Hispanic girls. Among boys and girls, there were no associations between the amount consumed from food groups at snack and PIR except for refined grain among boys. Among girls only, those with marginal food security had a lower consumption of dairy foods and protein foods and a higher consumption of vegetables at snacks compared to those with full or marginal food security.
The association between individual, social-environmental and physical environmental factors with the amount of food groups consumed at snacks among adolescent boys (12–19 years) in NHANES 2011–2018

Table 5. Long description
The table presents the association between individual, social-environmental, and physical environmental factors with the amount of food groups consumed at snacks among adolescent boys aged 12-19 years. It includes data from NHANES 2011-2018. The table has 10 columns and 20 rows, with column headers including different food groups and row labels for various factors. Each cell contains beta values and 95% confidence intervals. Key factors include age, race and ethnicity, family income-to-poverty ratio, food insecurity, and the source of the snack. Notable trends include higher consumption of fruits among Mexican American boys and higher consumption of whole grains and snacks and sweets among non-Hispanic Black boys compared to non-Hispanic White boys. There is no association between age and food groups consumed at snacks among boys, except for snacks and sweets. The table provides detailed insights into the dietary habits of adolescent boys based on various influencing factors.
NHANES, National Health and Nutrition Examination Survey.
1 Cup eq.
2 Oz eq.
These results, obtained from multilevel liner regression, were further adjusted for age, race, ethnicity and survey cycle.
Food groups consumed at snacks were log-transformed to improve normality. The format for interpretation of the β-coefficient estimates is therefore 100 × (coefficient), corresponding to the percentage change for a 1-unit increase in the independent variable (while holding all other variables constant).
P-values: *P < 0.05, **P < 0.01, ***P < 0.001.
The association between individual, social-environmental and physical environmental factors with the amount of food groups consumed at snacks among adolescent girls (12–19 years) in NHANES 2011–2018

Table 6. Long description
The table presents data on the association between various factors and the consumption of different food groups at snacks among adolescent girls. It includes individual factors such as age, race, and ethnicity, social-environmental factors like family income-poverty ratio and food insecurity, and physical environmental factors such as the source of snack and snack location. The table has 10 columns and 20 rows, with column headers including different food groups like fruits, vegetables, whole grains, refined grains, dairy products, protein foods, and snacks and sweets. Row labels include factors like age, race and ethnicity, family income-poverty ratio, food insecurity, and source of snack. Each cell contains beta values and 95% confidence intervals. Notable trends include higher consumption of whole grains and snacks and sweets among non-Hispanic Black girls compared to non-Hispanic White girls, and lower consumption of dairy products and protein foods among girls with marginal food security.
NHANES, National Health and Nutrition Examination Survey.
1 Cup eq.
2 Oz eq.
These results, obtained from multilevel liner regression, were further adjusted for age, race, ethnicity and survey cycle.
Food groups consumed at snacks were log-transformed to improve normality. The format for interpretation of the β-coefficient estimates is therefore 100 × (coefficient), corresponding to the percentage change for a 1-unit increase in the independent variable (while holding all other variables constant).
P-values: *P < 0.05, **P < 0.01, ***P < 0.001.
When snacks were sourced from convenience stores, compared to grocery stores, adolescent boys and girls tended to consume fewer dairy foods, fruits (girls only) and foods from the ‘snacks and sweets’ group (girls only). Lower consumption of dairy foods and fruit and vegetables at snacks was observed for boys and girls when snacks were obtained from vending machines, compared to grocery stores. In both sexes, lower consumption of vegetables and higher consumption of dairy foods was observed at snacks obtained from restaurants. However, dairy foods intakes were higher at snacks that were consumed at home, compared to away from home.
Discussion
This study investigated whether individual (sex, age and race/ethnicity), social-environmental (socio-economic position and food insecurity) and physical environmental (snacking location and source of snacks) factors were associated with snack characteristics (snack ED and food groups consumed at snack) among a nationally representative sample of US adolescents aged 12–19 years. The findings indicated strong associations for snack ED and food groups consumed at snacks with the source of snacks. In contrast, few or only weak associations were observed for location of consumption, individual factors and social-environmental factors. This suggests that the source of snacks may be an important determinant of snacking behaviour in adolescents. Public health interventions targeting convenient stores and vending machines, as their primary focus, may therefore encourage healthier snack food choices in this population group
We found significant associations for food groups consumed at snacks and snack ED with source of snack among boys and girls. Snacks obtained from convenience stores, vending machines and social sources (from someone else) were more energy-dense than snacks obtained from grocery stores. Moreover, boys and girls were less likely to consume fruits at snacks obtained from convenience stores and vending machines. However, no association was observed between the ED of snacks, including beverages, and snacks obtained from vending machines (among boys) or convenience stores (among both boys and girls). This discrepancy in the association between snack ED, including and excluding beverages, may be influenced by how commonly consumed beverages, such as soft drinks and milk, are treated differently in these two ED calculations. This finding is in line with evidence that convenience stores and vending machines are major sources of energy-dense and nutrient-poor snack choices and offer fewer nutritious foods including fruit and dairy products(Reference Grech and Allman-Farinelli42). Thus, novel healthy snack options that are appealing, ready-to-eat, and have packaging that makes them suitable to be purchased in convenience stores and vending machines might promote the consumption of nutrient-dense snacks among adolescents(Reference Nørgaard, Sørensen and Brunsø43). A systematic review by Grech and Allman-Farinelli(Reference Grech and Allman-Farinelli42) showed that pricing and availability strategies are effective at improving the nutritional quality of foods purchased from vending machines. However, interventions using point-of-purchase nutritional information resulted in only small changes in improving the nutritional quality of foods purchased from vending machines. Interventions aimed at improving adolescents’ snack nutrition quality by targeting vending machines should also consider strategies such as increasing the availability or reducing the prices of healthier choices(Reference Grech and Allman-Farinelli42).
Adolescents had higher odds of consuming ‘snack and sweets’, and protein foods at snack when obtained from social sources (from someone else) compared to grocery stores. In contrast, girls had lower odds of obtaining vegetables and whole grains from social sources at snacks. These findings may indicate the influence of peers or close social circles on adolescents’ snack choices. A study conducted by Gangrade et al. (Reference Gangrade, St Fleur and Leak44) showed that adolescents who snack with their families had healthier snacks. Moreover, a study of adolescents found that the food purchaser has a significant effect on both their diet quality and food group consumption. When adolescents independently decide what to purchase, they generally consume less healthy foods than those whose purchasing is more overseen by parents or caregivers(Reference Shaw, Crozier and Cooper45). Additionally, Loth et al. (Reference Loth, MacLehose and Larson46) demonstrated that healthier parental modelling was negatively associated with adolescent soda consumptions, a common beverage choice at snacks among adolescents. Future studies examining adolescent snacking should aim to include information on who purchased the food consumed at snack.
The findings of the present study showed dairy foods were less likely to be consumed at snacks outside the home, and among those who did consume dairy foods at snacks, lower amounts were consumed when outside the home compared to when at home. Dairy foods usually require refrigeration, and yoghurts are typically consumed with a spoon which make them a less convenient option to eat on the go. Moreover, sources of food that are convenient to access while on the go (e.g. vending machines), contain fewer dairy foods; an examination of vending machines in US schools showed that less than 5 % of them contained dairy foods(Reference Merlo, Tiu and Demissie47). In addition, an analysis of the 2015–2018 NHANES showed that only 4 % of adolescents purchased milk from convenience stores(Reference Morton, Rhodes and Moshfegh48). Except for dairy foods, this study found no association between snack ED and most food groups consumed at snacks with location of consumption which might be due to how consumption location was measured. In the NHANES dietary data collection, all locations outside the home were combined into a single category, despite large variability in locations where different types of snacks may be consumed. For example, a study of Norwegian adults observed a significant variation in energy and macronutrients from snacks across location of consumption, when a variety of out-of-home sources were considered (visiting private households, work, restaurants and travels/meetings)(Reference Myhre, Loken and Wandel49). Future studies examining adolescent snacking should aim to include locations that are most frequented by adolescents, such as schools, visiting private households, in the car/on public transport, restaurants and recreational places.
Currently, there is limited evidence of the associations between individual factors and snacking characteristics(Reference Loth, Tate and Trofholz13). Among both boys and girls, increasing age was associated with lower snack ED when beverages were included, but not when beverages were excluded. This may partly reflect age-related differences in beverage consumption at snack occasions, as NHANES analyses have shown that sugar-sweetened beverage(Reference Rosinger, Herrick and Gahche50,Reference Maillot, Vieux and Rehm51) intake increases with age across childhood and adolescence, while a separate US study reported a similar age-related increase in energy drink consumption(Reference Kumar, Park and Onufrak52). Because beverages add substantial weight and water content, greater beverage consumption among older adolescents may lower snack ED when beverages are included in the calculation. In addition, we observed a weak positive association between age and the consumption of the ‘snacks and sweets’ food group among girls and the consumption of fruits, dairy foods and ‘snacks and sweets’ varied by sex and race and ethnic groups. For example, we found a higher consumption of whole grains and refined grains among boys and girls, respectively, and lower consumption of dairy foods at snacks among non-Hispanic Blacks and are in line with a previous study of US children(Reference Loth, Tate and Trofholz13). Loth et al. (Reference Loth, Tate and Trofholz13) observed lower dairy consumption among non-Hispanic Blacks and lower intake of seafood and plant protein intake at snacks among girls. These findings suggest that interventions aimed at improving adolescent snacking may need to be tailored to boys, girls, race and ethnicity. The significant associations between race and ethnicity and snack ED among boys were observed only when beverages were excluded from the ED calculation, suggesting that these differences may reflect variation in the solid food component as snacks rather than differences in beverage-inclusive snack occasions.
Socio-economic position has long been identified as one of the major drivers of adolescent diet(Reference Story, Neumark-Sztainer and French10). This study, however, found few associations between snack ED, food groups consumed at snacks and socio-economic position, as measured by PIR. Girls from households with <125 % PIR had higher odds of consuming ‘snacks and sweets’ compared to girls from households with ≥125 % PIR, which is in contrast to a study by Gangrade et al. (Reference Gangrade, Figueroa and Leak21), who reported lower odds of consuming ‘snacks and sweets’, dairy products and fruit at snacks among US adolescents from households with a low PIR (≤ 130 %) than those from households with PIR > 350 %. Our analysis was stratified by sex, whereas the study by Gangrade et al. (Reference Gangrade, Figueroa and Leak21) adjusted for sex, which may also help explain the different findings. Given the limited studies examining the role of socio-economic position on snack characteristics among adolescents using, further studies should investigate the relationship between snack characteristics and socio-economic status, incorporating multiple measures of socio-economic position such as parent education, occupation and income to achieve a comprehensive understanding of this association. Understanding the role of socio-economic position in adolescent snacking will guide the development of tailored interventions to promote healthier food choices at snacks.
Few studies have examined food insecurity in relation to adolescents’ snacking. A study by Prapkree et al. (Reference Prapkree, Uddin and Jaafar53) showed that individuals who were food-secure consumed fewer chips, crackers, cookies, candy, chocolate, etc., at snacks than those who were food-insecure. However, the findings from our study showed that girls experiencing marginal food security consumed snacks with lower ED and fewer dairy products and protein foods, compared to those who were food-secure. In addition, boys experiencing very low food security had lower odds of consuming whole grains and dairy foods as snacks. We found no consistent associations for food insecurity categories with ED of snacks or food groups consumed at snacks. Given the literature indicating that almost three-quarters of adolescents in the USA consume energy-dense and nutrient-poor snacks, it is possible that snack ED and food groups consumed at snack may not be influenced by food insecurity(Reference Gangrade, Figueroa and Leak21). Overall, the lack of consistent associations between individual factors, socio-environmental factors and snack characteristics in the present study suggest that other factors may be more influential, such as adolescents’ food preferences, peer influence, who purchases foods consumed at snack, food advertising and the broader food environment(Reference Story, Neumark-Sztainer and French10).
This study contributes novel evidence regarding the influence of sources of snack foods on snack ED and the types of foods consumed at snacks among adolescents. This study also employed multilevel analyses, which accounts for the nested data structure, to assess associations for a wide range of individual and environmental factors with multiple snack characteristics in a large and nationally representative sample of US adolescents. However, the present study did not consider other potentially important factors on adolescents’ snacking such as who purchases the foods consumed at snack, food preference, peer influence and macrosystem factors (e.g. cultural norms, social norms, food production and distribution systems, food accessibility and availability), and different location types. These factors were not explored because of their unavailability in the NHANES data. There is a lack of consensus on how to define snacks in research(Reference Leech, Spence and Lacy31). The different approaches and energy criteria used to identify snacks may influence the observed associations between snack characteristics, individual, social-environmental and physical environmental factors(Reference Leech, Spence and Lacy31). To address this issue, we conducted a sensitivity analysis using an alternative snack definition with a lower energy criterion of > 5 kcal and found only small differences in results that did not alter our overall conclusions. For this study, dietary data were collected using multiple-pass 24-h dietary recalls, which is subject to energy misreporting(Reference Murakami and Livingstone54). For example, commonly underreported foods in 24-h recalls have been shown to be those often consumed at snacks, particularly in the afternoon. This might have impacted the relationship between factors influencing adolescent snacking and snack characteristics by underestimating the snack food groups and, therefore, also snack ED(Reference Gemming and Ni Mhurchu55).
Conclusion
In conclusion, snack ED and food groups consumed at snacks were associated with the source of snacks among adolescents. Few associations with snack characteristics were found for PIR, food insecurity and snack consumption location. Interventions aimed to improve adolescents’ snacks should target the sources of snacks, including availability of nutritious snacks in common sources of snacks. Further studies on adolescent snacking should explore factors such as food preference, influence of peers and family, food access, food advertisement, different consumption locations outside of home and macrosystem factors.
Supplementary material
For supplementary material accompanying this paper visit https://doi.org/10.1017/S1368980026103887.
Author contributions
BGS: writing – original draft, methodology, formal analysis, conceptualisation. KEL: writing – review and editing, methodology, supervision, conceptualisation. SAM: writing – review and editing, methodology, supervision, conceptualisation. RML: writing – review and editing, methodology, supervision, conceptualisation.
Financial support
BGS is supported by Deakin University Postgraduate Research Scholarship (DUPR). RML is supported by National Health and Medical Research Council Emerging Leadership Fellowship L1 (APP1175250). The funders had no role in study design, data collection and synthesis, decision to publish and preparation of the manuscript.
Competing interests
RML is currently a statistical editor of the Public Health Nutrition.
Ethical standards
In this study, non-identifiable data were used for secondary analysis. The Deakin University Human Research Ethics Committee (DUHREC) approved an exemption from ethics review for this study under application number 2023-193.


 Open access

