Introduction
Long-term studies in rainfed environments have shown a significant effect of environmental conditions on yield. Noteworthy in the literature is the variability of N response over sites and years. Reports on one side indicate that as yield levels increase, the demand for nutrients also increases (Ciampitti and Vyn, Reference Ciampitti and Vyn2014). On the contrary, in a meta-analysis of agronomic efficiency (AE) data published from studies in sub-Saharan Africa, Vanlauwe et al. (Reference Vanlauwe, Kihara, Chivenge, Pypers, Coe and Six2011) identified regions where the fertilizer response is low – or zero. Similarly, crop production in temperate regions, rainfed conditions and no-till management, N fertilization has shown to be relatively less important (Lundy et al., Reference Lundy, Pittelkow, Linqiuist, Liang, van Groenigen, Lee, Six, Ventera and van Kessel2015). Indeed, long-term trials have demonstrated that failure to apply N fertilizer does not show continuous yield reduction (Johnson and Raun, Reference Johnson and Raun2003). On the other hand, Arnall et al. (Reference Arnall, Mallarino, Ruark, Varvel, Solie, Stone, Mullock, Taylor and Raun2013) further demonstrated the randomness and inconsistency of N response over time in all long-term. Therefore, serious consideration must be given to non-responsive soils to N as N fertilization could be omitted for several seasons without detrimental effects on yield. Under such conditions, indigenous N from soil organic matter (SOM) supplies most of the N to growing crops (Goulding et al., Reference Goulding, Jarvis and Whitmore2008). This supply is then bound to the understanding that rainfall in dryland crop-producing areas is one of the primary drivers of soil nutrient availability (Ryan et al., Reference Ryan, Sommer and Ibrikci2012; Arnall et al., Reference Arnall, Mallarino, Ruark, Varvel, Solie, Stone, Mullock, Taylor and Raun2013). On account of the preceding, this study was conducted in non-responsive soil to N under permanent beds to test the effect of P fertilizer application on rainfed wheat.
Phosphorus is a non-renewable resource and is the second most limiting nutrient in crop production after N (Dhillon et al., Reference Dhillon, Torres, Driver, Figueiredo and Raun2017). Many of the world's agricultural soils with naturally low P availability are in developing country regions (Cordell and White, Reference Cordell and White2013). Alternatively, a recommended management strategy is applying foliar P (Dhillon et al., Reference Dhillon, Torres, Driver, Figueiredo and Raun2017). As suggested for other regions, this fertilization strategy can substitute for the much larger soil-applied P rates (Withers et al., Reference Withers, Sylvester-Bradley, Lones, Healey and Talboys2014). The low foliar P rates increase use efficiency (McBeath et al., Reference McBeath, McLaughlin and Noack2011). However, the low foliar P rates' effectiveness depends on several factors such as soil P status, crop type and climatic conditions (Noack et al., Reference Noack, McBeath and McLaughlin2010).
The practice of no-till in its version of permanent beds as a planting system with residue retention has the potential of storing N and making it available for future use (Govaerts et al., Reference Govaerts, Sayre, Ceballos-Ramirez, Luna-Guido, Limon-Ortega, Deckers and Dendooven2006) through the mineralization soil process. Similarly, residue retention is a strategy to recover P partly (Cordell et al., Reference Cordell, Drangert and White2009). However, the increased mineralization potential of no-till systems depends on several factors, such as moisture and temperature conditions (Sharifi et al., Reference Sharifi, Zebarth, Burton, Grant, Porter, Cooper, Leclerc, Moreau and Arsenault2007). Moreover, moisture is a factor to consider when estimating N supply to crops from SOM during the growing season (Agehara and Warncke, Reference Agehara and Warncke2005). The integrated effect of fertilizers and soil nutrient supply on the crop nutritional status can be estimated from the canopy spectral reflectance (Tremblay et al., Reference Tremblay, Wang, Ma, Belec and Vigneault2009) like the normalized difference vegetation index (NDVI).
The two most significant climatic factors affecting yield variation are rainfall and temperature; increased annual variability in these two variables causes increased variation in yield (Porter and Semenov, Reference Porter and Semenov2005). However, rainfall has a dominant influence on dryland crop yields (Ryan et al., Reference Ryan, Sommer and Ibrikci2012), and its increased variation is expected to dominate future climate changes. For example, the shortage of moisture conditions during the grain filling stage of wheat is a common constrain in dryland areas (Subedi et al., Reference Subedi, Ma and Xue2007).
Thus, according to the preceding, the objective of this study was to compare the effect of foliar P with granular P fertilizer on rainfed wheat under the assumption that N from the soil and residual from previous years supplied the crop.
Materials and methods
This study was established in 2005 under permanent beds (0.80 m wide and 0.18 m high) as a planting system under rainfed conditions. This report presents results obtained for the 2012–2019 period. Spring wheat was grown in 2-year rotation with maize at the ‘Santa Lucia’ experimental station of INIFAP, Mexico (19°26.7′ N, 98°53.2′ W, 2280 masl) in the Eastern region of the trans-Mexican volcanic belt. Dividing the experimental site into two halves allowed to grow wheat each year; wheat in one half and maize in the other in alternate years. Fertilizer treatments were maintained in the same plot. Crop residues were left as stubble and beds reshaped after harvesting and during the planting operation. Soil type classification corresponds to a fine loamy mixed thermic Cumulic Haplustoll. At the onset of the study, soil sampling showed an average pH of 6.8, 24 g MO/kg, 12 g total N/kg, 46 mg available P and 703 mg exchangeable K/kg. Climate is temperate and sub-humid with dry winters.
Long-term average precipitation for the wheat crop season is 389 mm, average maximum and minimum temperatures are 23.7 and 9.5°C, respectively. Weather data since the inception of the experiment were obtained from the research station's weather database. Precipitation estimates for two growth periods were helpful to explain variability from year to year of grain yield, soil N supply, NHI and AE. These two growth periods were from planting to maturity (seasonal precipitation) and from heading to physiological maturity (reproductive stage precipitation).
The experiment consisted of applying three P treatments with triple superphosphate; 2.25 l P2O5/ha (0.98 l P/ha) applied to foliage and 45 kg P2O5/ha (19.7 kg P/ha) banded and broadcast-applied to the soil and a check (0P) plot. Foliar P treatment consisted of a single application at the end of the tillering stage and granular treatments to the soil before planting. Granular fertilizer treatments were applied by hand; band treatment on the top of the beds and broadcast over the plot. Incorporation of these two granular P treatments occurred during the field operations of planting and reshaping beds. The check (0P) plot and the three P treatments were allocated within each of four preceding N treatments (0, 25, 50 and 75 kg N/ha) applied from 2005 to 2009. This arrangement resulted in a split-plot design; preceding N rates were the main plots and P treatments the subplots. This treatment arrangement summed 16 experimental units per replication. Both N and K fertilizers were excluded for this study (2012–2019) as no response to N was observed from 2005 to 2009 (Limon-Ortega, Reference Limon-Ortega2021) and soil test high K (>700 mg/kg). The experimental site for the crop seasons of 2010 and 2011 was subjected to fallow. Plot size was four beds wide (0.8 m each) by 10 m long.
Spring wheat (c.v. Nana F2007 from 2012 to 2018 and Valles F2015 in 2019) was planted each year in early June at a seeding rate of 120 kg/ha. The two central rows were harvested after physiological maturity to estimate yield and collect grain and straw samples to estimate N concentration with a Spectrophotometer NIR's 6500 (FOSS, Denmark). Soil samples were collected after each harvest in the two central beds of the plots. Each sample was a composite of a minimum of five cores to 30 cm depth using a standard 25-mm diameter probe. SOM was determined using the Walkley–Black method, N-NO3 and N-NH4 by extracting the soil with 2 M KCl and distilled with MgO plus Devarada's alloy and available P following Bray P-1 procedures.
Estimating N concentration and yield of both grain and straw allowed assessing relative yield, soil N supply (i.e. plant N uptake), NHI and AE. Relative grain yield was the yield of each treatment expressed as a percentage of the maximum yield within preceding N rates and P treatments. Soil N supply (i.e. crop N uptake) was the sum of grain and straw N concentration expressed as a mass basis and multiplied by their corresponding yield (kg N/ha). The nitrogen harvest index was the mass ratio of grain N and N uptake of aboveground biomass (percentage). Phosphorus AE was the grain yield increase for each P unit applied (kg grain/kg P).
Plant reflectance measurements were collected, except in 2018 and 2019, at the booting growth stage using a GreenSeekerTM Hand-held Optical Sensor Unit (NTech Industries Inc., Ukiah, CA) to estimate NDVI.
Measurements were subjected to ANOVA using SAS Proc mixed statistical model approach. Preceding N rates and P treatments were considered fixed effects while replications within years and interactions with replications as random effects. Linear regression analysis using the repeated option was performed to identify relationships between precipitation (estimated at two intervals; seasonal and reproductive stage period) and relative yield, soil N supply, NHI and AE. Treatment and year effects were considered significant at P ⩽ 0.05.
Results
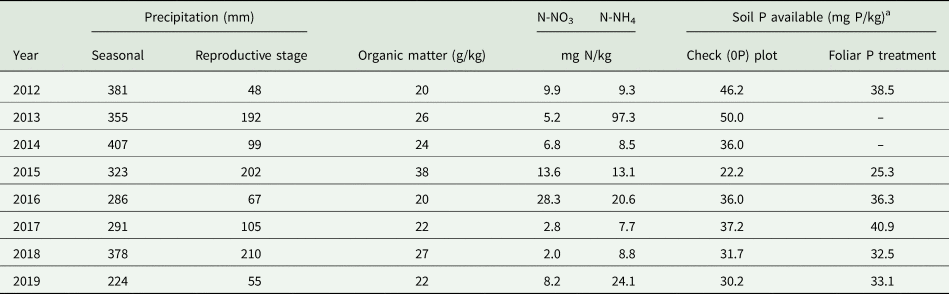
Average precipitation over the 8 years of study (331 mm) was 15% lower than the long-term average (389 mm). Precipitation variation ranged from a low of 224 mm in 2019 to a high of 407 mm in 2014. Moisture constraints from precipitation were often associated with the reproductive stage. The average SOM was 25 g/kg. A considerable portion of inorganic N was found in the form of N-NH4 in most years (Table 1). Nevertheless, inconsistency of N-NH4 content resulted in a non-significant correlation with yield. The average soil P content for the check plot (0P) was 32.4 mg P/kg and 34.4 mg P/kg for the foliar P treatment (Table 2). The effect of preceding N rates (0, 25, 50 and 75 kg N/ha) was negligible, except for the NHI. The corresponding soil mineral N to these N rates estimated in 2011, a crop season before the start of the P treatments, were 52, 47, 42 and 22 mg N/kg, respectively.
Probability F-values estimated from the analysis of variance applied to wheat yield, soil N supply, NHI and P AE

a Soil N supply = (grain N × grain yield) + (straw N × straw yield).
b NHI = (grain N × grain yield)/[(grain N × grain yield) + (straw N × straw yield)] × 100.
c AE = (yield fertilized plot − yield check (0P) plot)/P rate.
*Significant at P ⩽ 0.05.
Accumulated precipitation for two crop growth periods, average SOM, soil N-NO3, N-NH4 and soil P content estimated to 30 cm depth from 2012 to 2019

a Not measured in 2013 and 2014.
Yield
The average grain yield was 3058 kg/ha. According to the analysis of variance (Table 1), Years main effect had a significant effect on yield. This parameter varied from a low of 2000 kg/ha to a high of 4640 kg/ha in 2015 and 2016, respectively (Fig. 1(a)). Preceding N rates and P application treatments did not show a statistical effect on this measurement. However, results among P treatments indicated that foliar P application produced the largest average yield (average 3247 kg/ha). This figure surpassed by 10% the broadcast P application treatment and the check (0P) plot.
Annual changes of wheat grain yield due to P treatments from 2012 to 2019 (a) and regression between relative yield and reproductive stage precipitation (b). Bars indicate the standard error of the mean.

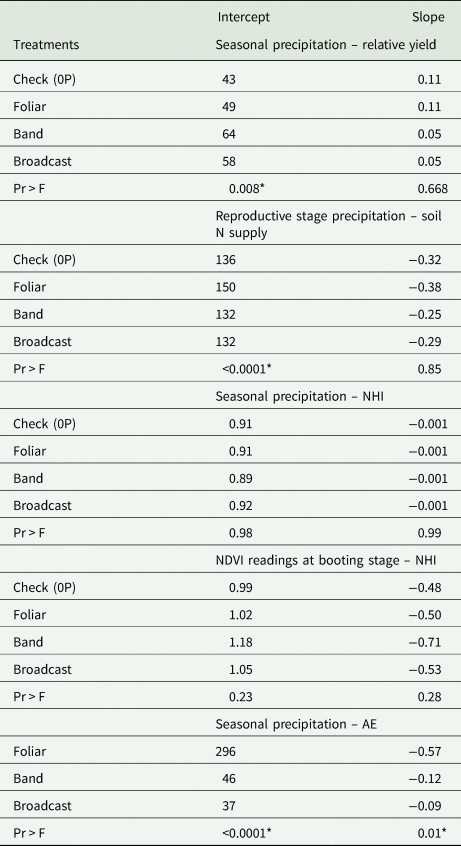
Regression procedures between seasonal precipitation and relative grain yield showed a positive relationship for each treatment, and the resulting intercept coefficients were significant (Table 3). Then, in dry years the grain yield differences among treatments were higher; the predicted relative yield of the check (0P) was lowest while the foliar P was the highest. Concomitantly, as crop season precipitation increased from 224 mm to 407 mm, the relative yield of each treatment increased (Fig. 1(b)). Even though the slope estimates from regression were similar, the relative yield of check (0P) plot and foliar P treatment showed a larger response to precipitation. In contrast, the relative yield response to precipitation for the granular P treatments was relatively minor compared to the foliar P treatment.
Regression coefficients and significance for the relationship of relative yield and soil N supply with reproductive stage precipitation; and NHI and AE with seasonal precipitation

*Significant at P ⩽ 0.05.
Soil N supply
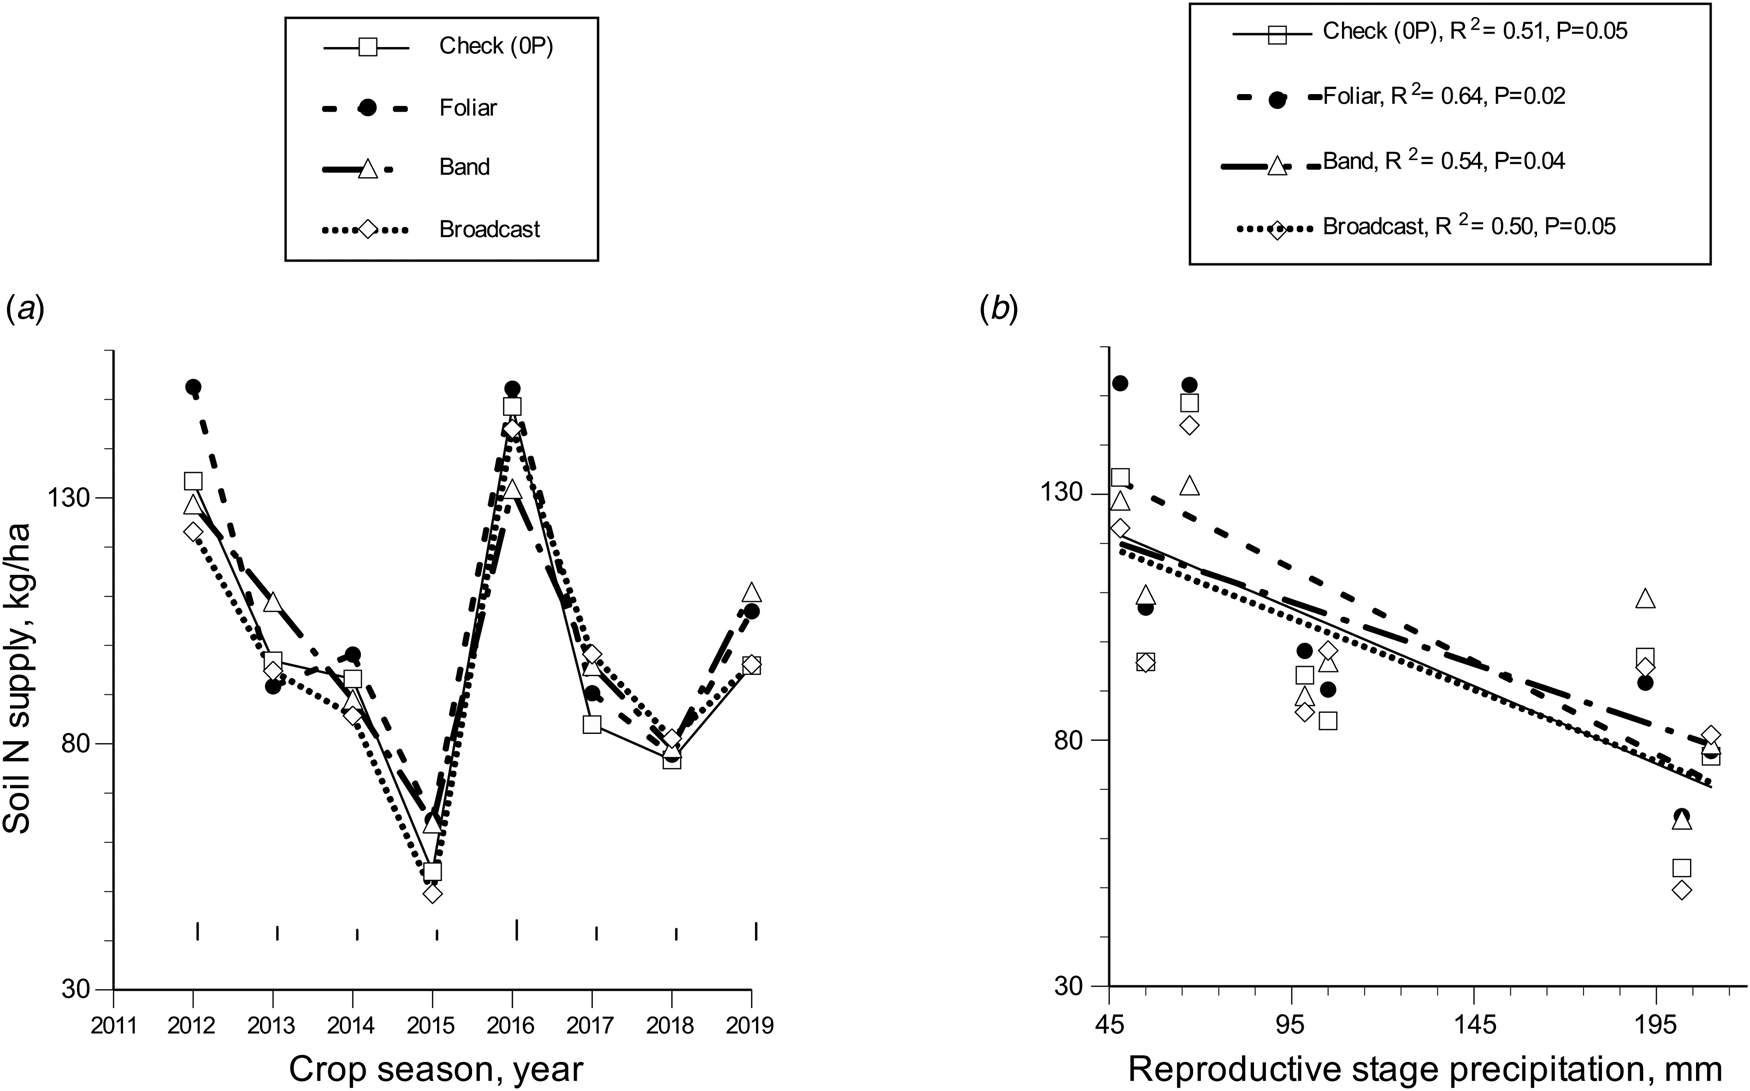
The Year main effect and Year – P treatment interaction (Table 1) significantly affected the soil N supply. Preceding N rates did not affect this measurement. In general, soil N supply in most years was higher for treatments consisting of foliar P and banded P application (Fig. 2(a)). Regression procedures between soil N supply and precipitation during the reproductive stage estimated the effect of years. This approach applied to each P treatment showed a negative relationship (Fig. 2(b)). As accumulated precipitation in that growth stage increased, there was a corresponding soil N supply reduction. According to the intercept regression coefficients (Table 3), N supply due to foliar P application was larger in crop seasons with moisture constraints during the reproductive growth stage. On the other hand, the reduction rate of soil N supply, as shown by the slope coefficient, was similar among treatments. On average, as precipitation increased from 48 mm in 2012 to 210 mm in 2018, N supply decreased 38%.
Soil N supply as affected by Year – P treatment interaction (a) and the relationship between soil N supply and reproductive stage precipitation (b). Bars indicate the standard error of the mean.

Nitrogen harvest index
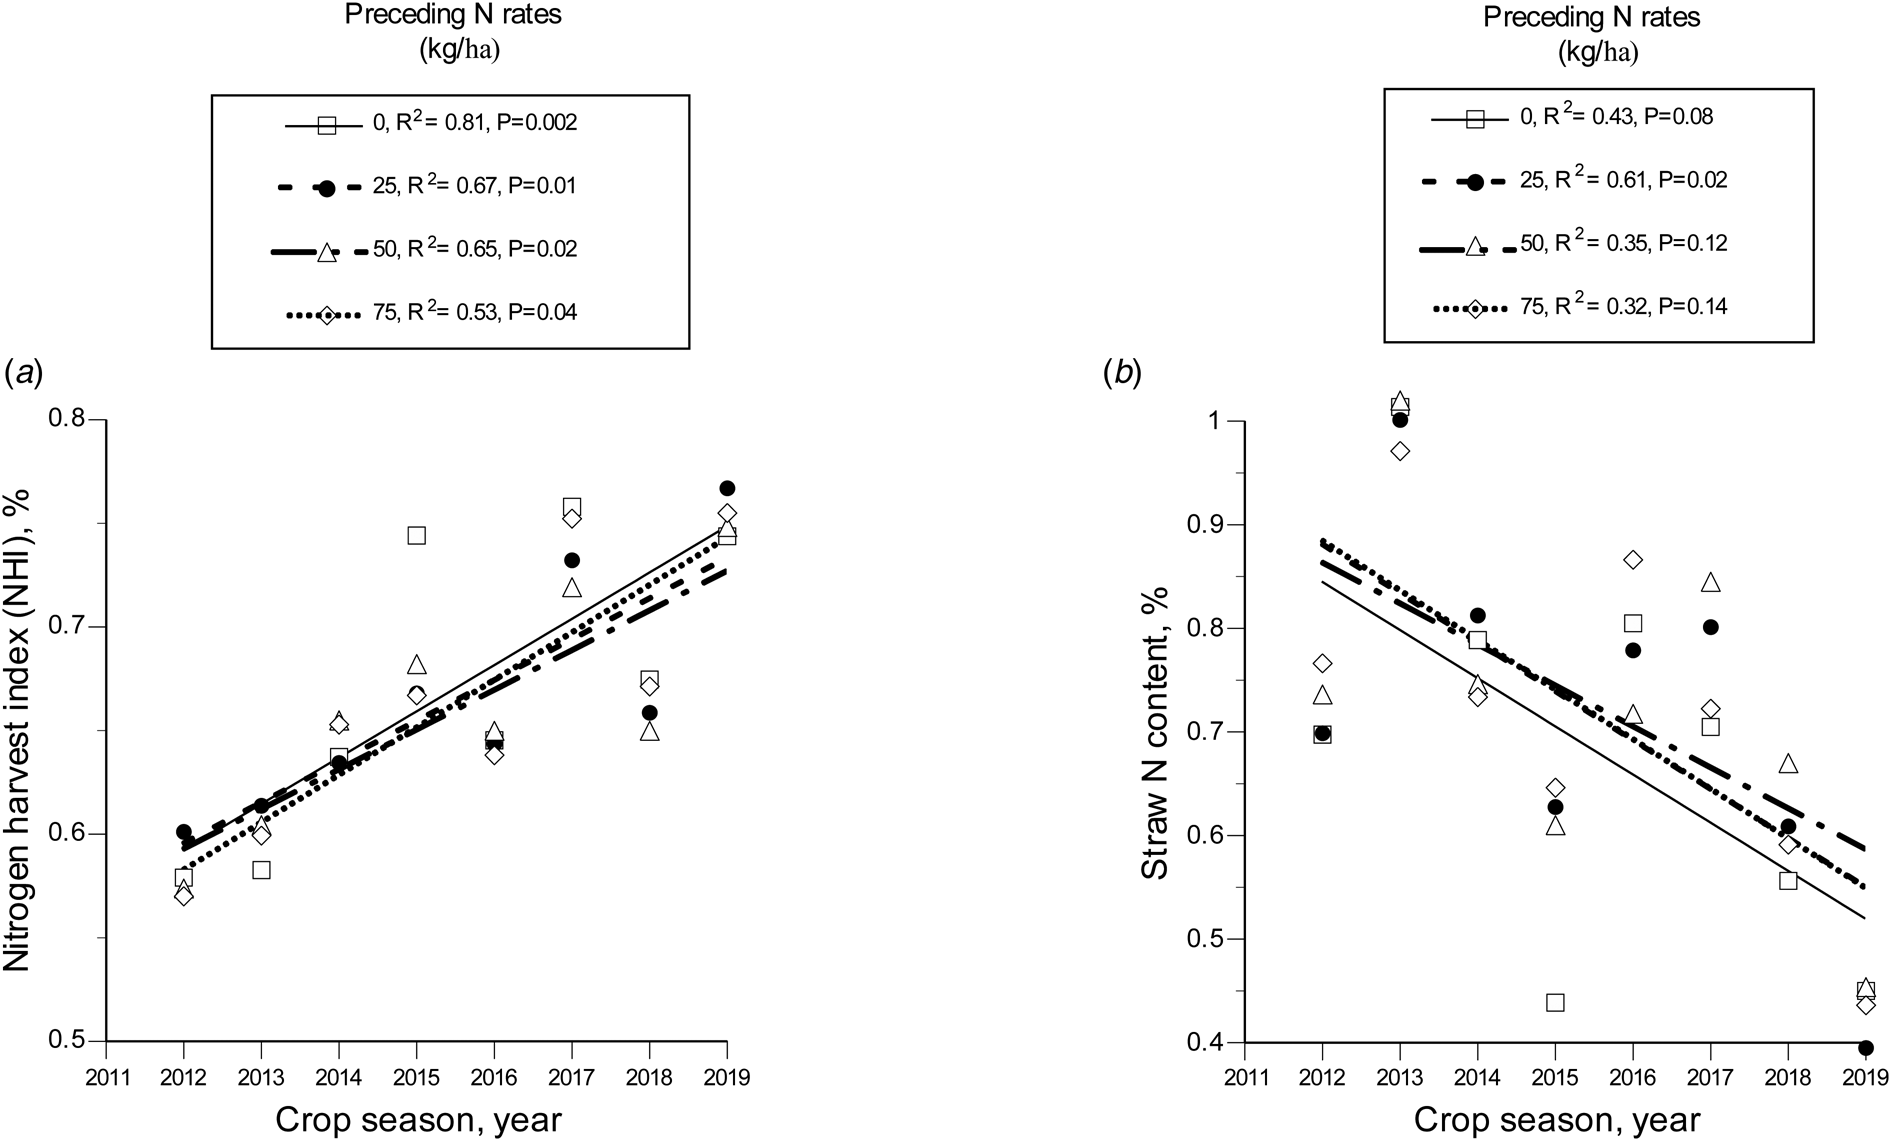
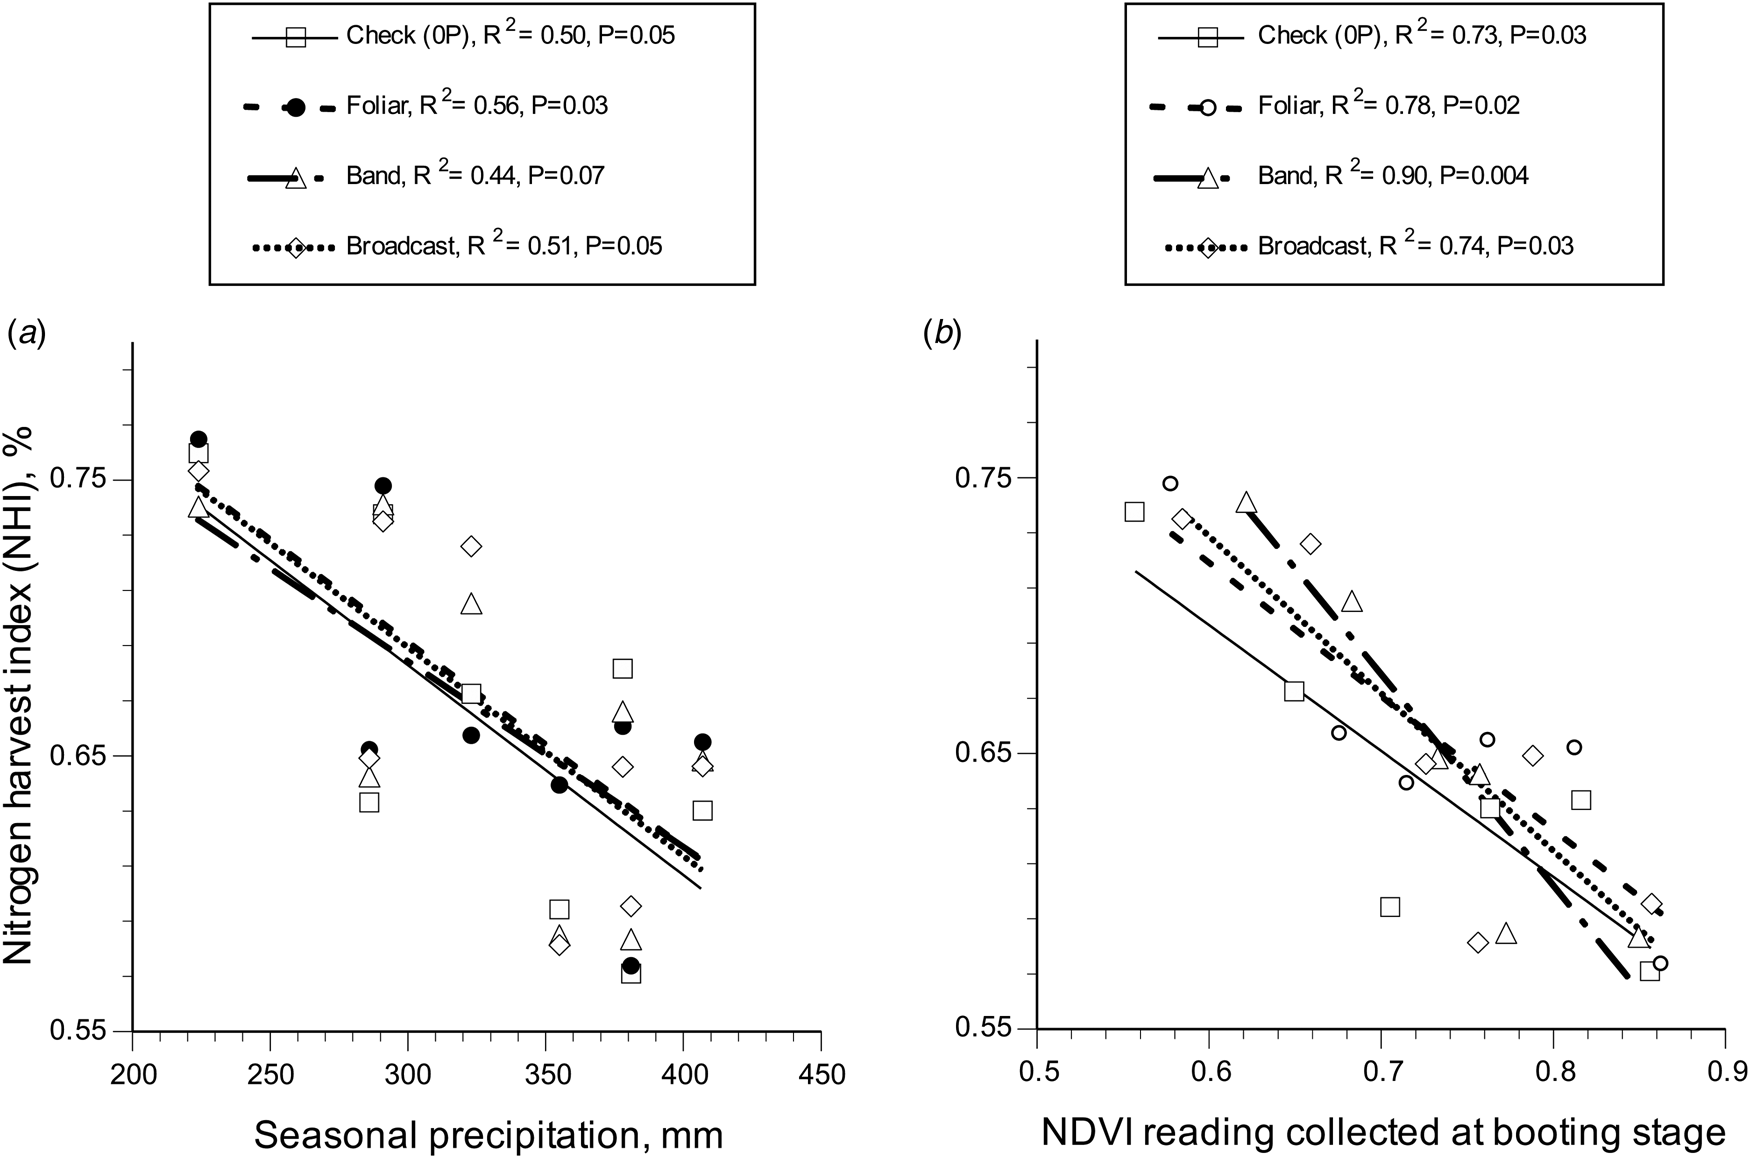
Analysis of variance showed that NHI varied due to the Year main effect and two interactions; Year – preceding N rate and Year – P treatment (Table 1). On average, NHI as affected by Year main effect, increased consistently from a low of 57% in 2012 to a high of 76% in 2019 (Fig. 3(a)). Similarly, straw N content decreased over the years (Fig. 3(b)). According to Fig. 3(a) for the Year – preceding N rate interaction, the highest NHI values across years were measured for the preceding N rate of 0 kg N/ha. On the other hand, regression procedures with NHI identified seasonal precipitation as the adequate weather factor to explain the Year – P treatment interaction (Fig. 4(a)). In this procedure, seasonal precipitation explained about 50% average of NHI variability. However, according to the significance of slope and intercept regression coefficients (Table 3), the effect of seasonal precipitation on NHI was similar among P treatments. On average, NHI decreased by about 19% as seasonal precipitation increased from 224 mm to 404 mm.
Effect of preceding N rates (2005–2009) on NHI (a) and straw N (b) in the eight ensuing crop seasons (2012–2019).

Nitrogen harvest index (NHI) related to seasonal precipitation (a) and to average NDVI readings collected at booting growth stage from 2012 to 2017 (b).

Similarly, NDVI readings collected at the booting growth stage showed a negative relationship with NHI (Fig. 4(b)), but the significance of regression coefficients indicated no difference among P treatments (Table 3). On average, the NHI decreased 23% as NDVI readings increased from about 0.53 to 0.83 (Fig. 4(b)). The NDVI – NHI relationship was an indication that N translocation from foliage can be detected through NDVI measurements.
Phosphorus agronomic efficiency
Phosphorus AE varied according to P treatments main effect (Table 1). On average, AE was 107 kg grain/kg P applied to foliage, 8.6 kg grain/kg P applied in bands and 5.3 kg grain/kg P applied broadcast. Even though Years main effect and interactions did not affect this measurement, regression analysis showed a negative relationship between P treatments and seasonal precipitation (Table 3). As this weather factor increased from 224 mm in 2019 to 407 mm in 2014, the AE of foliar P decreased 69%. Contrastingly, the AE variations of banded and broadcast P application due to precipitation over seasons were negligible (Fig. 5). These results indicated that the benefit of precipitation on wheat yield was larger for applying P to foliage while negligible for granular P forms to soil.
Phosphorus AE for three P fertilizer treatments as affected by seasonal precipitation from 2012 to 2019.

Discussion
The reproductive growth stage was often associated with diminishing moisture conditions; precipitation during this period, compared with the seasonal precipitation, was less than 50% in five out of eight crop seasons. Soil OM content did not show substantial variations across years, except for the outlier reported in 2015. Data from the Magruder Plots (114 years), established under conventional tillage, showed that SOM decreased annually at a rate of 0.02% in the plot that received no fertilizer (Girma et al., Reference Girma, Holtz, Arnal, Tubaña and Raun2007). For wheat planted in permanent beds, a planting system that improves soil quality (Govaerts et al., Reference Govaerts, Sayre, Goudeseune, De Corte, Lichter, Dendooven and Deckers2009), one might surmise that the reduction rate of SOM would be even lesser. Thus, more crop seasons are needed to measure significant SOM changes in this study. Nitrate is the main form of N taken by crops in cultivated soils, but NH4 can be important in undisturbed (no-till)/unfertilized soils (Andrews et al., Reference Andrews, Raven and Lea2013). Accordingly, soil NH4 measured at harvest predominated over the content of NO3. Considering that, preceding N rates had no effect on the crop, except on NHI, it is likely that residual N from these preceding fertilizer applications moved into the deeper soil layers (Grant et al., Reference Grant, Peterson and Campbell2002).
Yield
Annual yield variations and residual soil N following crop harvest did not show an association between them. This independence indicated that the negligible effect of preceding N rates on grain yield is attributable to the leaching process of the N soluble forms (Grant et al., Reference Grant, Peterson and Campbell2002). Indeed, a significant source of N originates from the practice of crop residues incorporation (Powlson et al., Reference Powlson, Glendining, Coleman and Whitmore2011), which is a need for the successful application of the planting system on permanent beds (Govaerts et al., Reference Govaerts, Sayre, Goudeseune, De Corte, Lichter, Dendooven and Deckers2009). Another factor responsible for the annual yield variations in dryland systems is precipitation (Subedi et al., Reference Subedi, Ma and Xue2007; Ryan et al., Reference Ryan, Sommer and Ibrikci2012) but the effect depends upon P fertilization treatments.
However, irrespective of the annual variations in precipitation, the relative yield from the P application to foliage is consistently higher than the yield from granular P forms. According to Aown et al. (Reference Aown, Raza, Saleem, Anjum, Khaliq and Wahid2012), the beneficial effect of foliar P application on yield might result from a rapid P uptake and translocation, which stimulates root growth and tillers development. Thus, as climatic variations will dominate future climate changes (Porter and Semenov, Reference Porter and Semenov2005), the influence of foliar P on boosting yields suggests that this input may have critical implications for agronomic management, even in soils testing high P.
As for the yield from foliar P and the low application rates of this input, improving crop yields will increase the soil P unbalance. However, the amount of P removed is small relative to the total available P in most soils (Grant et al., Reference Grant, Peterson and Campbell2002). Comparably, average soil P content over 8 years experienced minor changes due to foliar P application. This result suggests that foliar P is a viable alternative to reduce the frequency of granular P application (Dhillon et al., Reference Dhillon, Torres, Driver, Figueiredo and Raun2017) for extended periods. Nevertheless, the soil P status should be verified regularly to replenish this nutrient before reaching the critical P level. Accordingly, this foliar fertilization shows the potential to slow down the global P depletion reserves (Cordell et al., Reference Cordell, Drangert and White2009) and to reduce the ecological constraints due to the excessive granular P application.
Soil N supply
Considering that preceding N rates had no effect in this variable, the N source that fed the plants originated presumably from soil native N and crop residue decomposition. On the other hand, soil N supply did not decline after excluding N fertilizer application for eight crop seasons. Indeed, this parameter varied due to accumulated precipitation during the reproductive stage. In general, the reduction of soil N supply in rainy years occurs due to the transport to lower depths of water-soluble forms (Setia et al., Reference Setia, Sharma and Verma2006). Thus, the effect of precipitation on the soil N supply varied according to P fertilizer treatment. For example, the enhancement of soil N supply occurred by the P application to foliage in years with moisture constraints during the reproductive growth. According to Noack et al. (Reference Noack, McBeath and McLaughlin2010), this enhancement is likely due to reduced root-soil contact for nutrient exchange that improves the benefit of foliar P in lower rainfall areas/years.
Estimates of soil N supply in conventionally fertilized plots for a wheat crop is about 33 kg N/Mg grain (Arnall et al., Reference Arnall, Mallarino, Ruark, Varvel, Solie, Stone, Mullock, Taylor and Raun2013). This estimate is similar to the average measured in this study, except that the N source was only from indigenous soil N and presumably from crop residues. Thus, as for this study, to achieve an average grain yield of 3050 kg/ha, soil supplied an average of 139 kg N/ha/year, slightly higher than 123 kg/ha reported by Chuan et al. (Reference Chuan, He, Pampolino, Johnston, Jin, Xu, Zhao, Qiu and Zhou2013).
In the long term, the exclusion of N fertilizer may lead to soil N mining (Edmonds et al., Reference Edmonds, Abreu, West, Caasi, Conley, Daft, Desta, England, Farris, Nobles, Patel, Rounds, Sanders, Shawaqfeh, Lakmini, Manandhar and Raun2009). However, applying the permanent beds as a planting system to dryland wheat in moderate yield areas could presumably ameliorate this mining process. One reason is that the crop residues from previous years replenish the soil organic nutrient pool (Grant et al., Reference Grant, Peterson and Campbell2002). Indeed, previous research on this planting system indicates that crop residues left on the soil surface as mulch improve the soil quality (Govaerts et al., Reference Govaerts, Sayre, Goudeseune, De Corte, Lichter, Dendooven and Deckers2009).
Nitrogen harvest index
On average, the NHI measured was 66%, similar to the NHI reported by Salvagiotti et al. (Reference Salvagiotti, Castellarin, Miralles and Pedrol2009), but consistently increased over the crop seasons, indicating N remobilization during the reproductive growth stage (Muurinen et al., Reference Muurinen, Kleemola and Peltonen-Sainio2007) also increased over the years. Research has shown that increased N remobilization from leaves originates due to a gradual reduction in soil N content (Salvagiotti et al., Reference Salvagiotti, Castellarin, Miralles and Pedrol2009). Nevertheless, the content of soil N-NO3, the main form of N taken by plants (Andrews et al., Reference Andrews, Raven and Lea2013), measured after harvest does not provide conclusive evidence of N reduction over the 8 years of study. Alternatively, other soil measurements like soil microbial biomass N could indicate trends long before chemical analysis detects changes, but that was not part of this project.
Another factor with an effect on NHI is seasonal precipitation. Crop seasons with moisture constraints resulted in high NHI estimates, but NHI decreased as seasonal precipitation conditions improved. These contrasting results give a negative relationship. According to Subedi et al. (Reference Subedi, Ma and Xue2007), the increased rates of N remobilization to grain (high NHI) are due to moisture stress conditions. Similarly, water deficit reduces the availability of soil N but enhances the remobilization of pre-stored N to the grains (Xu et al., Reference Xu, Yu and Wang2006); otherwise, NHI decreases. This result is then bound to NDVI measurements estimated with a GreenSeeker, which describe crop nutritional status (Franzen et al., Reference Franzen, Kitchen, Holland, Schepers and Raun2016), specifically, the N condition (Tremblay et al., Reference Tremblay, Wang, Ma, Belec and Vigneault2009). For example, the large N remobilization (high NHI) measured in dry years shows low NDVI readings indicating low N concentration in the foliage. On the contrary, low NHI and high NDVI readings in wet years suggested a luxury consumption of soil native N when foliage accumulated a large N percentage (Yue et al., Reference Yue, Meng, Zhao, Ye, Zhang, Cui and Chen2012).
Phosphorus agronomic efficiency
Similar to this study, except for foliar P, the AE reported from other studies range from 10.2 kg grain/kg P (Chuan et al., Reference Chuan, He, Pampolino, Johnston, Jin, Xu, Zhao, Qiu and Zhou2013) to 19.2 kg grain/kg P (Liu et al., Reference Liu, He, Jin, Zhou, Sulewski and Phillips2011). Several factors determine AE; some of them are soil quality (Cordell and White, Reference Cordell and White2013), fertilizer application (Dhillon et al., Reference Dhillon, Torres, Driver, Figueiredo and Raun2017), management practices (Chien et al., Reference Chien, Prochnow, Tu and Snyder2011) and rainfall patterns (Withers et al., Reference Withers, Sylvester-Bradley, Lones, Healey and Talboys2014). The two factors in this study affected AE; P fertilizer application as management practice and precipitation as a climatic factor. The AE declined as seasonal precipitation increased, and the reduction rate depended on P fertilizer application. The AE reduction rate for the P application to foliage was remarkably higher than for granular P applications. However, the AE for foliar P was consistently higher irrespective of precipitation conditions. The low AE measured in rainy seasons indicates a yield improvement of the check (0P) plot, which is attributed to an enhanced soil nutrient availability due to water supply (Asseng et al., Reference Asseng, Turner and Keating2001). Opposite to this, in years with moisture constraints when nutrients may not be readily available, the ability of the plant to produce yield is higher with the foliar P application. This result represents an advantage over granular P forms as foliar P can potentially substitute the much larger applications to soil-applied P (Withers et al., Reference Withers, Sylvester-Bradley, Lones, Healey and Talboys2014).
Conclusions
Dryland wheat planted in permanent beds and crop residues retention in this environment can be grown without N fertilizer application. Foliar P application can potentially replace the granular P forms in soils testing high P for several crop seasons. This fertilization practice generally increases yield, soil N supply and P AE. This enhancement for the application of foliar P is even more significant in seasons with moisture constraints from precipitation than for granular P application. Such finding reveals the importance of P fertilization through foliar means to reduce the impact on the environment and economy of excessive granular P applications. However, due to the inherent P unbalance for the reduced foliar P rate, further research is needed to estimate when the soil legacy P will reach the critical point.
Acknowledgements
This research is a contribution from INIFAP-CEVAMEX.
Financial support
This research received no specific grant from any funding agency, commercial or not-for-profit sectors.
Conflict of interest
The authors declare there are no conflicts of interest.
Ethical standards
Not applicable.