

INTRODUCTION
Judge, Fainshmidt, and Brown (Reference Judge, Fainshmidt and Brown2014) asked a broadly important question – which form of capitalism works best? They suggested that capitalism ‘works best’ when the economy of a country is able to generate wealth and distribute that wealth in a relatively equitable manner among its citizens, labeling this as ‘equitable wealth creation’. In other words, economic success entails both economic efficiency and equitable wealth distribution. In this earlier study, they analyzed the extent of equitable wealth creation of country institutional configurations across 48 economies, using data within the first decade of the twenty-first century. They found that there were multiple institutional systems that were effective in delivering equitable wealth creation, but there was no one best pathway to equitable wealth creation. Additionally, some institutions were common to all configurations exhibiting equitable wealth creation.
During that same year, Thomas Piketty (Reference Piketty2014) published his widely acclaimed book, Capital in the Twenty-First Century, that advanced the thesis that capitalist economic systems are generally efficient in generating wealth, but often unfair in distributing that wealth because the rate of return on capital is higher than the rate of economic growth. He argued that if trends continued unchallenged, this will lead to increasing social and economic distress within societies and the eventual demise of capitalism. The book clearly addressed a highly relevant worldwide concern and spoke to the dominant economic issue of the day.
Historically, classical economics has emphasized wealth creation, while downplaying the importance of distributional inequities. Consequentially, critics of capitalism focus on its inequities, while proponents of capitalism focus on wealth creation. It seems that economic discourse often pits wealth creation against wealth distribution, and indeed, the two may sometimes entail tradeoffs. Resonating somewhat with Piketty's sentiment, Judge et al. (Reference Judge, Fainshmidt and Brown2014) demonstrated that it might be possible for an economy to do both: create wealth efficiently and distribute it equitably. By emphasizing both outcomes systematically, their study attempted to reconcile this conflict and shed new light on the conversation surrounding comparative capitalism.
RATIONALE FOR UPDATE AND EXTENSION
Clearly, the role of capitalism is on the minds of many scholars, policy makers, and engaged citizens throughout the world (Ferguson, Reference Ferguson2012). Rising anger over distributive inequities and the concentration of wealth and income in fewer and fewer hands, has led to political instability and upheaval within and across many economies (Collier, Reference Collier2018). Even in the United States, the supposed bastion of market capitalism, a groundswell of support for democratic socialism has risen to the point that Ray Dalio, a billionaire investor in the United States, has declared that ‘Capitalism is failing America’ and recommended specific steps to save it from itself (Feloni, Reference Feloni2019). Additionally, with the resurrection of nationalistic populist instincts and subsequent rise of authoritarian tendencies in liberal democracies, there is understandable concern about how these political trends will impact capitalism and reshape the institutions that support it. In other words, if capitalism is failing some economies, we need empirical evidence on where it is working and why.
This study was invited by the Editor-in-Chief of Management and Organization Review, Arie Y. Lewin. The original study spanned the global financial crisis (2005–2010), and as such, this anomalous time period may not have been representative of most economies, or of the overall global economy. This study benefits from increasing data availability for economies throughout the world, expanding the number of economies to 68 from the original study's 48 economies. As a result, we were able to add many understudied economies to this update (Fainshmidt, Judge, Aguilera, & Smith, Reference Fainshmidt, Judge, Aguilera and Smith2018). Further, we know that while institutions change very slowly, they do change (Hotho, Reference Hotho2014). Consequently, we wanted to see if the institutional configurations associated with equitable wealth creation shifted substantially over roughly a decade of time. Finally, the initial study represented an early application of fuzzy-set qualitative comparative analysis. Since the original publication, there have been major strides in the application of the method and in our understanding of its use.
In sum, the purpose of this study is to update, refine, and expand the earlier work of Judge et al. (Reference Judge, Fainshmidt and Brown2014) with newer data on a broader range of countries and to discuss potentially new insights for comparative capitalism. In order to improve accessibility of this study, we have provided an extensive Appendix for readers who might want to delve into the technical details associated with our research design and analysis.
STUDY FINDINGS
Trends in Equitable Wealth Creation
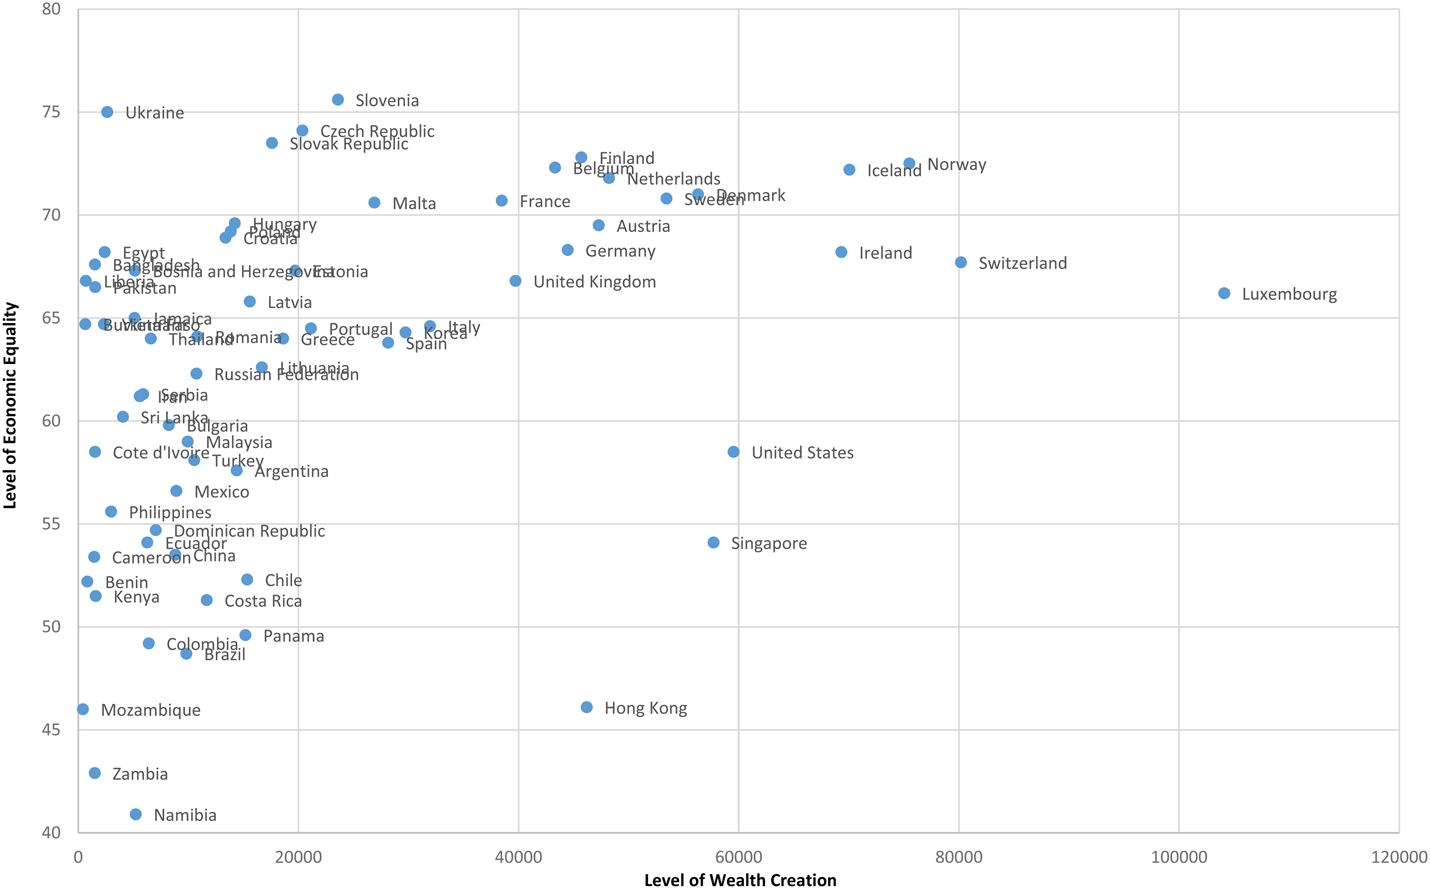
Figure 1 is a graphical depiction of the two focal economic outcomes for 68 economies in this study using the most recent data we were able to obtain. The vertical axis represents the level of income equality within the economy (i.e., inverse of the GINI index); the horizontal axis represents the wealth creation achieved within the economy (i.e., GDP per capita). As can be seen in Figure 1, some economies are very good at creating wealth and distributing income equitably (e.g., Norway, Iceland, Ireland, and Switzerland). In contrast, other economies are quite poor in both generating wealth and distributing income equitably (e.g., Namibia, Zambia, Mozambique, Brazil, and Colombia).
Graphic Depiction of Wealth Creation and Equality (N = 68)

While higher levels of wealth creation generally tend to be associated with higher levels of equitable income distribution, there are some notable exceptions. For example, some economies are quite good at generating wealth, but not distributing income very equitably (e.g., Hong Kong, Singapore). In contrast, other economies are not generating much wealth, but what wealth they do possess seems to be distributed relatively evenly (e.g., Egypt, Bangladesh, Ukraine).
Upon cursory inspection, Figure 1 suggests there might be a size effect in that smaller countries may find it easier to pursue economic equity than larger countries since the upper right quadrant is dominated with smaller economies. In our data, however, the correlation between the GINI index and population size is + 0.15 (p > 0.05). Consequently, there is weak statistical support for a ‘size effect’ regarding economic equity in our sample. We do acknowledge, however, that population and country size may play a role in some economic outcomes.
The central premise of our study is that the institutional profile of a country is the primary determinant of equitable wealth creation. Examining individual countries is instructive in that regard. For example, the two high-income countries of Hong Kong (HK) and the United Kingdom (UK) are relatively equal in terms of wealth creation, but the UK is much better than the HK in distributing that wealth throughout its society. Upon closer examination, we see that the state expenditures are much higher for UK than HK, and the UK has much lower authority relations than does HK. Consequently, it appears that HK's cultural institutions might be limiting its ability to distribute wealth equitably; at least in terms of our theoretical framework.
In contrast, the two middle-income countries of China and Poland possess dramatically different equitable wealth creation, with China being relatively low (0.02) and Poland being relatively high (0.79). Notably, their institutional profiles are fairly similar in that they both operate with relatively high authority relations, but all other seven institutional dimensions are remarkably different. Therefore, our data appear to support the notion that institutional profiles do in fact influence equitable wealth creation.
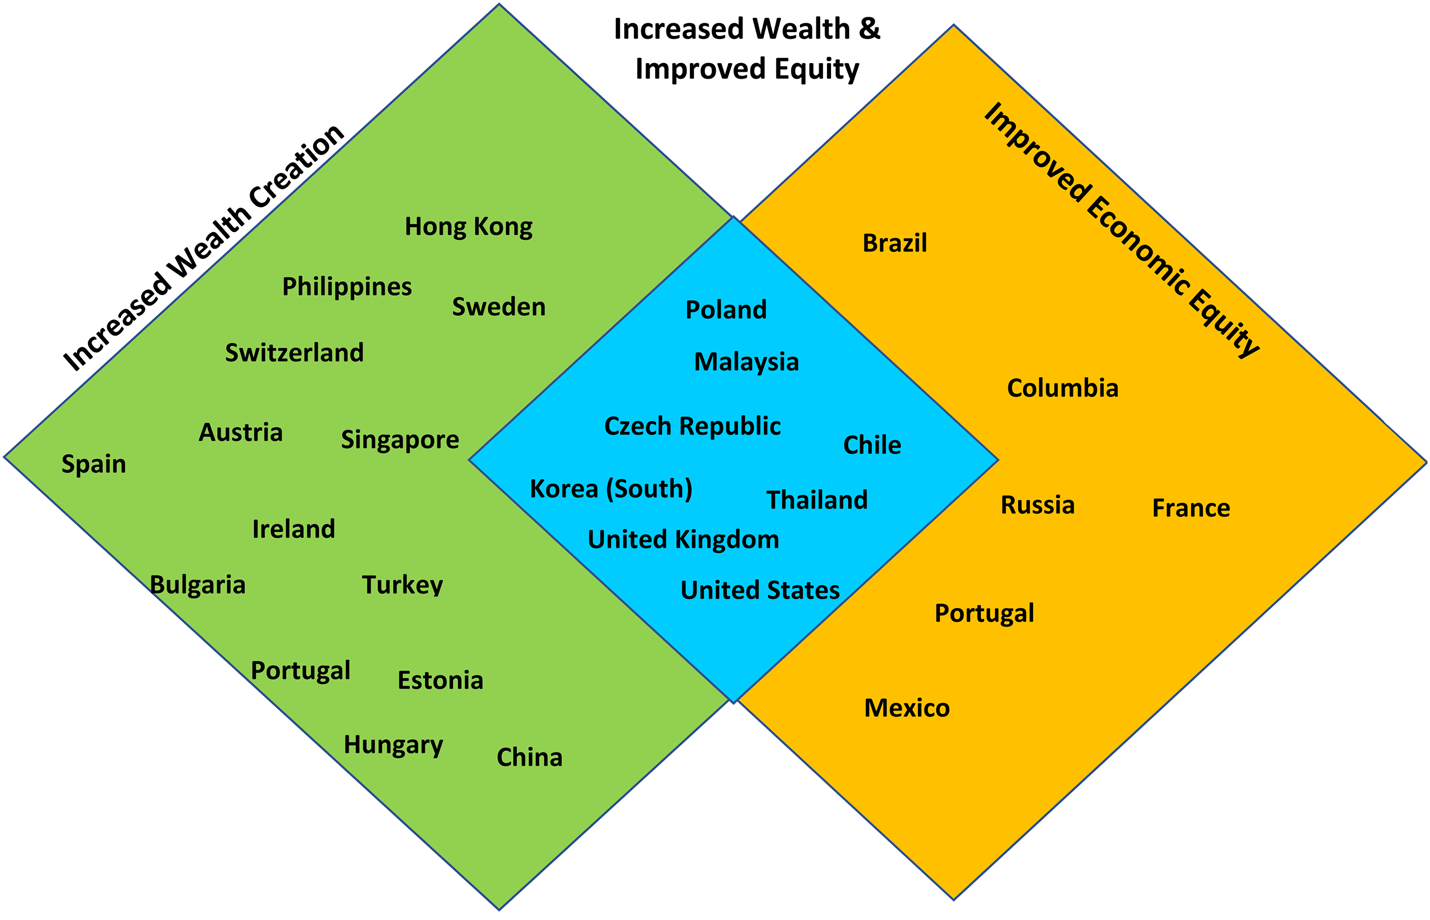
Next, we examined the trends of equitable wealth creation unfolding from the original study and the current study. Figure 2 contains a graphical summary of these trends. Using a threshold of 5% improvement between the two studies, the countries in the left-hand diamond of the graph increased their wealth creation above the threshold but did not increase their economic equity level (e.g., China, Switzerland, and Turkey). Conversely, the countries on the right-hand side of the graphic improved their economic equity level, but did not materially increase their wealth per capita (e.g., Brazil, France, Mexico, and Russia). Notably, the countries in the center significantly increased wealth and improved their economic equity above the five percent threshold (i.e., Poland, Czech Republic, Malaysia, Chile, South Korea, Thailand, United Kingdom, and the United States). According to our analysis, it is these eight countries for which the economy is seemingly able to improve both economic outcomes in recent years.[Footnote 1]
Trends in equitable wealth creation in the twenty-first century

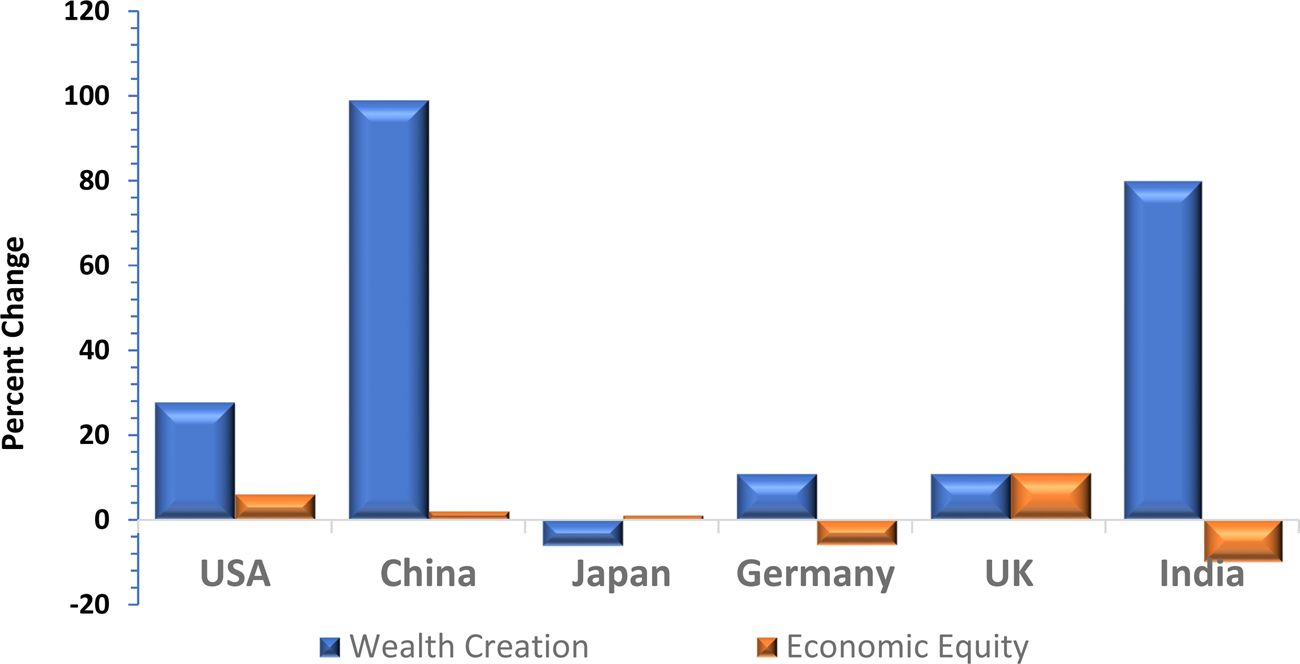
When we take a closer look at the trends of equitable wealth creation by focusing on the six largest economies in the world, we find unexpected results with respect to Piketty's argument that the capitalist economic system is inherently unfair. As shown in Figure 3, the United States and the United Kingdom are the only two large economies investigated in this study which have shown growth in equitable wealth creation over the past decade. This economic trend is remarkable in light of all the political dysfunction in their respective political economies. While we can only speculate here, it appears that the collective institutional profiles of these two economies have served each well in the aftermath of the global economic meltdown despite the rise of undocumented migrants and the intensity of distributive justice rhetoric.
Equitable wealth creation trends in world's six largest economies (~2005 to 2015) Note: (For references to color in this figure, the reader is referred to the online version of this article.)

In contrast, China clearly has been one of the fastest growing economies in the world in terms of wealth creation, but the distribution of wealth has remained roughly constant. While there have been high-profile efforts by the Chinese leadership to eliminate poverty, our data suggests that overall economic equity has not improved since the original study. In sum, it appears that the economic well-being of the poor and the wealthy are growing at rates that maintain a similar income distribution.
Relatedly, the second fastest growing large economy is in India, but economic equity declined slightly over the study period.[Footnote 2] While there are increasing signs of populist nationalism in the form of Hindu majoritarianism within India, it does not appear to have dampened overall economic growth. Nonetheless, this partially-liberal democracy appears to be stagnating in terms of economic equity. It is unclear at this time whether the reasons for its stagnation are similar or different from China at this time since we were not able to update our institutional profile for India in this latest study.
Finally, both Germany and Japan have experienced limited economic growth in recent years and negligible improvement (i.e., Germany) or a slight decrease (i.e., Japan) in economic equity. Consequently, these two coordinated market economies with robust liberal democratic institutions appear to have stagnated economically in recent years. When we compare the institutional profiles of Germany and Japan to that of the USA and UK, the biggest differences are mostly in two areas: (1) much greater emphasis of the equity markets in USA and UK, and (2) much less emphasis on collective bargaining protections in those same countries. While speculative, it is possible that the aforementioned institutional differences may account for some of the faster improvement in the Anglo-American economies.
Institutional Configurations and Equitable Wealth Creation
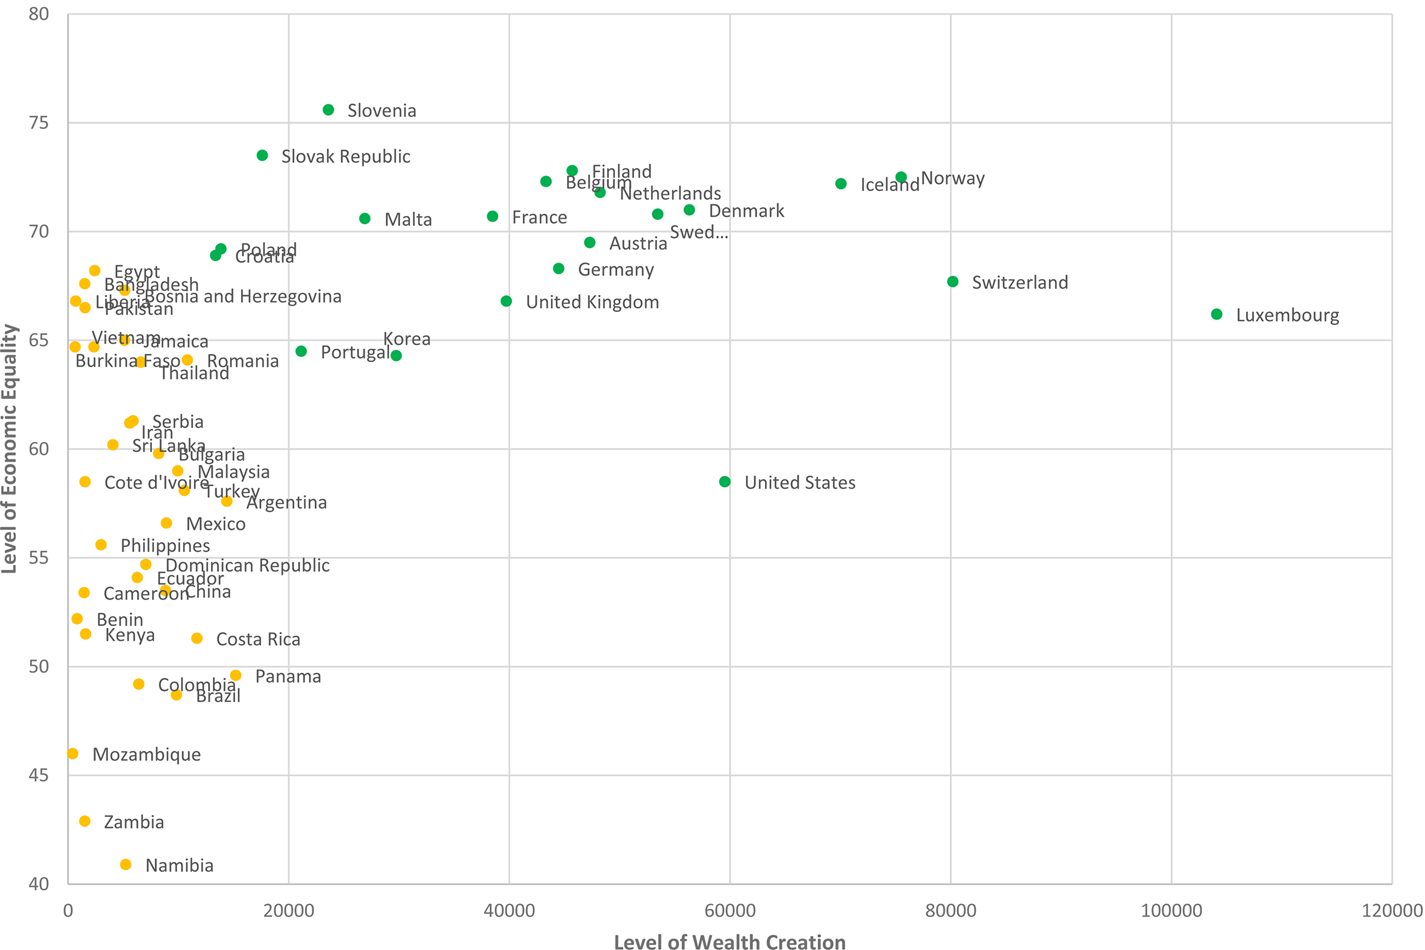
Figure 4 contains a graphical depiction of the economies that were captured in our fuzzy set analysis. The green dot countries signify economies that achieved relatively high levels of equitable wealth creation, and they fit within one of the four effective institutional configurations. The yellow dot countries are those economies that possess relatively low levels of equitable wealth creation, and they fit within one of four ineffective institutional configurations.[Footnote 3]
Ineffective and effective institutional configurations for equitable wealth creation Note: (For references to color in this figure, the reader is referred to the online version of this article.)

As previously noted, we see four main pathways to high equitable wealth creation relative to other countries in this most recent analysis. The most common path is by combining: (1) relatively high public spending within an effective regulatory regime by the state; (2) well-developed stock and credit markets; (3) high-quality educational system; and (4) cultivating a trusting societal culture untainted by corruption. The Netherlands is an example of a country that fits this first configuration well.
A second configuration is similar to the first one, but it is missing a well-developed equity market. Instead, it exhibits prevalent collective bargaining for wages and a societal culture characterized by limited power distance between the powerful and the powerless. A good example here is Sweden.
A third path shows relatively low public spending but still offers an effective regulatory regime by the state. This configuration, similar to the first one, also includes a well-developed credit market, a high-quality educational system, and a trusting societal culture untainted by corruption. Collective bargaining is not prevalent and power distance is low. Switzerland, and to an extent the United States, are examples of this more typical liberal market economy.
The fourth pathway, like the first one, exhibits relatively high public spending within an effective regulatory regime by the state and a high-quality educational system. However, this configuration includes underdeveloped financial markets and a relatively high-power distance between the elites and the rest of society, the latter suggesting hierarchical authority relations in society might be conducive to equitable wealth creation in certain circumstances. Examples of such countries include Poland and the Slovak Republic.
When we compare these results to the ones in Judge et al. (Reference Judge, Fainshmidt and Brown2014), we see some remarkable consistencies between the two studies. For instance, relatively higher state expenditures in the economy, effective regulatory regimes, and a strong educational system are all associated with equitable wealth creation and are thus important sets of institutions in both studies. For the most part, cultures characterized by low power distance are associated with equitable wealth creation, but there are exceptions to this trend. Notably, formerly communist economies in Eastern Europe appear to be creating a new form of capitalism that generates wealth equitably despite what could be the relatively high acceptance of power by political elites. It is possible that the constitutional reforms and regional pressures demanded by the European Union might have made the political elites more accountable to their citizens in these transition economies.
Notably, there are also important differences in this study compared to the earlier one. For instance, the credit market seems to play a more prominent role in the current study. This makes sense because the earlier analysis examined economies just before and after the global financial crisis. The credit market was severely strained at that time and apparently has returned to more ‘normal’ operating conditions today.
Relatedly, collective bargaining systems featured more prominently in the earlier study than the current one. Possibly, collective bargaining systems are especially helpful during economic crises, but they may hinder economic growth during non-crisis periods. Clearly, we need additional research to further understand this tentative trend.
Overall, we once again find that there are multiple forms of capitalism that are successful, but that the combinations of institutions that lead to success might be gradually shifting as the global economy evolves. In the following section, we discuss some of the implications of these results. In other words, we provide further evidence that institutional context matters quite a bit when considering economic outcomes (Jackson & Deeg, Reference Jackson and Deeg2019).
DISCUSSION
Despite capitalism's proven track record of wealth creation, this engine of economic growth can have unintended, unpleasant consequences and as a result – a host of detractors. In fact, some argue that pressing societal ills, associated with the political, social and economic consequences of the widening gap between poor and rich countries, are a direct result of capitalism's success (Wilkinsen, Reference Wilkinson2011). Indeed, the increasing income and wealth disparities across and within countries have spurred populist politics, the rise of state capitalism under the control of authoritarian regimes, and the disruption of global trade (Piketty, Reference Piketty2014). Additionally, some scholars attribute economic shocks, such as the financial crisis of 2008, to capitalism's unbridled embrace throughout the global economy (Collier, Reference Collier2018). Here, we suggest that the success of each type of capitalism should be evaluated according to its ability to create wealth and distribute it equitably. Accordingly, we show that there are multiple institutional paths to this goal.
Prospects for Equitable Wealth Creation within an Economy
Returning to Figure 1, Singapore and Hong Kong seem to be relatively unique in that their wealth creation achievement is quite high, but economic equality is lower than a trend line would predict. Notably, a similarly wealthy economy, the United Kingdom, practices a form of capitalism that is more equitable than these two former colonies. Clearly, the challenge for economic engines, like Hong Kong and Singapore, is to try to maintain economic growth while distributing its wealth more fairly in the future.
In contrast, some economies in Eastern Europe (e.g., Ukraine), Africa (e.g., Egypt, Liberia), and Southern Asia (e.g., Bangladesh, Pakistan) benefit from relatively high levels of economic equality, but lower levels of wealth creation. Certainly, their task is to increase its economic growth while maintaining its relatively equitable distribution of wealth.
Overall, our data suggests that both large economies, like the USA and UK, and small economies, like the Scandinavian economies, can generate wealth equitably in the twenty-first century. In particular, fostering of one of the four sets of institutional configurations we have identified in this study appear to be the best pathway. Perhaps most interesting is that some middle-income countries, like Poland and the Czech Republic, are generating wealth equitably in the twenty-first century. Since it is particularly hard for economies to avoid the ‘middle-income trap’, these economies offer tantalizing insights into how to move from middle income into high income status. In support of this study, Poland has been identified as a ‘European tiger’ which has been observed to be avoiding the middle-income trap by generating wealth equitably (Aldaz-Carrol, van de Brink, & Skrok, Reference Aldaz-Carrol, van de Brink and Skrok2018).
Prospects for Capitalism in General
In a speech to the House of Commons, Winston Churchill (Reference Churchill1945) once said that ‘The inherent vice of capitalism is the unequal sharing of blessings. The inherent virtue of socialism is the equal sharing of miseries’. Similar to Churchill, we view all economic systems as inherently flawed and needing special attention to the system's weaknesses. Since Churchill's observation, new ‘authoritarian’ forms of capitalism, like that practiced by China, have experienced remarkable growth (Rudd, Reference Rudd2018). This study offers a more comprehensive analysis of where the global economy might be going in the twenty-first century.
Our analysis suggests that the state may play a key role in blunting the coarse edges of capitalism by curbing monopolies, providing a robust social safety net, maintaining a high quality and transparent regulatory system, and investing in a world-class education system. And it must work to reduce and eliminate all forms of corruption as the state deals with private business interests. This entails both ‘illegal’ corruption, which is pervasive in developing economies, and ‘legalized corruption’ whereby powerful individuals or corporations pass laws that unfairly favor the wealthy, like that which is practiced in developed economies (Etzioni, Reference Etzioni1995).
However, beyond some core characteristic common to essentially all models, there are several forms of capitalism that can succeed in terms of equitable wealth creation. This includes the Nordic model with its relatively high taxation approach; as well as the EU model with its robust social safety net, as depicted in Germany and the Netherlands. Further, the liberal market economic model, like that in Switzerland, United States, and the United Kingdom, appear to offer a third option. The French model is interesting because it is relatively wealthy and equitable compared to the rest of the world, but recent events suggest that significant portions of its citizens perceive that economic equity is unacceptable as evidenced by the ‘yellow vest riots’ (Goodman, Reference Goodman2019). Clearly, some emergent forms of capitalism, like the state-led capitalism with Chinese characteristics, are growing quickly. In the case of China, economic inequality is still relatively high, but the jury is still out on whether this model of capitalism can succeed.
There are transnational challenges to capitalism as well. For example, Zuboff (Reference Zuboff2015) coined the term ‘surveillance capitalism’ as transnational firms like Google and Facebook monetize citizens’ data. Zuboff cleverly labels the dangers associated with this growing trend as the ‘Big Other’, building on the negative connotations associated with ‘Big Brother’ government intrusions into privacy. Similarly, new technologies increasingly automate previously human jobs and pose major challenges to traditional capitalist economies in what Frey (Reference Frey2019) calls the ‘technology trap’.
Finally, the biggest transnational challenge to democratic capitalism is arguably climate change, as Lovins and Cohen (Reference Lovins and Collins2012) cogently argue. While the decline of biodiversity, rise in carbon in our atmosphere, increase in weather extremes, and sea level rise bashing our coastlines all pose risks to our way of life in general, a case could be made for a third objective of any economic system that entails environmental sustainability. However, this national objective is beyond the scope of this study. Nonetheless, considering the economy's effects on the biosphere is the next frontier for this debate on what constitutes overall well-being, not just economic well-being.
Public Policy Recommendations
Based on the earlier study coupled with this one, we would like to suggest a few public policy prescriptions. First, political leaders and their advisors need to aim higher by focusing on both the wealth creating and wealth distribution aspects of their economy. It is no longer sufficient to just focus on one goal over the other. Adam Smith, the father of capitalism, was a moral philosopher who would likely be shocked to learn that modern day economics ignores the social equity outcomes, and it is a misreading of his writings to ignore social equity issues. Toward that end, Newbert (Reference Newbert2018), by way of Smith's writings, argues that effective economies are systems that reinforce the twin drives of self-interest by the producer in order to generate economic wealth, and benevolence toward the consumer in order to protect the social order. Furthermore, policy making needs to be based more on empirical evidence and less on nationalistic populism, which unfortunately is on the rise.
Second, the path to equitable wealth creation appears to rely on a core set of strong institutions in three areas: (1) a robust regulatory system that operates predictably and within the rule of law, (2) a strong educational system that produces human capital, and (3) an effective curbing of corruption. Although these three are not sufficient, and in some rare cases not even necessary, for equitable wealth creation, their presence is part of all effective configurations, so policy makers should focus efforts to address institutional problems in these areas first.
Of these three institutions, it has been observed that corruption is a particularly difficult institution to improve upon. While it is certainly not the only economy plagued by corruption, Brazil is perhaps the clearest example of how deeply rooted corruption can undermine an economy's prospects. In the aftermath of Operation Carwash, where a very comprehensive set of systemic changes were adopted to curb corruption, that country has been backtracking in recent years. Specifically, there has been political interference in law enforcement doing its duty, a weakening of legislation to hold elites accountable, the judiciary has been limiting punishment to those who have been caught, and there is increasing press harassment when it reports on corruption (France, Reference France2019). Overall, since corruption, by definition, leads to ill-gotten gains by the societal elites, and acceptance by elites is normally required to change corruption, this institution is particularly difficult to limit or reduce by a society (Li, Reference Li2019).
Limitations and Future Research Implications
There are some important limitations to this study which can lead to future research and new insights. First, although we increased our coverage of nations in this study, we had to leave out several important economies. For example, we were unable to complete the institutional profiles of both Japan and India for this most recent study, and their absence in this study limits its generalizability. It is imperative that institutional profiles for additional nations be carefully documented and studied, as their inclusion can yield novel patterns and insights.
Second, our study is quantitative in nature, and it would be instructive to perform a longitudinal, qualitative field study of the institutional profiles of a few select economies. While a comparison is made almost daily between the United States and China in the popular press, the political economies of India and China are a much more interesting and relevant comparison in the scholarly literature. Since both economies are emerging and relatively new to the global economy and both stem from very different institutional backgrounds, this comparison would likely yield valuable insights. Similarly, the underlying economic and societal micro-processes that shape equitable wealth creation over time is beyond the scope of our study. Such an undertaking is particularly challenging for studies across multiple countries because of the complexity and idiosyncrasy of these processes even within a single country. Nonetheless, such endeavors could deepen our understanding of how institutional configurations shape equitable wealth creation over time.
In-depth comparisons could yield valuable insights into new and emerging institutions that are critical to the overall performance of an economy, that international business scholars have not yet emphasized in their previous work. For example, the transnational clash of governance logics (Desender, Aguilera, Lopezpuertas-Lamy, & Crespi, Reference Desender, Aguilera, Lopezpuertas-Lamy and Crespi2016), the influence of war (Arikan & Shenkar, Reference Arikan and Shenkar2013), and even the effects of natural disasters (Mithani, Reference Mithani2017) are all potential explanatory variables discussed in the recent international business literature which are not part of the Whitley institutional framework, but these and others could help us to better understand equitable wealth creation. Indeed, our study shows high levels of coverage of the equitable wealth creation outcome, but there is significant room to improve coverage as well. Granted, deviation from unity is to be expected due to measurement error, potential mis-calibration, and related methodological artifacts. Yet, it is quite likely that other conditions outside of Whitley's framework, institutional or otherwise, matter to equitable wealth creation. There are many studies on wealth creation and on inequality, but not necessarily on the drivers of both in the form equitable wealth creation. This is a fruitful area of research.
CONCLUSION
Despite these limitations, this study offers an important update to the previous study by Judge and associates (2014). There is a long list of challenges to capitalism within the global economy, and we argue that it is no longer sufficient to evaluate an economy just on its ability to grow. As Meyer (Reference Meyer2017) points out, if we fail to address the uneven benefits of globalization, global trade will stall or even shrink, and social discord and even violence may result.
Both studies show that there are multiple effective paths to equitable wealth creation, but institutions shift over time and the twin targets of wealth creation and equitable distribution are constantly changing. This current study suggests that the effects of the credit markets are increasingly important to generating equitable wealth creation, while the institution of collective bargaining might be becoming less important. In addition, several transition economies in Eastern Europe which are part of the European Union, are performing increasingly well in terms of equitable wealth creation. While this is speculative, one can argue that the positive influence of the European Union governance standards are mitigating the deleterious effects of these rather authoritarian societies. Only time will tell if these trends continue.
From a global perspective, one percent of the world's population currently controls the same wealth as 45 percent of the world's population, and this skewed distribution of wealth is increasing over time (Inequality.Org, 2019). Unequal distribution of wealth is inevitable within an economy, but assuring that the gaps between the haves and have nots doesn't grow too large is likely to make an economy more sustainable (Kolk, Kourala, & Pisani, Reference Kolk, Kourula and Pisani2017). Recent research suggests that very high economic inequality is more destabilizing to societies than low levels of wealth, with respect to human longevity, mental illness, social mobility, crime, mental illness and even violence (Wilkinson, Reference Wilkinson2011). Nonetheless, both objectives are crucial to societal well-being. This study provides some modest insights regarding the sets of institutions that may enable achieving both economic outcomes, as well as some tantalizing trends emerging over time. We encourage others to examine this critically important topic.
TECHNICAL APPENDIX
Sample and Data
Similar to Judge et al. (Reference Judge, Fainshmidt and Brown2014), we first obtained all nation-states for which data on economic inequality and wealth creation were available. We strived to obtain data for the most recent year available, usually 2017, but in some cases, we received data for earlier years as described in detail for each measure below. Out of the 222 nation-states listed in the World Bank World Development Indicators database, we were able to obtain wealth creation data for 194 nation-states and economic inequality data for 102 nation-states. One nation-state provided data on economic inequality but not on wealth creation, making the potential sample size 101 nation-states. After removing nation-states for which institutional data were not available, the final sample for this study includes 68 nation-states. Importantly, the sample used in this study is considerably larger than the sample in the original study (48 nation-states) and encompasses developed and developing economies accounting for 77.3% of World GDP in 2017. It excludes a few countries from the original study due to data unavailability (e.g., India, Israel, and Japan), but it features 22 more nation-states not covered by the original study.
Variables and Measures
To measure equitable wealth creation and the institutional factors, we followed a similar approach to Judge et al. (Reference Judge, Fainshmidt and Brown2014). To capture wealth creation, we obtained from the World Bank data on Gross Domestic Product (GDP) per capita for 2017. We used 2016 figures in a few cases where 2017 data were not available. We captured economic inequality with the GINI coefficient from the World Bank. Since income distribution changes very slowly and countries do not report GINI coefficient on a consistent yearly basis, we obtained GINI coefficients if they were available for the year 2014 or later. The vast majority of nation-states in our sample had GINI coefficients for one of the years during 2015-2017. Further, we added GINI coefficients from the CIA World Factbook in cases where data from the World Bank was missing or older than that of the CIA World Factbook. Finally, we reversed the GINI coefficient by subtracting it from 100, such that higher values denote more equal distribution of income. Wealth creation and equality are positively correlated at 0.38 (p = 0.01). As in Judge et al. (Reference Judge, Fainshmidt and Brown2014), there is a moderate positive association between the two variables, but the relationship appears to be more curvilinear than the original study.
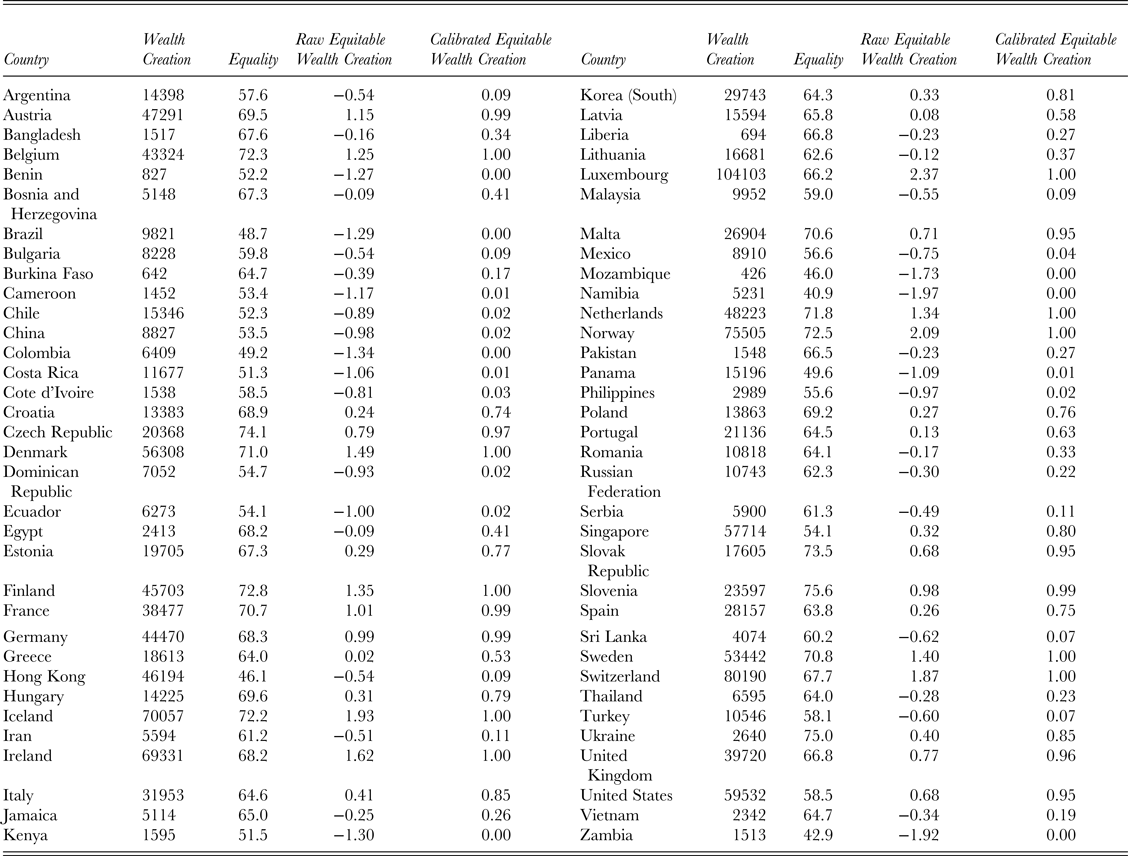
Equitable wealth creation is operationalized as the factor score of the two variables above, wealth creation and economic equality. The latent factor explains about 70% of the variance and correlates equally and highly with both wealth creation and equality (r = 0.83, p < 0.01). It also correlates highly with the inequality-adjusted human development index (r = 0.70), similar to Judge et al. (Reference Judge, Fainshmidt and Brown2014), suggesting the measure is valid. As an additional probe into the validity of our equitable wealth creation measure, we generated standardized scores for equality and wealth based on all available world data rather than our sample of 68 nation-states. We then averaged the two scores for each country in our sample, as both scores range from -1 to 1. This variable correlates with the factor score at 0.99, as expected. Table A1 presents wealth creation, equality, equitable wealth creation, and calibrated equitable wealth creation scores for each nation-state in our final sample.
Equitable wealth creation data for 68 nation-states

We follow Judge et al. (Reference Judge, Fainshmidt and Brown2014) in terms of the framework of explanatory conditions. To measure the two components within the dimension pertaining to the state, we obtained data for general government final consumption expenditure (% of GDP) from the World Bank to capture State Expenditure, and the Regulatory Quality index for 2017 from the World Governance Indicators. When data on state expenditure were missing for the year 2017, we obtained data for 2016.
To measure the two components within the dimension pertaining to the financial system, we first obtained the total stock market capitalization of listed domestic companies (% of GDP) to capture the Equity Market. When data for the year 2017 were unavailable, we used data for 2016 or 2015. For nation-states where the World Bank did not provide these data, we searched manually in each country's stock exchange website, the Bloomberg database, and online sources for stock market information (e.g., world-exchanges.org) to retrieve data on stock market capitalization. In cases where a country did not have a stock exchange, we assigned it a value of zero on this measure. In cases where several countries participated in a joint stock exchange (e.g., the BRVM in Africa), we assigned marked cap proportionally to participating countries according to their GDP relative to all participating countries. To capture the Credit Market, we used data from the World Bank on domestic credit provided by the financial sector, except for credit to the central government, which is net, as a percentage of GDP. We used figures for 2017 where available and 2016 or 2015 otherwise.
To measure the two components within the dimension pertaining to the skill development and control system, we first used the education subcomponent of the United Nations Human Development Index for 2017 to capture Skill Development. This index reflects the expected and mean years of schooling; hence it embeds data on enrollment ratios for secondary education for each nation (the proxy used in Judge et al., Reference Judge, Fainshmidt and Brown2014). Next, we captured Collective Bargaining using data from the Economic Freedom of the World report for 2017. Specifically, we used the Global Competitiveness Report question: ‘Wages in your country are set by a centralized bargaining process (= 1) or up to each individual company (= 10)’. This question was included in a survey of a representative sample of business leaders in their respective countries. We reversed this item such that higher values denote the prevalence of collective bargaining.
Finally, to measure the two components within the dimension pertaining to informal societal norms, we first capture Trust Relations using the 2017 Corruption Perceptions Index from Transparency International. We then capture Authority Relations using Power Distance scores provided by Hofstede's national culture database. Due to lack of data availability for several countries in Western Africa, we use the regional score for West Africa. Additionally, for Bosnia and Herzegovina, we use scores from Dabić, Tipurić, and Podrug (Reference Dabić, Tipurić and Podrug2015).
Data Analysis
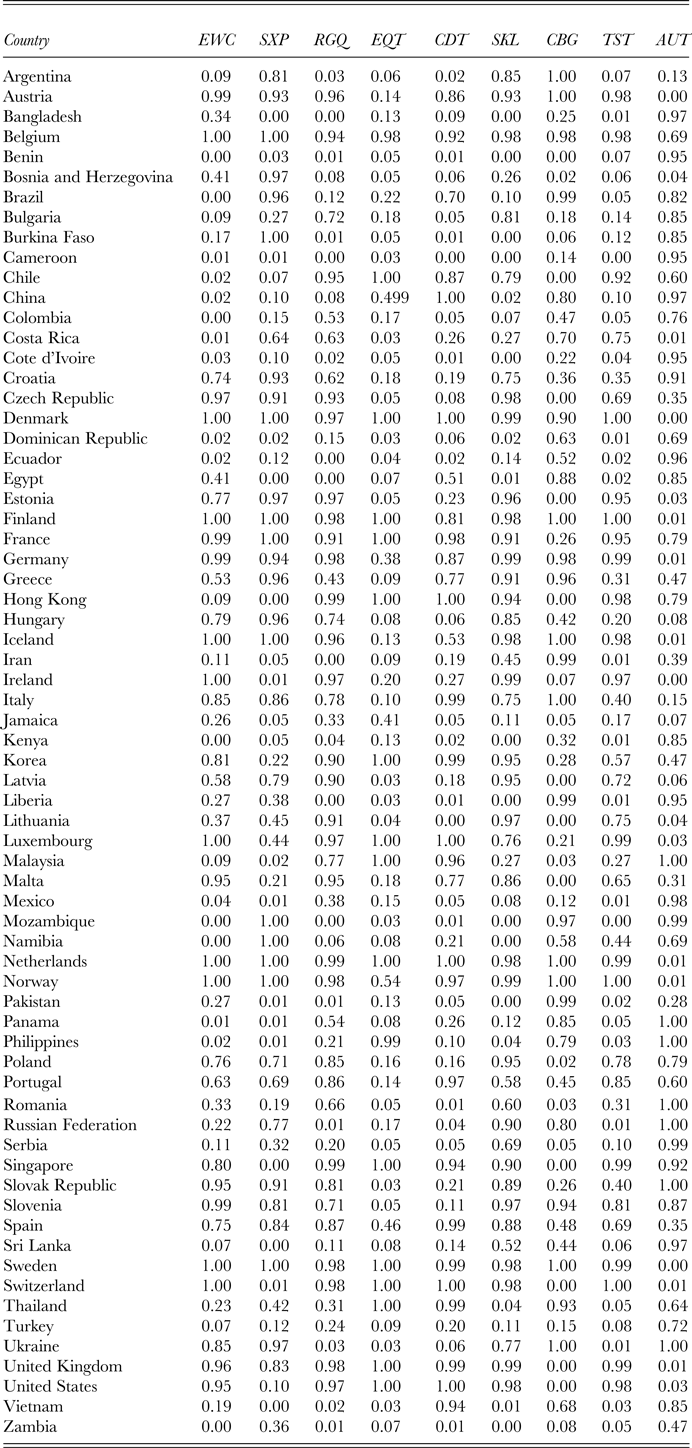
Similar to Judge et al. (Reference Judge, Fainshmidt and Brown2014), we apply fsQCA to examine the configurations of institutional conditions associated with equitable wealth creation. Before conducting the analysis, we calibrate the raw data into sets. We apply the direct method for calibration (Ragin, Reference Ragin2008), which involves specifying the three key anchors defining fuzzy sets: full membership, crossover point, and full non-membership. We use the 75th percentile, mean, and 25th percentile to denote the three anchors, respectively. Although theory-based calibration is ideal, the data in this study do not provide natural or theoretically rooted anchors to guide calibration. Because we are interested in conducting a comparative analysis, and our sample seems to represent well the population of nation-states, we calibrated the data in relation to the sample. Calibrated scores of exactly 0.50 were manually replaced with values of 0.499 to avoid cases being dropped during analysis due to ambiguity in set membership. Table A2 presents calibrated data for the outcome and causal conditions.
Calibrated outcome and causal conditions

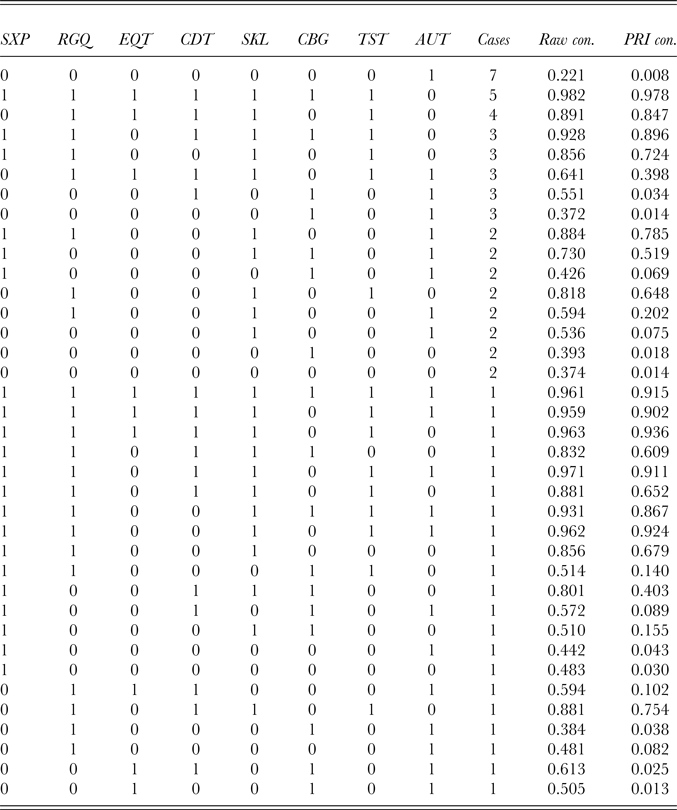
Given our sample size, we used a frequency threshold of one in the truth table, meaning that we eliminated configurations not exhibited by any nations-states. Nonetheless, because this might open the analysis to erroneous conditions or configurations, we revisit this decision later in the manuscript by examining the implications of using a higher frequency threshold, which allows us to discuss the robustness of configurations we identify in the main analysis. In terms of the consistency threshold, we use 0.8 for raw consistency (Bell, Filatotchev, & Aguilera, Reference Bell, Filatotchev and Aguilera2014) and 0.75 for PRI consistency to distinguish between truth table rows exhibiting the outcome and those that do not. Finally, similar to Judge et al. (Reference Judge, Fainshmidt and Brown2014), we refrained from specifying any easy counterfactuals. In Table A3, we present a truth table of all relevant combinations of causal conditions and their frequency and consistency with the outcome condition.
Truth table for the presence of equitable wealth creation

Results
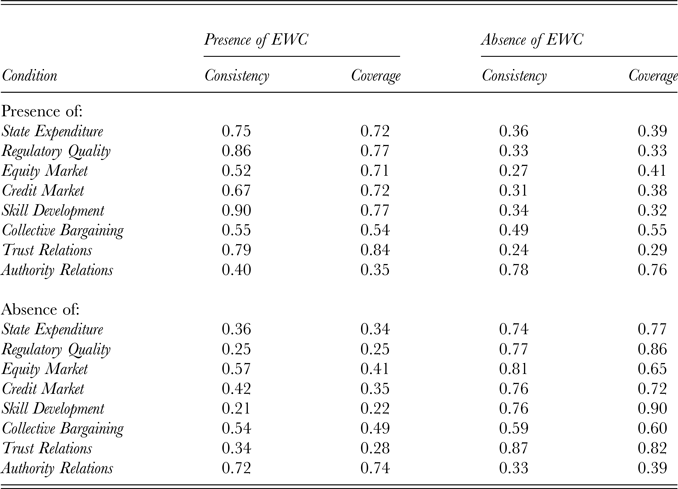
We first examined whether the presence or absence of any of the causal conditions is necessary for the presence or absence of equitable wealth creation. Results of these necessity analyses are presented in Table A4. With the exception of one condition, the consistency of all causal conditions does not reach 0.90, the level at which a condition might be considered as almost always necessary for the outcome (Schneider & Wagemann, Reference Schneider and Wagemann2012). The presence of a robust skill development system is consistent at the 0.90 level with the presence of equitable wealth creation, meaning it is closest to being considered a necessary condition. Nonetheless, the results suggest that there might be narrow pathways to the presence of equitable wealth creation without the presence of a robust skill development system. We therefore retain this condition for the sufficiency analyses to gain further insights into the specific patterns.
Necessity analyses results (N = 68)

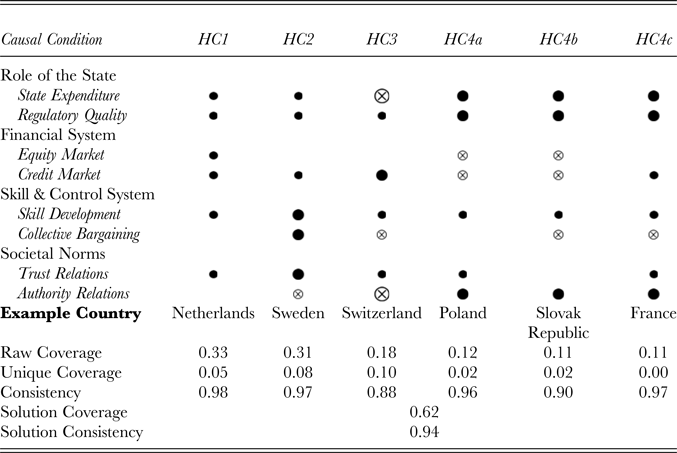
Results of the fsQCA sufficiency analyses are presented in Table A5. Our analyses yielded a total of six configurations associated with the presence of equitable wealth creation. We present the intermediate solution, though it is similar to the complex solution because we did not specify any easy counterfactuals. Further, we embed the parsimonious solution in Table A5 by marking core conditions that are part of the parsimonious solution with larger circles. Core conditions have a stronger causal relationship with the outcome. We denote the presence of a condition with black circles and the absence of a condition with crossed circles, while blank spaces denote a ‘doesn't matter’ condition, which may be either present or absent in a configuration.
Institutional configurations associated with the presence of equitable wealth creation (Frequency Cutoff = 1)

The six configurations in Table A5 exhibit a very high level of solution consistency (0.94) and a fairly high level of solution coverage (0.62). That is, the configurations cover a substantial portion of membership in equitable wealth creation and systematically lead to that outcome. We group configurations according to their core conditions, as configurations that differ in peripheral conditions are often considered neutral permutations of each other. Doing so suggests four main configurations. HC1 combines the presence of state expenditure, regulatory quality, equity market, credit market, skill development, and trust relations. This configuration exhibits the largest raw coverage, meaning that it covers a relatively large portion of membership in the outcome. Notably, this configuration does not include core conditions because some of the terms in the parsimonious solution appear as ‘doesn't matter’ conditions in this configuration. The closest conditions to the parsimonious solution would be the presence of state expenditure, regulatory quality, and credit market.
HC2 combines the presence of state expenditure, regulatory quality, credit market, skill development, collective bargaining, and trust relations with the absence of authority relations. This configuration also covers a large portion of membership in the outcome, with a coverage of 0.31. Core conditions are the presence of skill development, collective bargaining, and trust relations. HC3 combines the absence of state expenditure, collective bargaining, and authority relations with the presence of regulatory quality, credit market, skill development, and trust relations. The absence of state expenditure and authority relations combined with the presence of credit market are core conditions.
Finally, HC4 combines the presence of state expenditure, regulatory quality, and authority relations as core conditions, but peripheral conditions vary among HC4a, HC4b, and HC4c. HC4a and HC4b add the absence of credit and equity markets, the presence of skill development, and the presence of trust relations (HC4a) or the absence of collective bargaining (HC4b). In HC4c, both trust and authority relations are present, and notably, credit market is present. Note, however, that HC4c has a unique coverage of zero, meaning that all of this configuration's explained portion of membership in the outcome is shared with other configurations. We therefore focus on HC4a and HC4b.
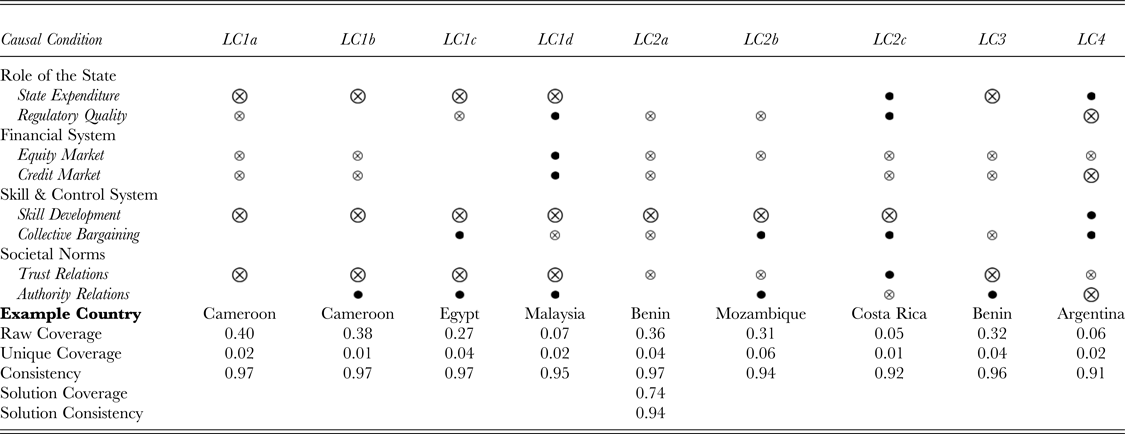
Next, we examined configurations associated with the absence of equitable wealth creation. The nine configurations in Table A6 exhibit a very high level of overall solution consistency (0.94) and a very high level of solution coverage (0.74). Again, we group configurations according to their core conditions, resulting in four main configurations. LC1 features the absence of state expenditure, skill development, and trust relations as core conditions, though peripheral conditions vary. Example nation-states include Cameroon and Egypt. Interestingly, LC1d features the presence of regulatory quality, equity market, and credit market. However, this configuration is based largely on Malaysia and exhibits relatively low coverage figures.
Institutional configurations associated with the absence of equitable wealth creation (Frequency Cutoff = 1)

LC2 includes the absence of skill development as a core condition. As such, this configuration resembles LC1 in many ways and is similarly exemplified by many African nation-states. LC2c is based largely on Costa Rica and exhibits relatively low coverage figures. LC3 is another configuration fairly like LC1 in that it exhibits the absence of state expenditure and trust relations as core conditions. Benin is a good example of such institutional milieu. Finally, LC4 is a relatively more unique configuration, including the absence of regulatory quality, credit market, and authority relations as core conditions. Interestingly, this configuration exhibits the presence of state expenditure and skill development. It is, though, based largely on Argentina and thus exhibits low coverage figures. Overall, across the nine configurations, the absence of a high-quality skill development system and of trust relations appear to be pertinent conditions associated with the absence of equitable wealth creation.
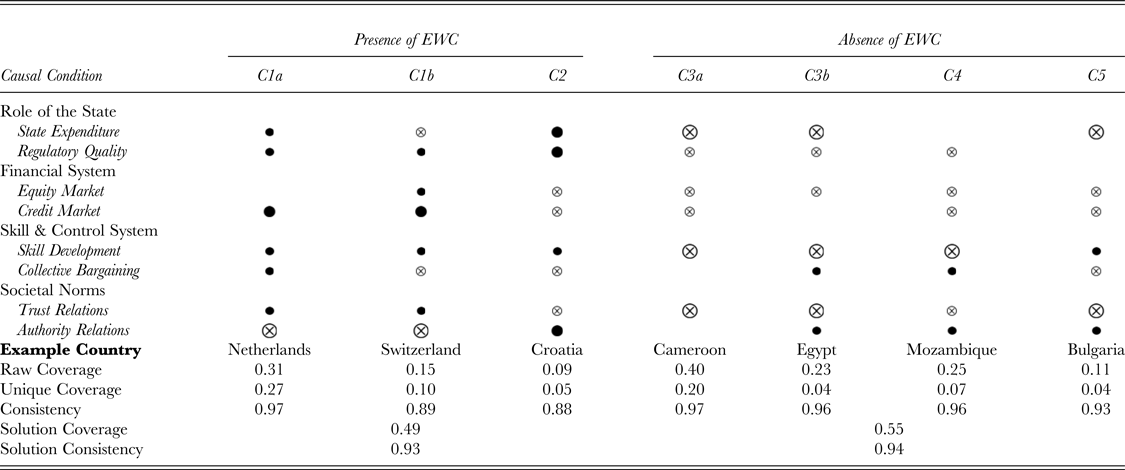
Although a frequency cutoff of 2 cases results in the loss of significant sample size, we examined the configurations with such heightened frequency cutoff to attempt identifying patterns that are more robust in the sense that they generalize beyond potentially idiosyncratic cases. This is a useful exercise particularly because the main results yielded a plethora of configurations that seem to be neutral permutations of few, core combinations. We present these results in Table A7.
Institutional configurations for both presence and absence of EWC (Frequency Cutoff = 2)

We identified two distinct configurations associated with the presence of equitable wealth creation. These configurations collectively cover about half of the membership in the outcome. C1a includes the presence of credit market and the absence of authority relations as core conditions as well as the presence of all other conditions other than an equity market which does not matter. This is the largest configuration, with raw coverage of 0.31 and unique coverage of 0.27. C1b features the presence of credit market and the absence of authority relations as core conditions as well, but it differs from C1a in terms of collective bargaining, the equity market, and state expenditure. C2 features the presence of state expenditure, regulatory quality, and authority relations as core conditions along with collective bargaining but the absence of all other conditions. It is the narrower pathway of the three. The presence of regulatory quality and skill development is evident across all pathways.
For the absence of the outcome, we identify three configurations. C3 features the absence of state expenditures, skill development, and trust relations as core conditions. C4 features only the absence of skill development as a core condition, but it is fairly similar to C3. Finally, C5 also features the absence of state expenditure and trust relations as core conditions, but it differs from C3 and C4 in that skill development is present though as a peripheral condition. Overall, despite the loss of sample size, we see largely consistent patterns converging around few main configurations.
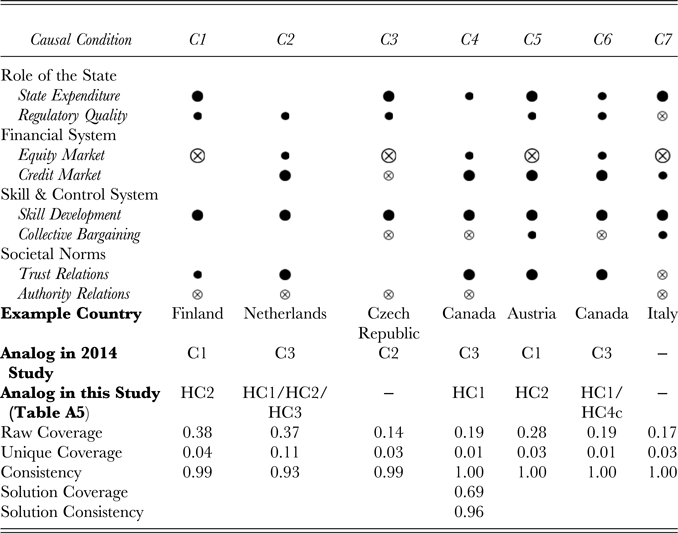
As a final test, we examine the data from the 2014 study (Table 2), but we vary the frequency threshold from 2 to 1 cases as a means of comparing patterns to our results in Table A5. We keep all other specifications similar as in the main analysis of the current paper. Results are presented in Table A8. For each configuration we identify, we specify its analog in the main results of the 2014 study as well as in the equivalent analysis of this study (i.e., Table A5). By analog we mean the exhibiting of subset relations. When two configurations are in subset relations, we can infer consistent patterns and the absence of contradictory evidence, thus lending supporting evidence for the interpretation of the main results (Schneider & Wagemann, Reference Schneider and Wagemann2012). We identify seven configurations associated with equitable wealth creation.
As expected, the lower frequency threshold increases coverage, and each configuration finds a very close analog configuration in the main solution of the 2014 study. From the main solution of the 2014 study, C1 has two permutations, C2 is still a configuration based on East European economies (now C3), and C3 has three permutations. In other words, this analysis brings out some more nuance and few conditions change from present/absent to ‘doesn't matter’ or vice versa within some of the permutations, but the main patterns are highly similar. One noteworthy finding is C7, a configuration based essentially on Italy. This configuration is unique, but we are cautious in interpreting it. Not only does it dissipate when we up the frequency threshold to 2, it also does not appear in the new, expanded data, even though we include Italy in the sample. Plausibly, Italy's not-so-impressive performance on both wealth and equality in the recent past accounts for this change. In any case, there is very weak evidence that this configuration is a robust pathway to equitable wealth creation.
2014 study data, current study specifications

When we compare Table A8 to Table A5, we again see strong subset relations. HC1 and HC2 are reflected across three permutations each, HC3 is evident in C2, and HC4c maps onto C6. As one would expect with expanded data, a different period, and fsQCA's data-driven algorithm rather than a narrow test of pre-specified configurations, some conditions change from present/absent to ‘doesn't matter’ or vice versa within some of the permutations. However, the strong subset relations across the two studies lend strong support to the main patterns within and across configurations. The roles of the state, the skill development system, trust relations, and, to an extent, the credit market are pivotal.
However, some differences are noteworthy. First, C3 in Table A8 does not have a direct analog in Table A5. The closest configurations are HC4a and HC4b, but the effect of authority relations is opposite. Both configurations are strongly shaped by Central and East European economies emerging from past communist regimes. Plausibly, with the expanded data, we are better able to calibrate the authority relations in these societies relative to the world. Our results here also show some nuance in this region through the permutations HC4a and HC4b. And as noted above, we do not see C7 of Table A8 in Table A5. Overall, we acknowledge the nuances and reasonable deviations, but there is a strong consistency throughout the various solutions.