I. INTRODUCTION
Solution combustion synthesis (SCS) is a low-temperature initiated, energy efficient single step quick synthesis process and is widely used for the synthesis of a variety of nanomaterials. The SCS method uses water-soluble metal nitrate precursors along with the desired fuel-like urea or hydrazides [carbo hydrazide, oxalyldihydrazide (ODH), malonic acid dihydrazide, tetra formal trisazine] etc. The two primary purposes of the fuels are as follows: (i) They form complexes with the metal ions and assist in homogeneous mixing of the cations in the solution, and (ii) they help combustion and liberate heat. Nature of the fuel and fuel to oxidizer ratio play important roles in combustion synthesis since they can influence the morphology, phase, and particulate properties of the final combusted product. Reference Berger, Matei, Papa, Macovei, Fruth and Deloume1–Reference Bera, Patil and Hegde6 The fuels differ in their reducing power, the combustion temperature, and the amount of gases they generate, and these affect the characteristics of the final product. Reference Fumo, Jurado, Segadães and Frade7–Reference Avgouropoulos and Ioannides10 Also, fuels having lower decomposition temperatures with the evolution of larger amounts of gases (CO2 and H2O) are important. These help to generate sufficient local heating for the completion of combustion reactions during the synthesis and at the same time create materials of high porosity, good crystallinity and also prevent particle agglomeration. Reference Ghosh, Pal, Roy, Pal and Basu11–Reference Wu, Jimmy, Zhang, Wang and Li13
SCS approach has shown promising results in synthesizing TiO2, which is the most widely used photocatalyst because of its chemically stable and biologically benign nature. Reference Ma, Xue, Li, Yang and Yan14–Reference Rasouli, Oshani and Hashemi25 Among the three different polymorphic structures, anatase and rutile are commonly used in photocatalysis, while brookite is rarely used. The photocatalytic efficiency of TiO2 depends on various factors like light absorption capabilities, surface active sites, suitable valence and conduction band position, the availability of exciton on the surface, etc. Reference Sivalingam, Nagaveni, Hegde and Madras26–Reference Vinu and Madras28 The major difference in the two popular polymorphs is as follows: Anatase TiO2 is constituted with about 90% exposed (101) facets, while the prevailing facets for rutile are (110). The difference in efficiency of photocatalysis between rutile and anatase could be due to these different exposed surfaces. The band gap (E g) of TiO2 is also crucially responsible for its electronic structure, and E g of rutile and anatase TiO2 is 3.03 and 3.20 eV, respectively. The electrochemical impedance analysis established that the conduction band of anatase lies 0.2 eV above that of rutile. Reference Scanlon, Dunnill, Buckeridge, Shevlin, Logsdail, Woodley, Catlow, Powell, Palgrave and Parkin29–Reference Deák, Aradi and Frauenheim31 This band alignment would favor the transfer of photogenerated electrons from anatase to rutile and the transfer of holes from rutile to anatase. This would greatly reduce the electron–hole pair recombination. The most common commercial photocatalyst is Degussa P-25, and this consists of both rutile and anatase phases. The composite phase shows synergistic effects in terms of exposed surfaces and electronic structures, which ultimately reflect in catalytic efficiency. Reference Hurum, Agrios, Gray, Rajh and Thurnauer32 It is believed in the existing literature that the catalytic reaction takes place preferably at anatase sites, but the presence of both the polymorphs synergistically influences the efficacy of the catalytic reaction; however, the range and value of the synergetic effect depend crucially on the specific catalytic reaction, which is used for testing the photo reactivity. Reference Su, Bechstein, Sø, Vang, Sillassen, Esbjörnsson, Palmqvist and Besenbacher33
In this article, we have precisely probed different photocatalytic reactions over a range of TiO2 polymorphs. We have synthesized TiO2 by solution combustion methods using three different fuels like glycine, urea, and ODH. The oxidizer to fuel ratio was also varied during combustion. The influence of the nature of the fuel during combustion and difference in oxidizer to fuel ratio on the structure and the morphology of the polymorphs were studied by characterizing the differently synthesized TiO2 materials. The role of fuels and different fuel ratios were also found to be crucial in determining the photocatalytic efficiency of TiO2. The synthesized TiO2 materials with different fuels responded differently to the photodegradation of organic dyes and photocatalytic H2 production.
II. EXPERIMENTAL
The fuels glycine and urea were procured from SD Fine Chemicals (India), whereas ODH was purchased from Alfa Aesar and was used as received. Titanium(IV) isopropoxide (TiPO) and methylene blue (MB) were purchased from Sigma Aldrich.
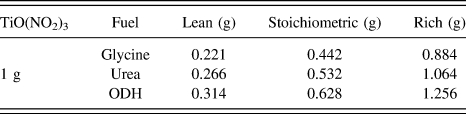
Initially, titanyl nitrate [TiO(NO3)2] was prepared from TiPO by hydrolysis followed by nitration. In a typical synthesis, 10 mL of TiPO was added to ice-cold water with continuous stirring for hydrolysis until the white precipitate of TiO(OH)2 was formed. The precipitated TiO(OH)2 was dissolved in minimum amount of conc. nitric acid to form soluble TiO(NO3)2. Addition of H2O2 to the titanyl nitrate solution forms a yellow color complex of pertitanic acid with the absorbance at 380 nm. The titanium concentration was colorimetrically determined by measuring the absorbance at the λmax with the help of a ultraviolet-visible (UV-Vis) spectrophotometer. In the combustion step, known amounts of TiO(NO3)2 were combusted with three different fuels, glycine, urea, and ODH. The three different fuels have different reducing valencies. According to propellant chemistry, the oxidizing valence of TiO(NO3)2 is −10; while the total reducing valencies of glycine, urea, and ODH are +9, +6, and +10, respectively. The combustion with each fuel was carried out in three different reaction conditions: fuel lean, stoichiometric, and fuel rich conditions. The oxidizer to fuel ratio for fuel lean and rich conditions were half and double the stoichiometric ratio, respectively. In a typical synthesis, 1 g of TiO(NO3)2 solution was mixed with the fuel according to Table I in a 300 mL borosilicate dish, and the redox mixture was introduced into a preheated muffle furnace maintained at 450 °C. The solution initially boiled with frothing and foaming and underwent dehydration, yielding a voluminous solid product within 5 min. The stoichiometrically balanced reactions are as follows:
The amount of fuel added with 1 g of titanyl nitrate for combustion.

with glycine:
 $$9{\rm{TiO}}{\left( {{\rm{N}}{{\rm{O}}_3}} \right)_2} + 10{{\rm{C}}_2}{{\rm{H}}_{\rm{5}}}{\rm{N}}{{\rm{O}}_2} \to 9{\rm{Ti}}{{\rm{O}}_2} + 14{{\rm{N}}_2} + 20{\rm{C}}{{\rm{O}}_2} + 25{{\rm{H}}_2}{\rm{O}}\quad ,$$
with urea:
 $$3{\rm{TiO}}{\left( {{\rm{N}}{{\rm{O}}_3}} \right)_2} + 5{\rm{C}}{{\rm{H}}_4}{\rm{O}}{{\rm{N}}_2} \to 3{\rm{Ti}}{{\rm{O}}_2} + 8{{\rm{N}}_2} + 5{\rm{C}}{{\rm{O}}_2} + 10{{\rm{H}}_2}{\rm{O}}\quad ,$$
with ODH:
 $${\rm{TiO}}{\left( {{\rm{N}}{{\rm{O}}_3}} \right)_2} + {{\rm{C}}_2}{{\rm{H}}_6}{{\rm{O}}_2}{{\rm{N}}_4} \to {\rm{Ti}}{{\rm{O}}_2} + 3{{\rm{N}}_2} + 2{\rm{C}}{{\rm{O}}_2} + 3{{\rm{H}}_{\rm{2}}}{\rm{O}}\quad .$$
It is apparent from the balanced reactions from different fuels that the amounts of gases generated are different. The rich and lean conditions of the fuel will also generate different amounts of gases, and this may affect the characteristics of the final TiO2. After synthesis, the products were collected and the resulting powders were milled with a mortar and pestle.
Crystalline phase identification and crystallite size determination of the synthesized catalysts were recorded with Rigaku Ultima IV X-ray diffractometer (Rigaku, Tokyo, Japan) with Cu Kα radiation (λ = 1.5418 Å) at a scan rate of 1° min−1, and the diffraction angle (2θ) was ranged from 10 to 80°. The crystallite size (D) was measured using Debye Scherer’s formula,
 $= {{0.9\lambda } \over {B\cos \theta }}$
, where B is the full width at half maxima, λ is the wave length of the radiation, and θ is the corresponding angle. Field emission scanning electron microscopy (FE-SEM; Carl-Zeiss ULTRA-55, Carl Zeiss AG, Oberkochen, Germany) was used to determine the surface morphology and composition of the synthesized catalysts. The photoluminescence of the synthesized materials was studied at the excitation wave length of 330 nm by using a JASCO FP-6300 spectrofluorometer (JASCO, Tokyo, Japan). A UniRAM 3300 Raman microscope (UniNanoTech Co. Ltd., Gyeonggi-do, South Korea) with an incident laser wave length of 532 nm was used to study the Raman spectra of powders. To study the band gap of the synthesized catalysts, solid state UV measurements were performed on a JASCO V-670 UV-visible spectrophotometer (JASCO, Tokyo, Japan).
Photocatalytic degradation of MB was performed in a photoreactor mentioned in detail in our previous studies. Reference Nagarjuna, Roy and Ganesan34 A cylindrical annular batch photoreactor housing a mercury vapor lamp of 125 W was used, and water was circulated around the lamp to maintain the reactor at room temperature and to minimize the infrared radiation from the lamp. The average energy of the light emitted was 3.5 eV with a corresponding photon flux of 6 × 10⁻⁶ mol of photon cm2/s. In the photodegradation study, 100 mL of 10 ppm of MB solution was placed in the reactor with 25 mg of the catalyst. As MB is a cationic dye, for better adsorption, the pH of the reaction mixture was adjusted to 8.5. The solution was stirred for 15 min in dark to ensure adsorption–desorption equilibrium, and then it was exposed to UV irradiation in aerobic conditions. 2 mL of aliquot was withdrawn periodically, centrifuged for removal of the catalyst, and the absorbance of supernatant solutions was measured to find out the concentration of MB as a function of time. The H2 production from methanol was also carried out in the same photoreactor with 50 mg of the catalysts under inert atmosphere by continuously purging nitrogen gas through the inlet of the reactor. A dedicated online gas chromatograph (GC, DGA I, Mayura Analytical Private Limited, Bangalore, India) was attached at the outlet of the batch reactor to monitor the H2 gas produced from the reactor. The GC was equipped with Hayesep-A (Mayura Analytical Private Limited, Bangalore, India), molecular sieve columns, and a thermal conductivity detector. The temperature of the injector, column, and detector was maintained at 60 °C, and Ar was passed as a career gas at 35 psi. The sampling loop volume was 500 µL.
III. RESULTS AND DISCUSSION
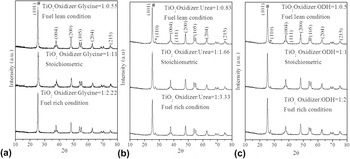
Figure 1 represents the X-ray diffraction (XRD) patterns of the combustion-synthesized nano TiO2 with three different fuels and with three different oxidizer to fuel ratios. TiO2 was synthesized with glycine crystallized in a pure anatase phase material, and also there was no significant difference in the XRD patterns of TiO2 synthesized by three different glycine conditions [Fig. 1(a)]. On the other hand, the TiO2 was synthesized with the fuel urea crystallized in a mixed phase of anatase and rutile [Fig. 1(b)]. However, the peak intensity ratio between anatase and rutile has not changed from urea lean to stoichiometric or to urea rich conditions. The TiO2 synthesized with ODH showed interesting XRD patterns. The synthesized TiO2 is crystallized in a mixed phase of anatase and rutile; however, the intensity of anatase to rutile has increased from fuel lean to stoichiometric and has further increased in the case of fuel rich condition [Fig. 1(c)]. Apparently, the nature of the fuel and its concentration played a crucial role in structure determination and phase quantification. Reference Guo, Li, Jiang, Li and Sun35,Reference Sclafani, Palmisano and Schiavello36 While the varied concentration of glycine only produced pure anatase TiO2 and urea produced a fixed ratio of mixed phase anatase and rutile TiO2, varied concentrations of ODH produced a wide-ranged anatase to rutile mixture. The fuels play an important role in the combustion synthesis. They form complexes with the metal ions facilitating homogeneous mixing of cations in the solution. During combustion the transient temperature goes momentarily high and the ignition temperature completely depends on the nature of the fuel used. The ignition temperature and the nature of combustion (i.e., voluminous or smoldering type combustion) influence the phase(s) formation. The phase formation is also expected to vary with fuel to oxidizer ratios. Rutile is a thermodynamically more stable phase than anatase, and higher combustion temperatures can result in more of rutile formation. The weight fraction of anatase, X a, was calculated by the equation X a = 1/(1 + (1/K)(I r/I a)), where I a and I r are integrated intensities of anatase at 2θ = 25.4° and rutile at 2θ = 27°, respectively, and K is the proportionality constant taken as 0.79. Reference Debnath and Chaudhuri37,Reference Hubbard, Evans and Smith38 While there was no rutile polymorph formation with glycine, the weight fraction of anatase to the rutile calculated for TiO2 synthesized with urea was 89:11 for the entire range of air to fuel ratio. In case of ODH, weight fractions of anatase to rutile were 92:8, 88:12, and 84:16 for fuel lean, stoichiometric, and fuel rich conditions, respectively. The rutile polymorph increased with the increase in concentration of ODH during combustion. The crystallite sizes of TiO2 with stoichiometric fuel of glycine, urea, and ODH were similar and approximately found to be 14.9 nm, 16.2 nm, and 14.9 nm, respectively. Apparently, the difference in fuel did not exhibit any significant difference in crystallite size.
XRD patterns of (a) TiO2 with glycine, (b) TiO2 with urea, and (c) TiO2 with ODH. (# and * indicates anatase and rutile phases, respectively).

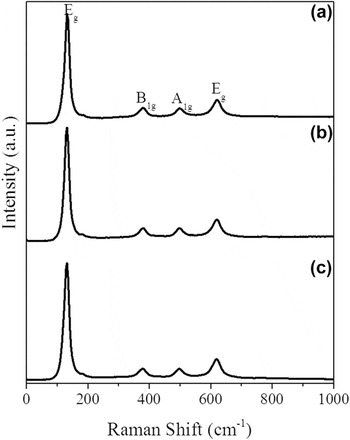
Further structural evidences from Raman spectra of the stoichiometrically combusted TiO2 are plotted in Fig. 2. All the spectra consist of a prominent peak at 133 cm−1 and the weak peaks at 378, 499, and 620 cm−1. The peaks at 133, 378, 499, and 620 cm−1 can be attributed to the Raman active vibrational modes of the anatase phase with symmetries of E g, B 1g, A 1g, and E g, respectively. All the three spectra look very similar without any significant difference. Though the XRD patterns of TiO2 synthesized with urea and ODH showed the rutile phase, no vibrational mode of rutile TiO2 was found in the Raman spectra. This could be due to the prevailing anatase and a very small percentage of rutile in the TiO2 synthesized by urea and ODH.
Raman spectra of (a) TiO2 with stoichiometric glycine, (b) TiO2 with stoichiometric urea, and (c) TiO2 with stoichiometric ODH.

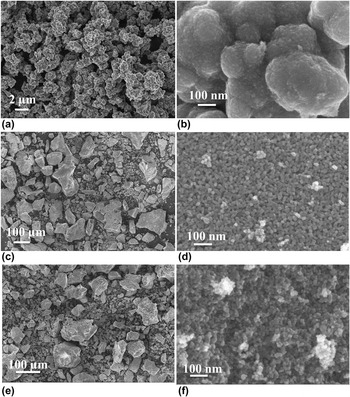
The surface morphological information obtained from FE-SEM images of the stoichiometrically combusted catalysts are shown in Fig. 3. Clearly from the low and high magnification images it can be concluded that the nature of the fuel plays a great influence on morphology of the synthesized TiO2. It must be noted that TiO2 synthesized with glycine was distinctly different both morphologically and structurally from the TiO2 made with urea and ODH; only glycine could produce spherical nano TiO2 particles, while the urea and ODH produced rock type particles. The high magnification image of glycine-produced TiO2 [Fig. 3(b)] shows fused spherical TiO2 particles of 100–200 nm size. The TiO2 made with urea and ODH were found from low magnification images [Figs. 3(c) and 3(e)] having irregular rock-like microparticles with the size widely ranging from 20 to 100 μm. High-resolution imaging revealed that these microparticles consisting of polycrystallite domains are in the size range of 15–20 nm. The crystallite sizes were in well agreement with the values obtained from XRD.
SEM images of (a, b) TiO2 with stoichiometric glycine, (c, d) TiO2 with stoichiometric urea, and (e, f) TiO2 with stoichiometric ODH.

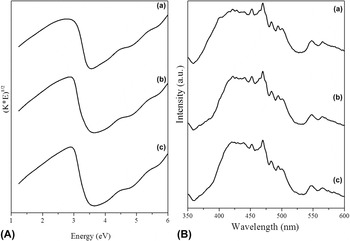
The electronic structure of the synthesized materials was probed with diffuse reflectance spectroscopy (DRS) and photoluminescence (PL) spectroscopy. The band gap was calculated by applying the Kubelka–Munk method from the DR spectra of the stoichiometrically synthesized catalysts and is shown in Fig. 4(a). The band gap values of TiO2 synthesized by glycine were found to be 3.46 eV, with urea 3.53 eV and with ODH 3.47 eV. Unlike structural and morphological differences, there was not significant difference in the band gap of TiO2 synthesized by using different fuels. Figure 4(b) shows the PL emission spectra of the stoichiometrically synthesized catalysts. The PL peak intensity shows the lifetime of photogenerated electrons and holes and this greatly influences the chance of photoexcited electrons and holes in the material participating in surface catalytic reactions. However, all the three catalysts showed no difference in photoluminescence intensity.
(A) Plot of (Kubelka–Munk factor (K = (1 − R)2/2R) × energy)1/2 versus energy, (a) TiO2 with stoichiometric glycine, (b) TiO2 with stoichiometric urea, and (c) TiO2 with stoichiometric ODH. (B) PL emission spectra of (a) TiO2 with stoichiometric glycine, (b) TiO2 with stoichiometric urea, and (c) TiO2 with stoichiometric ODH.

MB degradation is a typical oxidation type reaction. Suitable light exposure on the TiO2 creates electrons in the conduction band and holes in the valence band. The electrons in combination with dissolved oxygen produce
 ${\rm{O}}_2^ -$
, and holes in combination with water produce OH˙. Thus, the produced
 ${\rm{O}}_2^ -$
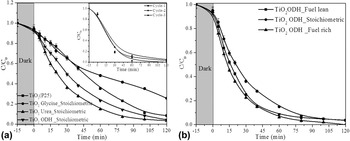
, OH˙, and holes oxidize the MB to the product. Figure 5(a) represents the photodegradation of MB with three different TiO2 made with stoichiometric fuels and commercial TiO2 (P25). The MB mixture was introduced to the UV light after 15 min of dark stirring with the catalysts. The TiO2 made with urea and ODH were found with similar catalytic activity (degraded 96% and 97% of MB, respectively, after 120 min of irradiation), whereas TiO2 with glycine degraded only 77% of MB in 120 min. The rates of photocatalytic MB degradation over TiO2 made with glycine, ODH, and urea were found to be 2.0 × 10⁻⁷, 4.8 × 10⁻⁷, and 7.3 × 10⁻⁷ mol/(L min), respectively. However, the initial rate of MB degradation over commercial TiO2 (P25) was 2.7 × 10⁻⁷ mol/(L min). It must be noted that TiO2 made with glycine has a pure anatase phase, whereas TiO2 made with urea and ODH are mixed phase compounds. The rate of photocatalytic degradation depends on the structure of TiO2, and it is believed in the literature that the transfer of photogenerated electrons and holes from one phase of TiO2 to another phase of TiO2 reduces the electron–hole recombination, and this could facilitate the catalytic process.
Reference Liu, Gu, Ji, Zou, Tang, Gao and Dong39,Reference Liu, Zhao, Andino and Li40
It must be noted that the TiO2 synthesized by three different fuels did not show any significant differences in the band position in the DRS and PL study. It is likely to be believed that the presence of the two phases in TiO2 synthesized by urea and ODH plays a synergistic role in transferring the photoexcited electrons from one conduction band to other and holes from one valence band to other. This enhances the life expectancy of the electrons and holes, which eventually enhances the photocatalytic rate of MB degradation over TiO2 made by urea and ODH. As TiO2 synthesized with stoichiometric urea showed the best catalytic performance in the lot, representative photocatalytic MB degradation recyclability of the same was performed for three cycles and is plotted in the inset of Fig. 5(a). As evident from the figure, the TiO2 made from urea possesses excellent recyclability till three consecutive cycles. The TiO2 synthesized by ODH showed variation in the phase formation with the variation of oxidizer to fuel ratio. To probe the role of the presence of varied concentrations of phases in the mixed phase compound, we further performed the photocatalysis of MB over TiO2 synthesized by ODH [Fig. 5(b)]. The initial reaction rate was marginally different, but all the three TiO2 catalysts (ODH lean, stoichiometric, and rich) degraded MB completely in 120 min. There was no significant role of variation of phase percentage over catalytic efficiency.
Photodegradation of MB (a) TiO2 with three fuels with stoichiometric fuel ratio and commercial TiO2 P25 (Inset: Recyclability of MB degradation with TiO2 made from stoichiometric urea), and (b) TiO2 with ODH in three different fuel conditions. The light was illuminated after 15 min of continuous stirring of MB and catalysts at dark. Periodical aliquot abstraction was made after light illumination to determine the MB concentration colorimetrically.

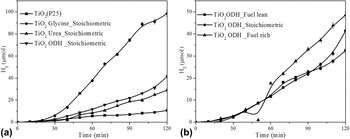
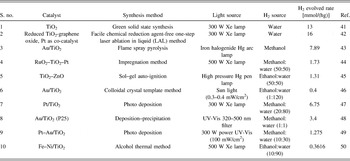
As it is believed in the literature, Reference Su, Bechstein, Sø, Vang, Sillassen, Esbjörnsson, Palmqvist and Besenbacher33 the synergetic effect of the presence of more than one TiO2 polymorph depends crucially on the specific catalytic reaction, therefore as another reaction we have studied hydrogen production from methanol. In this particular reaction, the photogenerated holes oxidize the methanol to formaldehyde, and thus the produced protons get reduced by the photogenerated electrons to yield gaseous hydrogen. The hydrogen production from methanol by using TiO2 made with stoichiometric fuel ratio is shown in Fig. 6(a). Interestingly, the glycine-produced TiO2 has apparently outperformed the other titania catalysts toward hydrogen production. TiO2 made with stoichiometric glycine produced 0.985 mmol/(h g) of hydrogen and with urea, ODH, and commercial TiO2 (P25) ∼0.29, 0.414, and 0.107 mmol/(h g) of hydrogen was produced, respectively. The catalytic hydrogen production over TiO2 made with stoichiometric glycine was 9 times higher compared to the commercial TiO2 (P25) catalyst. Though the TiO2 produced from urea and ODH consist of heterojunctions between anatase and rutile, apparently, these did not help in hydrogen production. It must be noted that commercial TiO2 (P25) also consists of both the anatase and rutile phases, and this also showed poor hydrogen production activity. The TiO2 with pure anatase produced more H2 compared to the other two synthesized catalysts and could be rationalized with its smaller particle size as observed from FE-SEM. We have compared our hydrogen production results with the published literature, and they are tabulated in Table II. Our results are comparable with the reported values; however, it is apparent from the table that with noble metal loading the hydrogen production is higher. As TiO2 made from ODH showed three different ratios of the polymorphs, the catalytic H2 production experiments were also carried out with ODH lean, rich, and stoichiometric conditions and are plotted in Fig. 6(b). There was no significant difference in the activity of hydrogen production with TiO2 made from ODH lean, rich, and stoichiometric conditions. It must be noted that the variation of polymorphic ratios of phases also did not show any difference in MB degradation.
Hydrogen production by (a) TiO2 with three fuels with stoichiometric fuel ratio and commercial TiO2 P25, and (b) TiO2 with ODH in three different fuel conditions. Estimation of gaseous H2 was carried out with the help of GC.

Comparison of the hydrogen production rates with TiO2 using different methods.

IV. CONCLUSION
TiO2 was synthesized by a one-step solution combustion method using three different fuels such as glycine, urea, and ODH. While the TiO2 synthesized with glycine crystallized only in the anatase polymorph, the urea, and ODH produced a mixed phase of anatase and rutile TiO2. The nature of the fuel played a critical role on the surface morphology as observed from FE-SEM and the phase formation as evident from powder XRD. The TiO2 made from glycine had smaller particle size than that of the other duo. However, the crystallite sizes of all the three synthesized catalysts were similar. During combustion, when the oxidizer to glycine and urea ratio was varied from lean to stoichiometric to rich condition, there was no structural and morphological effect on TiO2. However, with ODH with increase in fuel concentration, the rutile percentage increased in the mixed phase TiO2. In the photocatalytic degradation of MB, the mixed phase TiO2 outperformed the phase pure TiO2. It was also found out that the mixed phase commercial TiO2 (P25) outperformed the synthesized phase pure TiO2 in the photocatalytic degradation of MB. However, in the photocatalytic generation of H2, the pure phase TiO2 produced more H2 than mixed phase synthesized materials as well as the mixed phase commercial one. It could be concluded that the presence of polymorphs and its synergistic role through the creation of heterojunctions over catalysis depends crucially on the specific reaction. However, the percentage variation of phases did not affect the photocatalytic activity of any of these two reactions.
ACKNOWLEDGMENTS
SR thanks the Department of Science & Technology (SERB/F/825/2014-15) for the financial aid. The author also thanks BITS Pilani Hyderabad Campus for the financial assistance under “Additional Competitive Research Grant”.