Introduction
Which variety of democracy has the highest quality? A classic suggestion is the Westminster system, which ideally concentrates power in the hands of the majority and grants largely unbridled power exertion. In practice, pluralities instead of majorities often gain power (Powell, Reference Powell2000), and the ‘strong hand’ of majoritarian democracy can rather turn into an unsteady hand (Lijphart, Reference Lijphart2012: 257). As this potentially threatens government performance in addition to the representational record of democracy, power-diffusing ‘consensus’ democracy has been fielded as another ideal (Lijphart, Reference Lijphart2012). Other (quasi-)consociational systems top this approach up and emphasize the rule of the people, regional autonomy, and power sharing, such as embodied in Swiss democracy (Lijphart, Reference Lijphart1977; Vatter, Reference Vatter2014).
Yet another position is that ‘centripetalism’ (Gerring and Thacker, Reference Gerring and Thacker2008) combines the best political–institutional elements, namely proportionality and consensus in decision making, and few hurdles in implementation due to a lack of veto players outside the parliament and the executive. Most of the time, countries such as Sweden or Norway are not associated with bad news. The negative example is the United States, where the political system is under constant fire and has just recently, after the Congressional elections in November 2014, once again produced deadlock between the houses and the president. President Obama is hence threatened to finish the remainder of his second presidential term as a ‘lame duck’.
The debate appears to be far from settled. Obviously, institutions also have to fit the society they govern. Yet, some general trends can be observed. Much depends on what is meant by ‘the quality of democracy’. While some systems are designed to maximize inclusiveness, defined by the proportional consideration of the preferences of the citizenry, others focus on effectiveness, meaning a strong hand on behalf of the government for effective policy implementation (Powell, Reference Powell2000). Ultimately, the functioning of the ‘chain of responsiveness’ (Powell, Reference Powell2004) characterizing representative democracy needs a minimum of both – the inclusive formation, mobilization and aggregation of preferences as well as a successful implementation process that reflects the policy preferences induced (Bühlmann and Kriesi, Reference Bühlmann and Kriesi2013). This article discusses alternative approaches to empirical patterns of democracy and asks whether certain configurations outperform others in terms of representing the people and effective governance.
The discussion starts with Arend Lijphart’s (Reference Lijphart1984, Reference Lijphart1999, Reference Lijphart2012) distinction between consensus and majoritarian democracy, which is widely perceived as ground-breaking (Mainwaring, Reference Mainwaring2001; Taagepera, Reference Taagepera2003; Schmidt, Reference Schmidt2010) and has produced a number of follow-up studies (e.g. Armingeon, Reference Armingeon2002; Roller, Reference Roller2005; Gerring and Thacker, Reference Gerring and Thacker2008; Vatter, Reference Vatter2009). In his seminal 1999 piece Patterns of Democracy, updated in 2012, he also assesses the empirical performance of the different types of democracy, and reports that consensus democracy outperforms its majoritarian counterpart in terms of macro-economic management and also has a ‘kinder’ and ‘gentler’ record regarding broad policy orientation (Lijphart, Reference Lijphart2012: 274). Of special interest in our context, Lijphart (Reference Lijphart1999, Reference Lijphart2012: 276–277) also reports that consensus democracy enhances democratic quality in many single aspects such as Dahl’s (Reference Dahl1971) Polyarchy, Vanhanen’s (Reference Vanhanen1997) democratization, the EUI democracy indices, women’s representation in parliament and in cabinet, voter turnout, government–voter proximity, or citizens’ satisfaction with democracy.
Despite of its prominence, Lijphart’s (Reference Lijphart1999, Reference Lijphart2012) work has been widely criticized either for the typology itself or the analysis of the effects of consensual traits on democratic quality and performance (see discussion below). In our contribution, we re-investigate the relationship between political–institutional power diffusion and the quality of democracy for two reasons. First, Lijphart’s (Reference Lijphart2012) measures are rather minimalistic (Munck and Verkuilen, Reference Munck and Verkuilen2002) and do not adequately incorporate the multidimensionality of the concept ‘quality of democracy’ (Bühlmann et al., Reference Bühlmann, Vatter, Dlabac and Schaub2013). Relatedly, the assumption that consensus democracy affects all elements of democratic quality in the same beneficial way is untenable, as a trade-off between inclusiveness and effective implementation seems to exist (Powell, Reference Powell2000). We make use of the Democracy Barometer, a theoretically well-grounded instrument that tries to more accurately measure the multidimensionality of the quality of democracy, including both of these goals (Bühlmann et al., Reference Bühlmann, Merkel, Müller and Wessels2012).
A second reason for reconsidering the democratic quality thesis is Lijphart’s (Reference Lijphart2012) factual treatment of consensus democracy as a one-dimensional concept when assessing the performance and quality of consensus democracies (Roller, Reference Roller2005). This neglects the multidimensionality of the typology on the explanatory side, which features an ‘executives–parties’ as well as a ‘federal–unitary’ dimension, producing combinations such as proportional–unitary (Sweden), proportional–decentralized (Switzerland), majoritarian–unitary (United Kingdom), or majoritarian–decentralized (United States) types. Lijphart (Reference Lijphart2012) does not differentiate his expectations regarding the two dimensions or their combinations, and the empirical results focus almost exclusively on the executives–parties dimension. Following recent arguments on the potential supremacy of centripetal democracy (Gerring and Thacker, Reference Gerring and Thacker2008; McGann and Latner, Reference McGann and Latner2012), resembling the proportional–unitary type, this study assesses the effect of continuous combinations of proportional (executives–parties dimension) and decentralized (federal–unitary dimensions) power diffusion on the quality of a democracy, that is, its inclusiveness and effectiveness of implementation.Footnote 1 The results of interactive regression models, using a sample of 33 relatively developed democracies, provide only partial support for the hypothesis that centripetal democracy has the best overall record of democratic quality. While proportional–unitary systems show the highest levels of representation, majoritarian, and proportional–decentralized alternatives are not inferior in terms of participation and effectiveness.
The puzzle of the quality of democracy
Not one, but many theories on the empirical character of democracy exist, and the question which democratic architecture delivers the best performance and quality is an ancient yet prevailing one (Schmidt, Reference Schmidt2010). One of the most widely received approaches claiming to solve this puzzle is Arend Lijphart’s (Reference Lijphart1984, Reference Lijphart1999, Reference Lijphart2012). The ideal types of consensus and majoritarian democracy, described by this variant of empirical democracy research, differ in the extent to which power is concentrated or shared in the political system. In more detail, Lijphart (Reference Lijphart1999, Reference Lijphart2012) uncovers two dimensions of democracy, finding what he labels an ‘executives–parties’ and a ‘federal–unitary’ dimension. These mainly represent types of power diffusion within institutions or (collective) actors or between them (Lijphart, Reference Lijphart2012: 5). Each construct encompasses five politico-institutional variables, and a manifestation on a spectrum from majoritarian to consensual is possible. Consensus democracy on the executives–parties dimension ideally displays multiple parties, (oversized) multi-party government, a balance of power between executive and legislature, a proportional electoral system, and interest group corporatism. Federal–unitary consensus democracy ideally displays a federal structure, bicameralism, judicial review, a rigid constitution, and an autonomous central bank. Majoritarian democracy ideally features the opposite poles.
‘Consensus’ democracies, in particular as defined by Liphart’s (Reference Lijphart1999, Reference Lijphart2012) ‘executives–parties’ dimension, closely represent large portions of the electorate and feature multi-party systems, oversized cabinets, and other elements of power dispersion. Given the elites’ willingness to play the rules the way they suggest themselves, consensus democracies should produce more bargaining and eventually compromise (‘broad consensus’), and as a consequence, more inclusive and continuous policies are expected (a ‘steady hand’), leading to better records regarding the inclusiveness of government action and the quality of democracy (Lijphart, Reference Lijphart2012: 257). ‘Majoritarian’ democracies, resulting from more narrow (or even manufactured) majorities, the concentration of power in the cabinet, and the fewer restrictions faced by the executive, should have an ability of swift reaction and change of policy course, useful, for instance, in the face of sudden crisis (Schmidt, Reference Schmidt2010: 334–335), and maximizing effectiveness. Lijphart (Reference Lijphart1999, Reference Lijphart2012: 257) still maintains that consensus democracy and its deliberative, consensus- and continuity-building nature, even leads to more effective governance in aspects where majoritarian democracies could be regarded as superior, such as economic management. Notably, Lijphart (Reference Lijphart2012) does not discriminate much between the expected effects of his ‘executives–parties’ and ‘federal–unitary’ dimensions (the latter of which features a set of veto players such as second chambers or judicial review), but the empirical analyses (and in particular his findings), to the largest extent, rely on the first dimension (Lijphart, Reference Lijphart2012: 272–273, 293–294).
The general argument on the superiority of consensus over majoritarian democracy advanced by Lijphart (Reference Lijphart1999, Reference Lijphart2012) has quickly received critical attention. Others have developed alternative or independent arguments on the relationship between institutional configurations and government performance with direct implications for the broad quality of democracy (in particular, Armingeon, Reference Armingeon2002; Roller, Reference Roller2005; Gerring and Thacker, Reference Gerring and Thacker2008; McGann and Latner, Reference McGann and Latner2012). The essence of these contributions is that more mixed or qualified expectations are more plausible.Footnote 2 For instance, Armingeon (Reference Armingeon2002) expects a better record for quasi-‘consociational’ democracies only in the inclusion of large minorities, a better record for majoritarian democracies in controlling spending and inflation, and a draw in the field of economic outcomes, the inclusion of small minorities, and the quality of the democratic process. Others have questioned the usefulness of Lijphart’s (Reference Lijphart1999, Reference Lijphart2012) indices more fundamentally, among other reasons, for their mix of institutional and behavioral aspects such as federalism and cabinet type (Roller, Reference Roller2005; Ganghof, Reference Ganghof2005, Reference Ganghof2012; Schmidt, Reference Schmidt2010: 329). Alternative approaches, some of them prominently referring to the concept of veto players (Tsebelis, Reference Tsebelis2002), have proposed modifications (Armingeon, Reference Armingeon2002; Ganghof, Reference Ganghof2005, Reference Ganghof2012; Roller, Reference Roller2005; Gerring and Thacker, Reference Gerring and Thacker2008; Schmidt, Reference Schmidt2010; McGann and Latner, Reference McGann and Latner2012). Roller (Reference Roller2005) provides a thorough critique of Lijphart (Reference Lijphart1999), before opting for alternative constitutional and partisan veto player indices, giving rise to ‘informal’ and ‘constitutional majoritarian vs. negotiation’ democracies, which resemble modified executives–parties and federal–unitary dimensions. Ganghof (Reference Ganghof2005) highlights the interaction between the two principles of democracy, electoral and legislative majorities, which jointly shape the behavior of political elites and the performance of democracies. Similarly, a set of alternative approaches (Gerring and Thacker, 2005, Reference Gerring and Thacker2008; McGann and Latner, Reference McGann and Latner2012) focuses on the interaction between elements of the executives–parties and the federal–unitary dimensions. Gerring and Thacker (Reference Gerring and Thacker2008: 23) are strongly influenced by Lijphart (Reference Lijphart1999), but propose a rivaling ‘centripetal’ theory of democratic governance, arguing for a combination of inclusiveness and authority (measured by closed-list PR, unitarism, and parliamentarism) as the most effective structure. Along similar lines, McGann and Latner (Reference McGann and Latner2012: 826) propose a ‘simpler institutional theory’ of ‘PR-majority rule’, contrasting an ‘effective’ district magnitude and a modified veto index of ‘supermajoritarian restrictions’. Again, the combination of proportional representation and few veto players is deemed the most effective configuration.
In sum, there is an ongoing debate on the best theoretical conceptualization of empirical types of democracy and the anticipated effects (Doorenspleet and Pellikaan, Reference Doorenspleet and Pellikaan2013). We develop our own theoretical argument against the backdrop of the approaches discussed. Prior research indicates that several latent dimensions of democracy exist, which have been, in alternative yet similar specifications, labeled ‘executives–parties’ and ‘federal–unitary’ dimensions (Lijphart, Reference Lijphart1999, Reference Lijphart2012), ‘collective’ and ‘competitive veto points’ (Birchfield and Crepaz, Reference Birchfield and Crepaz1998), ‘constitutional’ and ‘informal negotiation vs. majoritarian’ democracy (Roller, Reference Roller2005), or interactively give rise to continuums of the empirical type of democracy, which depends on vote requirements across the electoral and legislative arenas (Ganghof, Reference Ganghof2005), the ‘centripetal’ (Gerring and Thacker, Reference Gerring and Thacker2008), or the ‘PR-majority rule’ (McGann and Latner, Reference McGann and Latner2012) nature of the configuration. The political–institutional context hence needs to be specified precisely. Such configurations can then be connected to the quality of democracy, where the hypotheses on the effects of empirical patterns of democracy depend on what exactly is meant by ‘quality’. We start from Lijphart (Reference Lijphart2012), but refine the argument, in particular relying on the theory of centripetalism (Gerring and Thacker, Reference Gerring and Thacker2008) as well as Powell’s (Reference Powell2000) notion that majoritarian and proportional democracy tend to maximize effectiveness and inclusiveness, respectively. This framework of analysis is introduced in the subsequent section.
This approach takes care of the double neglect of multidimensionality in Lijphart’s (Reference Lijphart1999, Reference Lijphart2012) analysis. On the one hand, his almost exclusive restriction to effects of the executives–parties dimension is deficient because it ignores potential interactions, which can be stylized using the four types of democracy: proportional–decentralized (e.g. Switzerland), proportional–unitary (e.g. Sweden), majoritarian–decentralized (e.g. United States), and majoritarian–unitary (e.g. United Kingdom). On the other hand, Lijphart (Reference Lijphart1999, Reference Lijphart2012) fails to adequately incorporate the multidimensionality of the quality of democracy. Consensus democracy may not have a positive effect on every element of democratic quality. A positive impact of the executives–parties dimension on the quality of representation seems rather obvious. But why should, for instance, power-sharing among the political elite enhance transparency or foster governmental effectiveness? There may be rather different mechanisms at work, as well as alternative explanations, and we test the effects of political–institutional configurations (Gerring and Thacker, Reference Gerring and Thacker2008) on measures of effectiveness and inclusiveness (Powell, Reference Powell2000).
An argument on empirical patterns and the quality of democracy
How are political–institutional configurations connected to the quality of democracy? The causal chain necessarily runs through actors, typically parties or political elites. Alternative accounts of actor behavior and mechanisms involved exist. Lijphart (Reference Lijphart2012: 2, 257) fields brief general arguments on the supremacy of consensus as opposed to majoritarian democracy, which cite alternative definitions of responsiveness as key defining elements distinguishing consensus and majoritarian democracy as well as the role of a steady hand in governing, while consciously focusing on empirics elsewhere.
Elaborating on a possible micro-foundation, a number of scholars rely on rational choice institutionalism (Grofman, Reference Grofman2000: 6; Roller, Reference Roller2005: 91, 120; Ganghof, Reference Ganghof2012: 53–55). Accordingly, given power diffusion – such as embodied in proportional electoral rules, large party systems, inclusive coalitions, and powerful oppositions – political elites have incentives (yet are not forced, see Armingeon, Reference Armingeon2002: 86) to represent larger segments of society at the electoral stage (Golder and Stramski, Reference Golder and Stramski2010) and to negotiate agreements at the legislative and executive stages in order to gain or remain in power (Ganghof, Reference Ganghof2012). Regimes of veto players, such as second chambers or judicial courts, can be used by oppositional political elites to obstruct the goals of those ruling, leading to blockage rather than further consensus (Ganghof, Reference Ganghof2005).
In what is an alternative, and perhaps more fitting, framework for the analysis of the nexus between the broad political–institutional character of democracy and its track record, Steiner et al. (Reference Steiner, Bächtigér, Spörnli and Steenbergen2004) as well as Gerring and Thacker (Reference Gerring and Thacker2008) cite mechanisms, which can be subsumed under the notion of deliberation. Such a perspective is compatible with many elements of the older research on consociational democracy, emphasizing a ‘spirit of accommodation’ (Lijphart, Reference Lijphart1968) or ‘amicable agreement’ (Steiner, Reference Steiner1974) among political elites. Along these lines, Steiner et al. (Reference Steiner, Bächtigér, Spörnli and Steenbergen2004: 78) suggest that the quality of deliberation is increased by political–institutional power diffusion in the form of consensus (vs. competitive) democracy, parliamentarism (vs. presidentialism), or strong (vs. weak) veto players, but also by the non-public nature of communication or the non-polarized character of issues (Pedrini, Reference Pedrini2014). For example, joint decision making and cooperation are encouraged by grand coalitions (Steiner et al., Reference Steiner, Bächtigér, Spörnli and Steenbergen2004: 80). Similarly, stronger parties, have facilitated conflict mediation via face-to-face interactions, and have enhanced policy coordination under centripetalism, which are the mechanisms proposed by Gerring and Thacker (Reference Gerring and Thacker2008).
Here, we focus on the observable implications of such arguments, and in particular adopt the assumption that consensus democracy (Lijphart’s executives–parties dimension), shaped by proportionality, enhances inclusiveness and deliberation. This might also translate into more effective policies. We follow Gerring and Thacker (Reference Gerring and Thacker2008) and Ganghof (Reference Ganghof2012) in expecting some rather suppressive effects of veto players or decentralization (Lijphart’s federal–unitary dimension). The predictions of more rational–instrumental approaches regarding the effects of power diffusion on the quality of democracy, happen to be largely identical to those of deliberation theory.
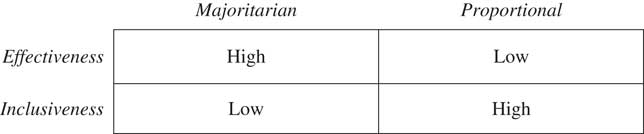
Moving through a number of existing approaches to empirical patterns of democracy, we build up our theoretical expectations in order to derive hypotheses. This requires a more nuanced concept of the quality of democracy. In a stylized view, democratic quality and performance can be conceptualized in terms of a trade-off between effectiveness and inclusiveness (Powell, Reference Powell2004; Bühlmann and Kriesi, Reference Bühlmann and Kriesi2013). This approach is mainly concerned with electoral rules and their consequences and, hence, the executives–parties dimension. From this perspective, depicted in Figure 1, political systems with high levels of proportional power diffusion (executives–parties dimension) are expected to maximize inclusiveness, while (majoritarian) systems concentrating power, maximize effectiveness.
Trade-offs between majoritarian and proportional visions of democracy (Powell, Reference Powell2000).

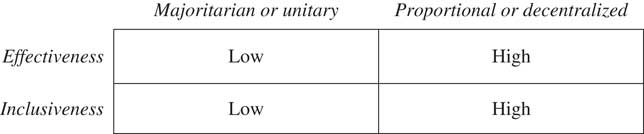
Figure 2 displays what can be called the ‘classic’ approach proposed by Lijphart (Reference Lijphart2012), featuring a general expectation that consensus democracy outperforms majoritarian democracy in terms of the quality of democracy, both in terms of effectiveness and inclusiveness. In line with this framework, Figure 2 does not feature a differentiation between the possible combinations of consensus democracy along the executives–parties (majoritarian vs. proportional) and federal–unitary (unitary vs. decentralized) dimensions, but shows uniform or rather unspecified effects.
Expectations in Lijphart (Reference Lijphart2012).

Gerring and Thacker (Reference Gerring and Thacker2008) add the notion of configurations of majoritarian vs. proportional and unitary vs. decentralized democracy. ‘Centripetal’ democracy, in essence the combination of proportional and unitary features, accordingly outperforms all other types of empirical democracy (Figure 3). At the theoretical level, this involves its benefits in terms of inclusion and – as Gerring and Thacker (Reference Gerring and Thacker2008) put it – authority (and hence effective implementation), while the dependent variable is framed in terms of governance and outcomes.
Expectations in Gerring and Thacker (Reference Gerring and Thacker2008).

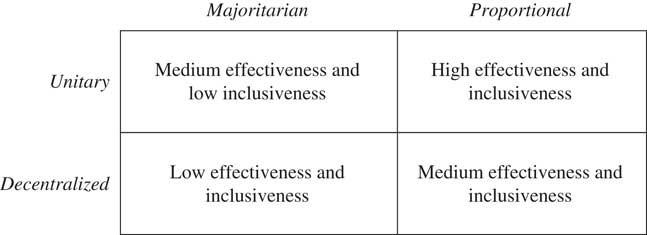
The focus of this article is the multi-dimensional nature of both patterns of democracy and the quality of democracy. The hypotheses derived consider, on the one hand, that all of majoritarian–unitary, majoritarian–decentralized, proportional–unitary, and proportional–decentralized political systems exist, and that these variants can either maximize the inclusiveness or the effectiveness of democracy. The analytical scheme of the study is depicted in Figure 4, displaying our revised approach to patterns and the quality of democracy.
Analytical scheme applied.

Contrasting these expectations with Figures 1–3, three aspects are noteworthy. First and foremost, the interaction between the executives–parties (majoritarian vs. proportional democracy) and the federal–unitary (unitary vs. decentralized democracy) is expected to matter for the quality of democracy (Gerring and Thacker, Reference Gerring and Thacker2008). Second, trade-offs between inclusiveness and effectiveness are acknowledged (Powell, Reference Powell2000). Third, the executives–parties dimension is assumed to be somewhat more central to democracy (Powell, Reference Powell2000), or, conversely, the federal–unitary dimension to be rather detrimental to the quality of democracy (Gerring and Thacker, Reference Gerring and Thacker2008) or at least problematic theoretically, which is also reflected by its rather unimpressive stand-alone empirical record (Lijphart, Reference Lijphart2012).Footnote 3
As a consequence, the expectations shown in Figure 4 follow Gerring and Thacker (Reference Gerring and Thacker2008) in that the combination of proportional and unitary democracy should outperform all other forms of democracy both in terms of inclusiveness and effectiveness (compare upper right vs. lower left cell). At the theoretical level, we differentiate the expectations for the other combinations, though, and introduce the refining argument (see upper left cell) that majoritarian democracy (of the executives–parties type) in unitary systems might increase effectiveness (but not inclusiveness) to a certain extent. In other words, while a steady and free hand might work best, a strong and free hand is still expected to be better than a strong but blocked hand. Given the special status of proportionality compared with decentralization, we also do not expect that decentralization in proportional systems removes all of its effects on both effectiveness and inclusiveness, expecting medium levels instead (lower right cell).
The primary focus of the empirical analysis is on the interaction between proportional and unitary democracy. A full test of the further, nuanced expectations is not possible using the regression model with interaction effects required to test the focal expectation.Footnote 4 The qualifications on potential trade-offs, and the lesser role of decentralization, likely imply reduced effects of proportional–unitary democracy on both effectiveness and inclusiveness. Still and in sum, the focal interactive hypothesis on the expected net effect of combining proportional and unitary democracy is:
Hypothesis 1a The combination of proportional and unitary democracy maximizes effectiveness.
Hypothesis 1b The combination of proportional and unitary democracy maximizes inclusiveness.
To illustrate, and in terms of effectiveness, we expect Sweden to outperform Switzerland as well as the United Kingdom, which should in turn top the United States. In terms of inclusiveness, the ranking changes slightly, with Sweden expected to outperform Switzerland, which should show a better record than both the United States and the United Kingdom. In a further step, the concepts of majoritarian vs. proportional, as well as unitary vs. decentralized democracy, inclusiveness and effectiveness are operationalized.
Measuring empirical patterns and the quality of democracy
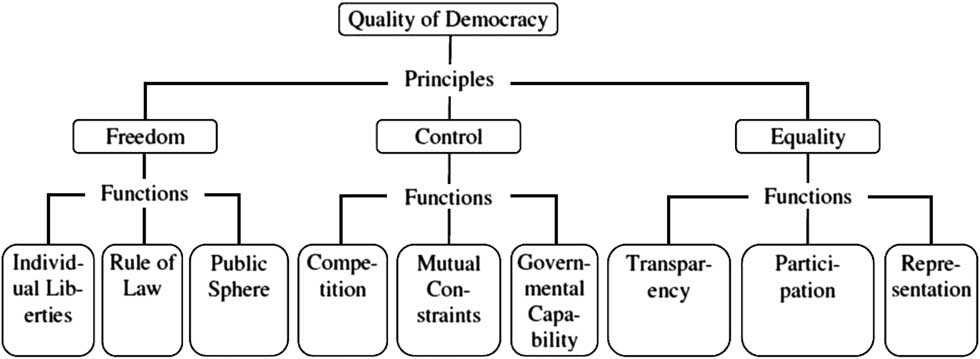
This section introduces the database of the analysis, requiring an operationalization of empirical patterns as well as the quality of democracy. We start with the dependent variable of this study, the quality of democracy. As discussed above, we are interested in measures of both the effectiveness and the inclusiveness of democracy. The Democracy Barometer is a recently introduced instrument aiming at measuring the quality of democracy shaped by all of institutional, policy, and outcome factors as well as the behaviour of citizens (Bühlmann et al., Reference Bühlmann, Merkel, Müller, Giebler and Wessels2011a, Reference Bühlmann, Merkel, Müller, Giebler and Wesselsb, Reference Bühlmann, Merkel, Müller and Wessels2012). It is based on liberal as well as participatory ideas of democracy and deducts the fundamental elements of representative democracy in three strictly theoretical steps (compare Figure 5).
Concept tree of the Democracy Barometer. Source: Bühlmann et al. (Reference Bühlmann, Merkel, Müller and Wessels2012).

Dividing the quality of democracy into the principles ‘equality’, ‘freedom’, and ‘control’ the Democracy Barometer accounts for conceptual multidimensionality. Freedom refers to the absence of heteronomy and, hence, requires the protection and guarantee of individual rights under a secure rule of law. Equality, particularly understood as political equality, aspires to equal treatment of the citizens in the political process and to equal access to political power. It is argued that freedom and equality interact and can constrain each other, and that optimizing and balancing freedom and equality are the core challenges of any democratic system. To maintain a dynamic balance between freedom and equality, a further fundamental principle of democratic rule is needed: control. Control is not seen as a simple auxiliary for the balance of the two other principles but an important basis of democracy itself; it is a means by which citizens maintain the accountability and responsiveness of their representatives. To guarantee and functionally secure freedom, equality, and control, a democratic regime must fulfill several functions. The Democracy Barometer defines three democratic functions for each principle, related to individual liberties, rule of law, public sphere, competition, mutual constraints, government capabilities, transparency, representation, and participation. These functions are operationalized using single indicators.
It is argued that the quality of a given democracy is high when these nine functions are fulfilled to a high degree. Yet, a simultaneous maximization of all nine functions is impossible. Democracies are seen as systems whose development is perpetually negotiated by political and societal forces. Hence, democracies weigh and optimize the nine functions differently. Still, the degree of fulfillment of each of these nine functions can be measured. This requires a further conceptual step: the various functions are based on constitutive components. Each function is further disaggregated into two components, which, finally, lead to several subcomponents and indicators. Given space limitations, we do not discuss each Democracy Barometer indicator, but it is worth noting that the Democracy Barometer consists of a total of 100 indicators, each of which was selected from a large collection of secondary data.Footnote 5
As a compound measure, the Democracy Barometer captures both aspects of inclusiveness and effectiveness as well as issues beyond the scope of this research, or captured by the explanatory variables. To put our theoretical expectations to an empirical test, we rely on four functions, which closely relate to these concepts. The functions of participation and representationFootnote 6 are taken as operationalizations of inclusiveness, while the functions transparency and government capability are used to measure effective implementation. We, hence, do neither rely on the aggregate scores of overall democratic quality nor on single indicators, but take advantage of the theoretical constructs at an intermediate level introduced and measured by the Democracy Barometer.
For a justification of the selection of the four functions, consider that a key element of representative democracy linking preferences and outcomes is the chain of responsiveness (Powell, Reference Powell2004; Bühlmann and Kriesi, Reference Bühlmann and Kriesi2013: 58), featuring the mobilization, aggregation, and implementation of preferences. In a condensed form, responsiveness is about achieving inclusiveness in terms of political preferences as well as their effective implementation. In this model, democratic functions – such as representation, participation, transparency, and government capability – are requirements for the achievement of inclusiveness and effectiveness.
In a high-quality democracy, all persons affected by a political decision should have the right to participate in shaping this decision. This implies that all citizens in a state must exercise suffrage rights and that these rights are used in an equal manner. Equal respect for, and consideration of, all interests by the political representatives are possible only if participation is as widespread and as equal as possible. In representative democracies, the possibility of co-determination is ensured by means of representation agencies. Responsive democracies, thus, must ensure that all citizens’ preferences are adequately, that is, descriptively and substantively, represented in elected offices. Responsive implementation, that is, ‘doing what the citizens want’ (Powell, Reference Powell2004: 94) requires governmental capability. The Democracy Barometer measures this concept by analyzing the availability of resources for the government as well as conditions for efficient implementation. Transparency also is crucial for effective implementation. To act responsively, a government must be controlled. Of course, such evaluation is only possible if the political process is transparent: policy-makers are induced to keep their promises and implement their programs only if they are monitored (Bühlmann and Kriesi, Reference Bühlmann and Kriesi2013: 5).
Turning to the measurement of empirical patterns of democracy, we require measures of majoritarian vs. proportional, as well as unitary vs. decentralized democracy, to capture the intuitions of Gerring and Thacker (Reference Gerring and Thacker2008), Lijphart (Reference Lijphart2012), as well as Powell's (Reference Powell2000). Despite often well-taken critical evaluations, we stay close to Lijphart’s (Reference Lijphart1999, Reference Lijphart2012) original approach, which captures these concepts well.Footnote 7 Thus, we rely on what closely resembles his executives–parties and federal–unitary dimensions using additive index building with standardized scores of both institutional and behavioral indicators.
We refrain from the full incorporation of direct democracy (Vatter, Reference Vatter2009) or presidentialism (Roller, Reference Roller2005: 109–110) into the typology, and keep the rather remotely associated central bank independence and corporatism (Armingeon, Reference Armingeon2002; Taagepera, Reference Taagepera2003). We rely on a more up-to-date time frame, ranging from 1997 to 2002, and improve several measurements, including executive–legislative relations and cabinet type (Vatter and Bernauer, Reference Vatter and Bernauer2010). Furthermore, federalism and decentralization are now considered equal aspects in their own right. This does not fundamentally change the concepts and the positions of countries, though.
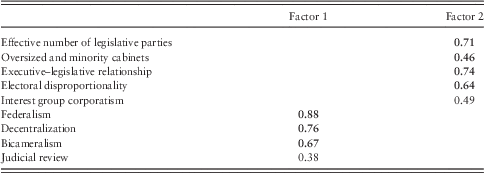
In analogy to Lijphart (Reference Lijphart1999, Reference Lijphart2012), we conduct a principal factor analysis with 11 initial indicators (his original 10 plus decentralization, see Table 1), taking averaged values from 1997 to 2002.Footnote 8 This analysis shows that in our sample of 33 democracies (see footnote 11), central bank independence does not load substantively on any dimension, whereas constitutional rigidity loads on the executives–parties dimension – contrary to theoretical expectations. Consequently, both are excluded from the final factor analysis. The final model features two dimensions with no split loadings that correspond to Lijphart’s (Reference Lijphart2012) dimensions (see Table 1). The executives–parties dimension comprises the effective number of parliamentary parties, cabinet type, executive–legislative relationship, the degree of electoral disproportionality, and interest group system. The (slightly varied) federal–unitary dimension consists of the degree of federalism, fiscal decentralization, bicameralism, and the strength of judicial review.
Factor loadings of nine political–institutional variables in 33 countries, 1997–2002

Principal factor analysis; factors with Eigenvalues over 1.0 extracted; varimax orthogonal rotation; factor loadings above 0.3 reported; loadings above 0.5 bold. Central bank independence and constitutional rigidity excluded.
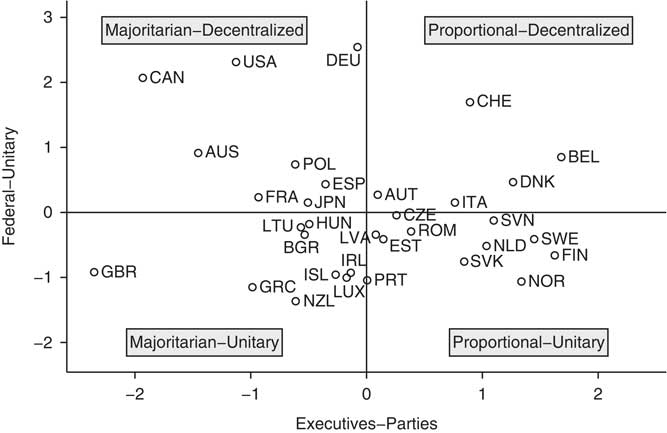
We again follow Lijphart (Reference Lijphart2012) and build additive indices for the two dimensions, representing the standardized sums of each of the standardized indicators.Footnote 9 The values on the two dimensions mirroring these two additive scores generally vary between around −2 and 2.Footnote 10 The exact location of the countries on the two mutually independent dimensions of democracy can best be depicted graphically on a conceptual map of democracy (see Figure 6).
Two dimensions of democracy, 1997–2002. See footnote 11 for country labels. Additive indices using the variables associated with each dimension shown in Table 1. Positive values=consensus democracy; negative values=majoritarian democracy. Executives–parties dimension=consensus democracy on the executives–parties dimension. The variable is constructed adding up the standardized scores of the number of parties, cabinet type, executive–legislative relations, electoral disproportionality, and corporatism. The signs of executive–legislative relations and electoral disproportionality are reversed so that higher values always indicate consensus democracy. Federal–unitary dimension=consensus democracy on the federal–unitary dimension. The variable is constructed adding up the standardized scores of federalism, decentralization, bicameralism, and judicial review. In both cases, average values over the period 1997–2002 are used, and the results are standardized once again for comparison between dimensions.

Some face validity of the measurement arises from the location of some well-known political systems. For instance, The United Kingdom is shown to occupy a majoritarian–unitary position in the period covered, the United States is majoritarian–decentralized, Switzerland is confirmed as an example of the proportional–decentralized type, and Sweden as a proportional–unitary country.
Empirical analysis: the multidimensionality of patterns and quality
The empirical evaluation centers on the analytical scheme are presented in Figure 4. In particular, the goal of the analysis is to pit majoritarian–decentralized variants of democracy against proportional–unitary ones, following the logic of centripetalism (Gerring and Thacker, Reference Gerring and Thacker2008). An empirical test of the conjecture that centripetal democracies outperform majoritarian–decentralized ones in terms of democratic quality requires a careful sample selection, adequate measures of the character as well as the quality of democracy, and a fitting statistical model.
Instead of a strongly heterogeneous sample such as the one featured in Lijphart (Reference Lijphart1999, Reference Lijphart2012) (see Armingeon Reference Armingeon2002; Schmidt Reference Schmidt2010), we concentrate on economically relatively developed, established democracies. The sample consists of 33 countries, which are mainly European but also covers Australia, Canada, Japan, and the United States.Footnote 11 Being based on the case selection of the Democracy Barometer, all of the cases included show values above 8 on the Polity scale, which ranges from −10 to 10. Hence, we can assume a minimum of constancy in the democratic context within which we study the effects of democratic architecture on quality, such as basic rights and freedoms or the absence of a massive erosion of democracy by corruption.
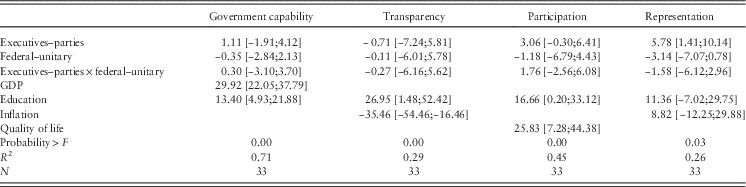
We incorporate both the multidimensionality of democratic quality as well as of empirical patterns of democracy in the analysis. In particular, we analyze the interactive impact of proportional vs. majoritarian, and unitary vs. decentralized democracy, on the quality of democracy in terms of inclusiveness and effectiveness, measured using four functions from the Democracy Barometer. Two continuous indices of the character of democracy are used (see above). The first captures proportional power diffusion, whereas the second captures centralization. The dependent variables are government capability and transparency to operationalize the effectiveness and representation, and participation to operationalize the inclusiveness of governance. For the indices measuring empirical patterns of democracy, mean values for 1997–2002 are used, assessing their effect on the quality of democracy (mean value between 2002 and 2007) with a certain lag allowing effects to unfold. Linear regression models are used to study the relationship between democratic architecture and quality, specifying an interaction between proportional and decentralized power diffusion to analyze the focal hypotheses. In all models, we control for socio-economic macro factors (Li and Reuveny, Reference Li and Reuveny2003; Inglehart and Welzel, Reference Inglehart and Welzel2005).Footnote 12 See Table A1 for the detailed results of the regressions.
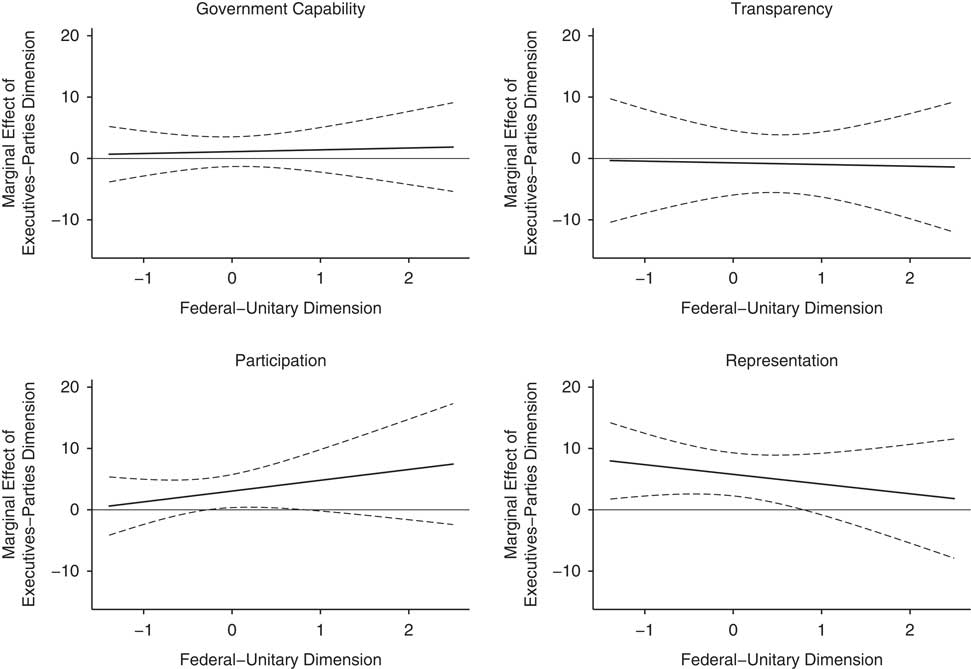
The focal results of the models, namely the interactive effects of the two dimensions of power diffusion on democracy, are visualized in Figure 7. Marginal effects (along with 90% confidence intervals) of the executives–parties dimension (where higher values indicate proportional vs. majoritarian democracy) are displayed on the y-axis, conditional on the values of the federal–unitary dimension (higher values indicate decentralized vs. unitary democracy) shown on the x-axis. This allows an evaluation of Hypotheses 1a and 1b, stating that democratic architectures maximizing proportionality and centralization should outperform others both in terms of effectiveness and inclusiveness (compare Brambor et al., Reference Brambor, Clark and Golder2006). An ascending slope indicates an increasing effect of proportional democracy, the more pronounced veto structures in a country are, whereas a descending slope indicates that the strength of the effect of the executives–parties dimension decreases with growing values on the federal–unitary dimension. In other words, proportional–unitary (centripetal) democracies show the highest quality of democracy if the effect of proportional power diffusion takes a maximal positive value somewhere in the upper-left area, while majoritarian–unitary systems (the Westminster model) perform best if a minimal negative effect of proportional power diffusion is observed in the lower left area. Proportional–decentralized democracies (resembling Lijphart’s Reference Lijphart2012 consensus democracies) emerge as ‘winners’ if a positive effect is maximized in the upper-right area, and majoritarian–decentralized ones (like the United States) when it is minimized in the lower right area.
Interactive effects proportional vs. majoritarian and decentralized vs. unitary democracy. Marginal effect of the executives–parties dimension in dependence of the federal–unitary dimension. Higher values indicate proportional and decentralized democracy, respectively. Dashed lines indicate 90% confidence intervals.

The four panels of the graph illustrate the conditional effect of the executives–parties dimension on the two measures each for effectiveness (government capability and transparency) and inclusiveness (participation and representation). Starting with effectiveness, no statistically significant effects of proportional vs. majoritarian democracy are found for both capability and transparency, and the degree of decentralization does not alter this diagnosis. Substantively, this implies that Hypotheses 1A cannot be confirmed, as centripetal configurations do not have a better record in terms of effectiveness. Notably, proportional democracy is not associated with lower levels of transparency as well, which could be suspected given its tendency towards non-public settings of communication (Steiner et al., Reference Steiner, Bächtigér, Spörnli and Steenbergen2004: 88).
The results shown in Figure 7 reveal a different pattern for the two indicators of inclusiveness, namely participation and representation, lending partial support to Hypothesis 1B. Proportionality, in other words stronger consensus democracy on the executives-parties dimension, increases the quality of democracy, but this effect diminishes given higher levels of decentralization, or stronger consensus democracy on the federal–unitary dimension. For participation, the relationship is less clear-cut, and only the combination of proportionality and intermediate levels of decentralization displays a statistically significant positive effect. Hence, participation appears to be encouraged by power diffusion in parties and executives, but only in combination with additional veto players (such as federal institutions), unless these are abundant.
Four cases have been cited before to illustrate the expectations and are also used to make more sense of the findings: Sweden as a specimen of the proportional–unitary type, the United States as a prototype of the majoritarian–decentralized type, the United Kingdom as a majoritarian–unitary example, and Switzerland representing a proportional–decentralized architecture of democracy. Do the results confirm the ranking anticipated by centripetalism, where Sweden should come out on top before Switzerland, the United Kingdom, and the United States in terms of democratic quality? The answer is mixed. Inferring from the models and their predictions (instead of actual country scores of democratic quality), which incorporate control variables, centripetal democratic architectures, such as implemented in Sweden, display a higher level of representation compared with all other variants. Given that the Democracy Barometer’s measure of representation, that was used, contains descriptive and substantive elements such as the gender balance in politics, policy congruence, or the absence of restrictions on the inclusion of minorities, this effect is interpreted as indicative of a relationship between centripetalism and democratic inclusiveness. In line with expectations on power diffusion and inclusiveness, countries with a proportional–decentralized architecture such as Switzerland still have a slight advantage over majoritarian–unitary countries such as the United Kingdom in terms of representation, but the difference is not statistically significant (see right-hand side of Figure 7, panel ‘Representation’). Majoritarian–decentralized democracies such as the United States finish last in the model prediction for representation.
At the same time, the locally restricted effects of proportional and decentralized power diffusion on participation points to a complicated relationship. Apparently, consensus democracy on the executives–parties dimension does not necessarily increase political participation, but its combination with a moderate number of access points (decentralization) might lead to the highest levels of turnout and the like. This result tends to favor more ‘average’ democratic architectures over the rather pure or extreme cases of centripetal, proportional–decentral, majoritarian–unitary, or majoritarian–decentral democracy.
Furthermore, the results yield little evidence on the dominance of any model of democracy regarding what we have broadly defined as the effectiveness of democracy and measured using aggregated variables of government capability and transparency from the Democracy Barometer. Hence, from this analysis, we cannot infer that democracies such as Sweden are superior to others such as the United States, Switzerland, or the United Kingdom in this respect. The finding on transparency can partly be explained by sample selection and the focus on more developed democracies, as the measure captures corruption and basic information freedom, in addition to the transparent communication of government policies, which might suffer from consensual decision making behind closed doors. Government capability also has some elements, which vary more strongly between unstable or young and consolidated democracies, such as intervention by the military.
In sum, and drawing on the models presented, proportional–unitary types of democracies appear to fare best with regard to representation, in line with the general expectation that veto players curb the effects of the executives–parties dimension. At the same time, variants of majoritarian as well as proportional–decentralized democracy are not outperformed in terms of effectiveness (government capability and transparency) or participation. Further research is needed to judge these results, which are at odds with those reported by Lijphart (Reference Lijphart2012) or Gerring and Thacker (Reference Gerring and Thacker2008), most likely due to the sample and dependent variables studied. In particular, the relationship between democratic architectures and government performance or effectiveness might be more clearly visible in certain areas or for outcomes such as economic inequality, where developed democracies also vary more strongly. The findings on participation and transparency can also be read as a reminder of the pitfalls of strong proportional power diffusion.
Conclusion
This study re-evaluates the question of which democratic architecture provides the best quality. Moving through the line-up of alternative contenders, we improve upon the general expectation that consensus democracy leads to the highest levels of democratic quality (Lijphart, Reference Lijphart2012). This involves two areas of improvement, both concerned with conceptual multidimensionality. On the side of the dependent variable, we differentiate between democratic quality in terms of inclusiveness and effectiveness, and expect that alternative democratic architectures face a trade-off between these goals (Powell, Reference Powell2000). On the explanatory side, we fully consider alternative configurations of relatively independent political–institutional pillars of democracy, concerned with the proportionality of party systems and executives (executives–parties dimension) and the level of decentralization of the state structure (federal–unitary dimension), respectively. In theoretical terms, the argument in particular draws on the centripetal model of democratic government, stating that proportional–unitary democracy maximizes both authority and inclusion (Gerring and Thacker, Reference Gerring and Thacker2008). This involves institutions that integrate political interests, for instance, through proportional electoral system, grand government coalitions and corporatism, whereas centralized structures ensure an effective mechanism for reaching and implementing political decisions. The argument proposes that voices, not vetoes guarantee the highest quality of democratic governance (Gerring and Thacker, Reference Gerring and Thacker2008).
The results of interactive regression models relying on a sample of 33 relatively developed democracies only partially supports the expectations formulated. The centripetal model maximizes levels of representation, and a combination of proportionality and intermediate levels of decentralization is associated with the highest levels of the quality of participation. Simultaneously, there is little evidence that the proportional–unitary type of democracy outperforms all others in terms of the effectiveness of government. This is reminiscent of the refined expectations shown in Figure 4, indicating that alternative ways to achieve a high quality of democracy and in particular effective government might exist, such as the strong and unconstrained majoritarian–unitary hand or proportional–decentralized practices.
In sum, political–institutional configurations matter, in line with previous research on the benefits of ‘centripetalism’ or ‘PR-majority rule’ (Gerring and Thacker, Reference Gerring and Thacker2008; McGann and Latner, Reference McGann and Latner2012), and different models of democracy maximize different aspects of the quality of democracy (Powell, Reference Powell2000). While producing a draw on effectiveness and participation, the results largely support the claim that democracies which combine the characteristics of broad-based multi-party coalition government with centralized structures such as Sweden, Norway, and the Netherlands can perform better than pure, proportional–decentralized consensus democracies in terms of representation and, also likely, inclusiveness more generally.
Future research should hence take into account the double multidimensionality in empirical patterns and the quality of democracy (Bühlmann et al., Reference Bühlmann, Vatter, Dlabac and Schaub2013). It should also shed more light on the nuances of the relationship, and in particular look into the alternative causal pathways to effective government. The mechanisms involved also deserve further attention. For instance, is there fine-grained evidence that grand coalitions increase the quality of deliberation and hence more favorable outcomes (Steiner et al., Reference Steiner, Bächtigér, Spörnli and Steenbergen2004)? Here, a quantitative–comparative test of the centripetal model has been provided, demonstrating the relevance of a differentiation between alternative democratic architectures as well as aspects of democratic quality.
Appendix
Regression results