1 Introduction
The characteristics of flows generated by vibrating thin plates have been studied extensively in the past, due in part to their importance in understanding the natural behaviour of aquatic and flying species, especially when the collective behaviour of these species in a group is of interest (Jian & Shao Reference Jian and Shao2006; Gravish et al. Reference Gravish, Peters, Combes and Wood2015; Yuan et al. Reference Yuan, Liu, Ren and Dong2015; Khalid, Akhtar & Dong Reference Khalid, Akhtar and Dong2016). They also have enabled innovative applications such as piezoelectric fans (Ebrahimi, Wang & Ju Reference Ebrahimi, Wang and Ju2018; Hales & Jiang Reference Hales and Jiang2018) for thermal management of electronics (Jafari et al. Reference Jafari, Masoudi, Irajizad, Nazari, Kashyap, Eslami and Ghasemi2018; Nazari et al. Reference Nazari, Masoudi, Jafari, Irajizad, Kashyap and Ghasemi2018), fluid acceleration using ionic polymer metal composites (IPMCs) (Abdelnour et al. Reference Abdelnour, Mancia, Peterson and Porfiri2009; Peterson, Porfiri & Rovardi Reference Peterson, Porfiri and Rovardi2009; Prince et al. Reference Prince, Lin, Lin, Peterson and Porfiri2010) and energy harvesting (Williamson & Govardhan Reference Williamson and Govardhan2008; Asadzade & Shamloo Reference Asadzade and Shamloo2017). In applications that require net flow generation, such as fluid acceleration using piezoelectric fans or IPMCs, understanding the complex three-dimensional (3-D) geometry of induced jets and the underlying transient wake vortex structures is critical for their systematic design.
Many past studies focused primarily on the two-dimensional (2-D) thrust and drag signature of the wake and the forces on the solid object, with limited attention to the three-dimensionality of induced jets downstream. In their studies on the 2-D vortex patterns in the wake of a pitching airfoil in a non-zero free stream, Koochesfahani (Reference Koochesfahani1989) and Bohl & Koochesfahani (Reference Bohl and Koochesfahani2009) observed that changes in the patterns of vortex shedding from the airfoil’s trailing edge correlate with change from drag-producing to thrust-producing flows downstream. Complementary to these previous studies, Schnipper, Andersen & Bohr (Reference Schnipper, Andersen and Bohr2009) visualized different vortical patterns under wide ranges of vibration frequencies and amplitudes, and constructed a corresponding phase diagram.
Resonating flexible cantilever plates are often exploited in zero free streams to avoid the complications associated with the strong coupling between vibration dynamics and often-variable fluid flows. These structures, however, exhibit similar vortex patterns and flow characteristics to those of pitching airfoils. Heathcote, Martin & Gursul (Reference Heathcote, Martin and Gursul2004) examined flexible flapping plates in a quiescent fluid to analyse the effect of the beam amplitude and stiffness on thrust generation. Eastman, Kiefer & Kimber (Reference Eastman, Kiefer and Kimber2012) studied thrust force generation by vibrating cantilever plates and proposed a correlation between the thrust and the vibration amplitude and frequency. Shrestha, Ahsan & Aureli (Reference Shrestha, Ahsan and Aureli2018) studied the lateral vortex shedding in a pitching plate with a fixed geometry using particle image velocimetry (PIV) visualizations and proposed a 2-D vortex regime map to describe the observed patterns. These patterns were correlated with aerodynamic drag forces on the plate. Dewey et al. (Reference Dewey, Boschitsch, Moored, Stone and Smits2013) experimentally compared the thrust generation and power efficiency of flexible and rigid pitching plates.
Other studies focused on 2-D velocity profiles downstream of pitching plates. Kim, Wereley & Chun (Reference Kim, Wereley and Chun2004), Kim, Cierpka & Wereley (Reference Kim, Cierpka and Wereley2011) and Choi, Cierpka & Kim (Reference Choi, Cierpka and Kim2012) studied the mechanisms of vortex generation and propagation in the 2-D wake of a pitching plate in a quiescent fluid. They visualized induced flow fields that result from the interaction of the shed vortices. Ebrahimi, Zeng & Ju (Reference Ebrahimi, Zeng and Ju2018b) and Ebrahimi, Eldredge & Ju (Reference Ebrahimi, Eldredge and Ju2019) used PIV and 2-D numerical simulation to study the vortex evolution at the trailing edge of pitching cantilever plates along their midspan planes over wide ranges of frequencies, amplitudes and plate lengths. They observed three distinct vortex regimes in the wake as they increased the Reynolds number and demonstrated that these vortex regimes influence the flow generation ability of pitching plates. Stafford & Jeffers (Reference Stafford and Jeffers2017) used PIV to investigate 2-D flow fields and pressure contours in the downstream flows induced by a piezoelectric fan.
These past 2-D studies, however, did not provide a complete picture of the evolution of jet-like flows downstream of oscillating plates. Past 3-D studies demonstrated that the vortices shed from the trailing and lateral edges of a pitching plate form horseshoe structures in the wake that interact with each other as they propagate downstream with the flow. Buchholz and co-workers (Buchholz Reference Buchholz2006; Buchholz & Smits Reference Buchholz and Smits2005, Reference Buchholz and Smits2006, Reference Buchholz and Smits2008; Buchholz, Clark & Smits Reference Buchholz, Clark and Smits2008) observed that each horseshoe is significantly deformed under the influence of two subsequent horseshoes: an opposite-sign interaction with the horseshoe shed immediately after and a like-sign interaction with the horseshoe that follows with 2 $\unicode[STIX]{x03C0}$ phase difference. Green and co-workers (Green & Smits Reference Green and Smits2008; Green, Rowley & Smits Reference Green, Rowley and Smits2011; King & Green Reference King and Green2019) performed 3-D PIV combined with a Lagrangian coherent structure (LCS) analysis on trapezoidal pitching plates in a free stream and provided 3-D graphical representations of the vortex structures in the wake, confirming the aforementioned interactions. Taira & Colonius (Reference Taira and Colonius2009) used numerical simulations to investigate the transient structures shed from a pitching plate in a free stream starting from rest. By studying the 3-D horseshoe vortex structures emanating from a pitching plate in a quiescent fluid, Agarwal et al. (Reference Agarwal, Nolan, Stafford and Jeffers2017) showed that the complex interactions reported in the previous studies are highly influenced by free-stream flows and that they are largely absent in quiescent fluids. Oh et al. (Reference Oh, Park, Kim and Choi2018, Reference Oh, Seo, Kim and Choi2019) used moving-mesh 3-D numerical simulations to analyse the vortex structures and flow field in the wake of a pitching plate in a quiescent fluid confined by two endwalls. They demonstrated for the first time the unconventional 3-D shape of the mean jet downstream of a pitching plate.
Although these past studies provided useful pictures of transient 3-D vortex structures, detailed quantitative investigations of different factors affecting the shapes and other characteristics of downstream jets and their underlying mechanisms have been largely lacking. In the present work, we investigate the 3-D characteristics of the time-averaged induced jet in the wake of an unconfined pitching cantilever plate in a quiescent fluid and correlate these characteristics with transient vortex structures in the wake and their temporal evolution. We perform 2-D and 3-D PIV experiments together with 3-D immersed boundary numerical simulations to visualize and extract wake structures downstream of plates of different vibrational (frequency and amplitude) and geometric (width and length) parameters, and provide a guideline to predict the shape of the jet.
The rest of the paper is organized as follows. In § 2 we describe the parameters and experimental set-up used in the present study. Section 3 provides a description of the geometry and other details of our numerical simulation. Section 4 contains the results and discussions regarding the fluid jet and wake vortex structures observed in the experiments and numerical studies. A summary and conclusions are presented in § 5.
2 Experiment parameters and set-up
The vibration characteristics of a plate are described by its frequency,  $f$, and amplitude,
 $A$. We limit ourselves to small-amplitude vibrations and represent oscillation of the trailing-edge position
 $y$ as
 $$\begin{eqnarray}y=A\cos (2\unicode[STIX]{x03C0}ft),\end{eqnarray}$$
where  $\unicode[STIX]{x1D719}=2\unicode[STIX]{x03C0}ft$ is the phase of the oscillations. The characteristic trailing edge (or ‘tip’) velocity in this study is defined as
 $u_{tip}=fA$. The main length scale relevant to the 3-D vortex shedding from the trailing edge is the width of the plate,
 $w$. The thickness of the plate,
 $t$, only has secondary effects on the vortex generation at the trailing edge. As we shall discuss later in § 4, the length of the plate,
 $l$, also has relatively small influence on the characteristics of downstream jet flows for the plates considered in the present study. The aspect ratio of the plate is defined as
 $AR=w/l$. The normalized amplitude,
 $\unicode[STIX]{x1D6FC}$, which represents the aspect ratio of the oscillation envelope (equivalent to Keulegan–Carpenter number in similar studies (Bidakhvidi et al. Reference Bidakhvidi, Shirzadeh, Steenackers and Vanlanduit2013)), is defined as
 $$\begin{eqnarray}\unicode[STIX]{x1D6FC}=\frac{A}{w}\end{eqnarray}$$
and the oscillatory Reynolds number,  $Re$, is defined as
 $$\begin{eqnarray}Re=\frac{U_{tip}w}{\unicode[STIX]{x1D708}}=\frac{fAw}{\unicode[STIX]{x1D708}}.\end{eqnarray}$$
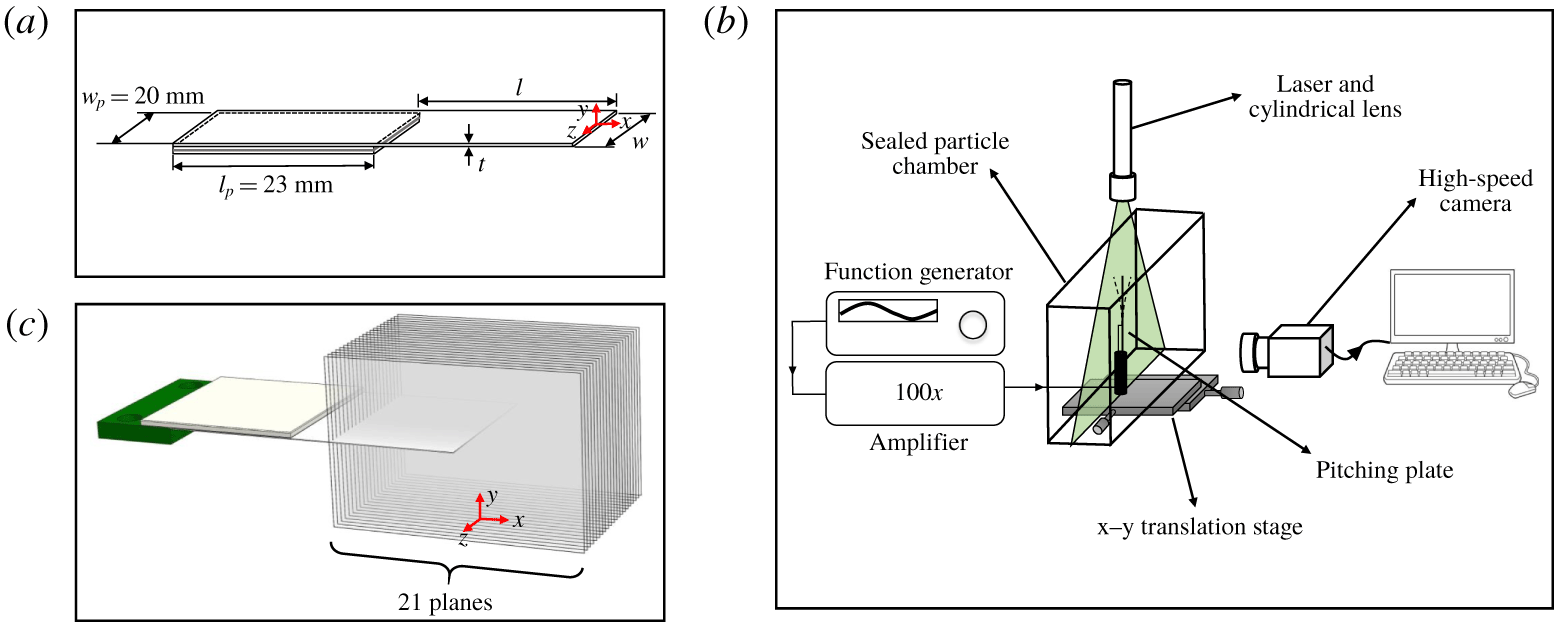
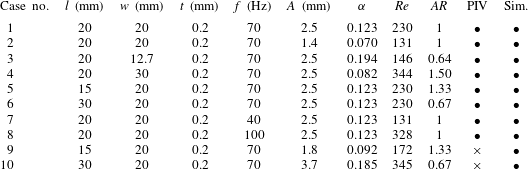
We use a commercial piezoelectric actuator (SMPF61W20F50, Steminc Inc.) to oscillate cantilevers about their resonance frequencies. The actuator is 20 mm wide and 23 mm long (figure 1a). Thin plates made of Mylar with different dimensions are prepared in-house and attached to the actuator using cyanoacrylate glue. Table 1 lists the geometric parameters of the plates (width  $w$, length
 $l$, and thickness
 $t$) along with their vibrational characteristics (frequency
 $f$, and amplitude
 $A$) used in the present study. Different resonance frequencies for the same cantilever (cases 7 and 8 in table 1) are obtained by changing the plate’s mass distribution using a method reported in a previous study (Ebrahimi et al. Reference Ebrahimi, Wang and Ju2018).
(a) Schematic of the piezoelectric actuator and the oscillating plate. (b) Schematic of the PIV experiment set-up. (c) Visualization planes for the 3-D PIV data extraction used in the present study.

Small-amplitude sinusoidal voltage waves from a function generator (model 33220A, Agilent) are amplified using a high-voltage amplifier (model PZD700A, TREK) before being fed to the actuator (figure 1b). The desired vibration amplitudes were obtained by tuning the input voltage and measured optically with an uncertainty of  $\pm 0.1~\text{mm}$, less than 10 % of the minimum amplitude used in this study.
The 1 mm thick illumination sheet for our PIV experiments (figure 1b) was generated using a 500 mW continuous-wave laser (Hercules, LASERGLOW Technologies) with a wavelength of 532 nm. Successive frames were recorded using a high-speed camera (Phantom VEO-640L) capable of acquiring 16 bit, 4 Mpixel images. The frame rate in each experiment was set to capture at least 70 frames per full period of plate oscillation, equivalent to frame rates  ${>}$6300 frames per second (f.p.s.). A shutter speed of
 $80~\unicode[STIX]{x03BC}\text{s}$ was found to be adequate to reduce the effects of motion blur.
Geometric and vibrational characteristics of the plates used in the present study and the corresponding dimensionless parameters. The two last columns indicate whether PIV or numerical simulation results are available for each case ( $\bullet$, yes;
 $\times$, no). The vibration amplitude
 $A$ is varied among cases 1 and 2 for otherwise identical plates; the plate width
 $w$ is varied for cases 1, 3 and 4; the plate length
 $l$ is varied for cases 1, 5 and 6; and the vibration frequency
 $f$ is varied for cases 1, 7 and 8.

The PIV experiments were conducted in a large sealed transparent chamber made of acrylic plates  $(30~\text{cm}\times 20~\text{cm}\times 8~\text{cm})$ to reduce interference from the sidewalls (see Eastman & Kimber Reference Eastman and Kimber2014). Seeding particles were generated by evaporating a solution of water and glycerine (30 % glycerine by volume). The particles were then allowed to settle for approximately one minute before conducting any experiment to minimize initial disturbance from particle injection or previous experiments. Secondary flows due to the buoyant motion of the particles are estimated to be approximately
 $0.015~\text{m}~\text{s}^{-1}$ in the streamwise
 $(+x)$ direction. The chamber was mounted on a linear translation stage with a resolution of 0.01 mm in order to move the plate relative to the illumination sheet (figure 1b).
An open-source MATLAB software package, PIVlab (Thielicke & Stamhuis Reference Thielicke and Stamhuis2014), is used to analyse the captured video images. Windows (64 pixel  $\times$ 64 pixel) with 50 % overlap are cross-correlated in two successive frames using the advanced discrete Fourier transform technique embedded in the package to obtain the direction and magnitude of the particles’ displacements in the sub-areas. The calculated velocity fields are next post-processed by manually filtering the outlier data in areas where improper lighting condition leads to inaccurate displacement vectors and replacing them with interpolated equivalents. An algorithm based on the penalized least-squares method (see Garcia Reference Garcia2010) is employed to smooth the flow fields.
The PIV set-up and image processing procedure are validated using several benchmarks discussed in Thielicke (Reference Thielicke2014). In general, bias error from window deformation and random errors from the cross-correlation algorithms are the main sources of uncertainty in the image processing steps. However, for 3-D flows, the out-of-plane velocities are generally a larger source of error. These out-of-plane flows cause seeding particles to leave the illumination sheet in between successive images, leading to random error. Assuming a very conservative estimate for the out-of-plane velocity of  $1~\text{m}~\text{s}^{-1}$ (of the same order as the maximum expected streamwise velocities) and a minimum frame rate of 6300 f.p.s., particles are projected to travel at most 0.16 mm or 16 % of the illumination sheet thickness between successive frames. This is considered an acceptable error, as other works in the literature have reported out-of-plane displacements of almost 50 % of the light sheet thickness (see Green et al. Reference Green, Rowley and Smits2011). An overall uncertainty of 0.14 pixel is estimated for the displacement vectors obtained in our PIV experiments. Considering other uncertainties, such as pixel to distance conversion and camera frame-rate accuracy, we estimate a total uncertainty in velocity measurements of
 $0.016~\text{m}~\text{s}^{-1}$.
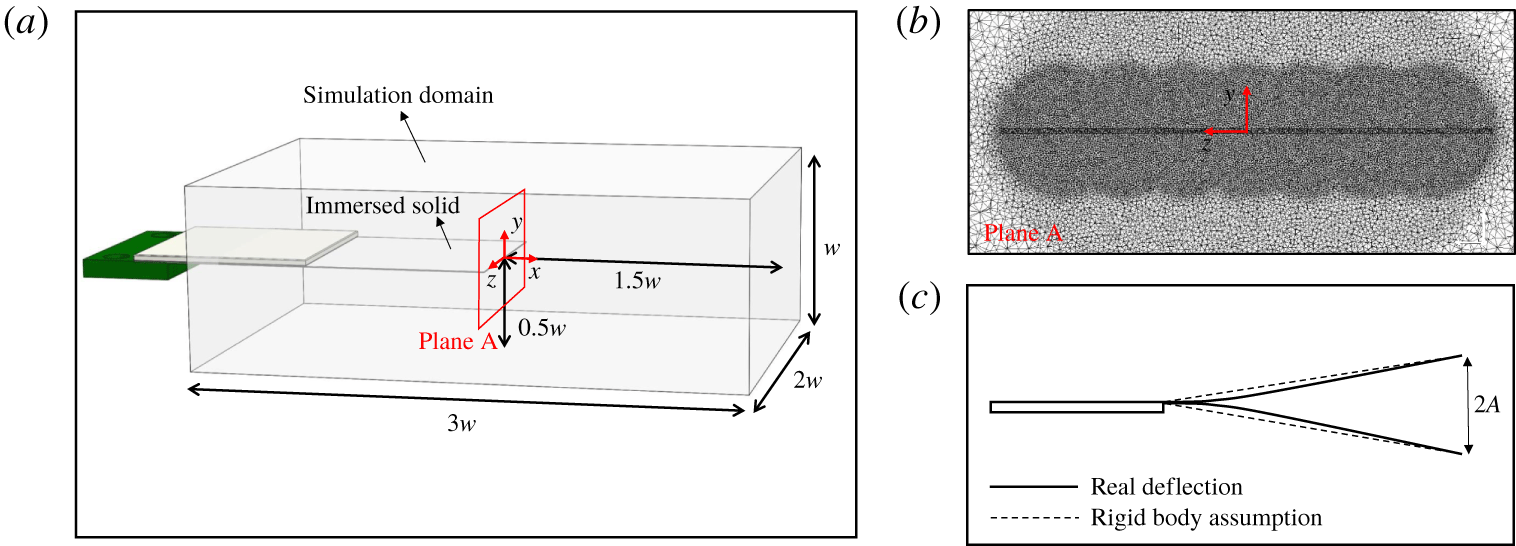
(a) Numerical simulation domain. (b) Mesh used in the present numerical simulations. (c) Comparison between the actual plate deflection and the rigid-body approximation (images are not to scale).

To construct 3-D vortex structures from the results of our PIV experiments, we first extract 2-D PIV data from 21 planes uniformly spaced 1 mm apart along the span of the plate (normal to the  $z$ axis, figure 1c). The identified vortex cores in each plane are then interpolated to form 3-D vortex structures. A similar technique was reported in the works by Green et al. (Reference Green, Rowley and Smits2011) and King & Green (Reference King and Green2019). Further discussion of this technique is provided in § 4.
3 Numerical simulations
Three-dimensional numerical simulations are performed using a commercial computational fluid dynamics package (ANSYS CFX). We use the immersed boundary method to circumvent computational overheads associated with remeshing and distorted nodes in moving-mesh methods. The dimensions of the simulation domain are  $3w\times 2w\times w$ (figure 2a), large enough to capture the desired properties of the wake while avoiding complicating effects at the boundaries. This was verified using PIV visualization and a domain-size independence study. The open boundary condition is specified on the outer walls of the computational domain to allow free fluid motion in directions normal to the domain boundaries. The relative pressure on these boundaries is specified as zero.
We use tetrahedral meshes of spatially varying sizes along the trailing edge:  $0.005w$ in seven spheres of radius
 $0.125w$ centred along the trailing edge,
 $0.01w$ in three intermediate spheres of radius
 $0.25w$, and
 $0.025w$ in the rest of the domain (figure 2b). To confirm the mesh independence of our numerical simulation results, a representative case is run with different grid sizes. The predicted time-averaged velocity (from cycle 11 to 20) on the midspan line
 $(x/A=0.8)$ changed by less than 5 % for mesh sizes that were half the chosen set of values.
The cantilever plate is approximated as an immersed solid prescribed to rotate rigidly about a pivot point at its base. This approximation is justified by the predominance of the lowest-order vibration mode. Figure 2(c) compares an actual plate deflection obtained from one of our experiments with that from the rigid-body approximation at an exaggerated amplitude. The slope at the trailing edge estimated from the rigid-body assumption differs by less than 1 % from the slope obtained experimentally. Based on Lighthill’s theory of elongated bodies (Lighthill Reference Lighthill1971), it is the motion of the trailing edge and its vicinity that primarily determine the wake properties and thrust/drag signature and not intermediate motions along the plate. This approximation was also shown to successfully predict the characteristics of a 2-D jet from a cantilevered plate (Ebrahimi et al. Reference Ebrahimi, Eldredge and Ju2019).
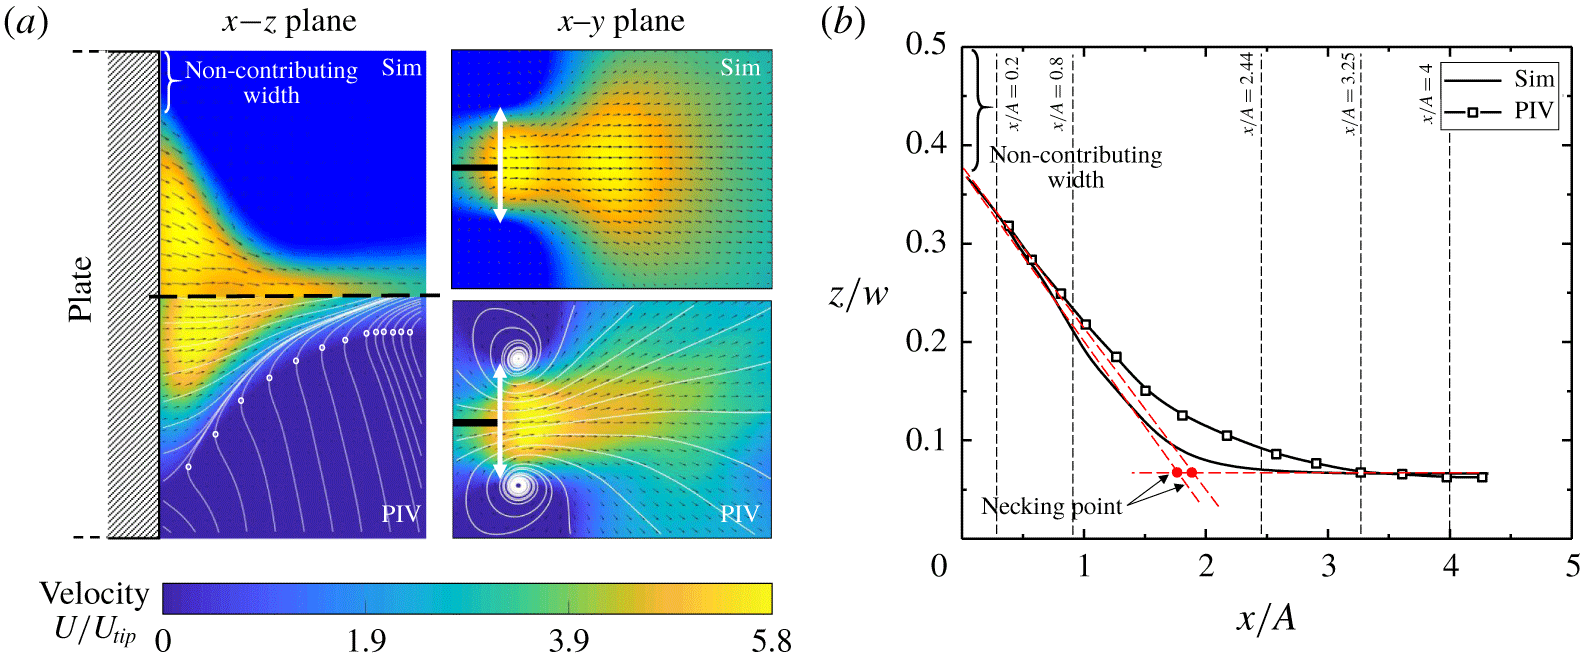
(a) Time-averaged velocity profile of a pitching cantilever plate in the  $x$–
 $z$ and
 $x$–
 $y$ planes (case 1). The thin white lines in the PIV results indicate the streamlines and the thick white arrows indicate the tip-to-tip displacement of the trailing edge
 $(=2A)$. (b) Time-averaged jet boundary projected on the
 $x$–
 $z$ plane.

The first-order upwind scheme is used for the advection terms and the first-order backward Euler scheme is used for time marching. The time step in the computations is automatically adjusted such that the Courant number remains lower than one in all computational cells. Using the second-order upwind scheme did not result in appreciable change in the predicted jet boundary. This is expected because for the low-Reynolds-number flows of this study, numerical damping is negligible when compared with viscous damping in the problem.
4 Results
4.1 General characteristics of 3-D jet
Figure 3(a) shows a typical time-averaged velocity profile of a pitching cantilever plate over 10 cycles of oscillations (cycles 11 to 20) obtained from numerical simulations (upper half) and PIV experiments (lower half) for case 1 (table 1). The first 10 cycles are not considered to allow time for the initial transients to settle and reach a steady periodic state. We define the jet boundary by identifying and interpolating the loci of flow entrainments (white circles along the streamlines on the  $x$–
 $z$ plane, lower left in figure 3a) where the direction of the time-averaged velocity changes from
 $+x$ to
 $-x$. The negative value of the average streamwise velocity outside the jet boundary is rather unique to jets produced by pitching plates and is not usually observed in other 2-D and 3-D jets. Our definition of the jet boundary, therefore, differs from that in typical studies of jets, where the jet boundary is defined by a threshold value of streamwise velocity, e.g. 1 % of the momentum-averaged velocity.
(a) Time-averaged streamwise velocity along the midspan line,  $y=0$ and
 $z=0$ (case 1). (b) The spanwise profile for the time-averaged streamwise velocity at five locations along the
 $x$ direction shown in figure 3(b).

Figure 3 suggests that the induced mean jet forms two distinct regions downstream. Close to the trailing edge, the mean jet boundary in the  $x$–
 $z$ plane shrinks linearly in the spanwise direction towards the midspan line as the flow proceeds in the
 $+x$ direction. In contrast, the jet boundary is almost independent of
 $x$ in the
 $x$–
 $y$ plane. The magnitude of the average velocity in this region is nearly constant, with small fluctuations around the average value,
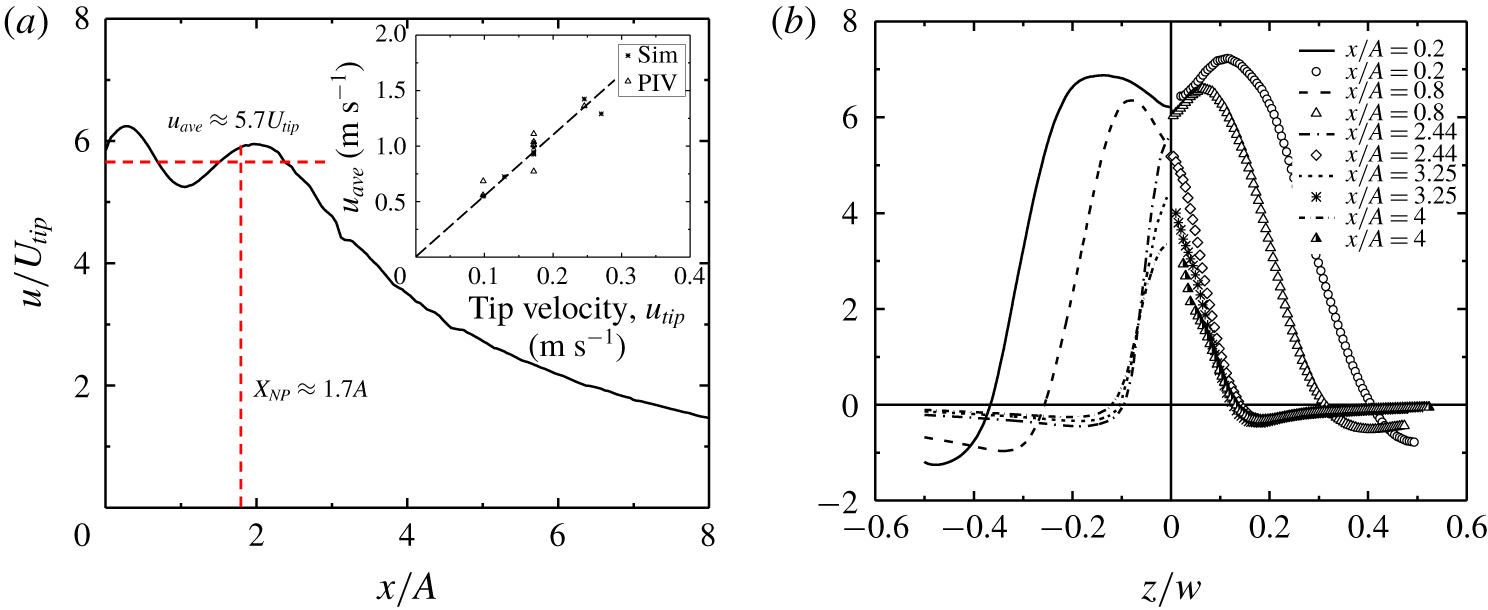
 $u_{ave}$ (figure 4a). The magnitude of this velocity is approximately a linear function of the tip velocity, with a slope of
 ${\sim}5.6$, as shown in the inset of figure 4(a). Further downstream, at approximately
 $x/A\sim 1.7$, the jet boundary stops shrinking in the
 $x$–
 $z$ plane and forms two parallel lines. This coincides with an abrupt expansion of the jet boundary on the
 $x$–
 $y$ plane, accompanied by a significant change in the direction of the velocity vectors. We refer hereafter to the borderline between the two regions as the ‘necking point’, defined approximately by the intersection of two tangent lines to the jet profile as shown in figure 3(b). The streamwise location of the necking point is referred to as the ‘necking length’ and serves as a quantitative measure of the streamwise extent of the jet.
The streamlines form two spiral curves on the top and bottom of the oscillation envelope on the  $x$–
 $y$ plane of figure 3(a). This indicates a spanwise transport of flow toward the midspan. These two spiral streamlines confine the flow to a high-velocity region between them and form the boundary of the jet in the
 $x$–
 $y$ plane upstream of the necking point. As we shall show later, these spirals and the associated change in direction of the flow are related to the transient tilting of vortex structures shed from the trailing edge. Downstream of the necking point, the streamwise velocity component decreases significantly (figure 4a) due to the mixing facilitated by interactions of the vortices.
We also note from figure 3 (on the  $x$–
 $z$ plane) that not all portions of the width of the plate contribute to the flow generation at the trailing edge. The two outboard portions, referred to as the non-contributing width hereafter, are located at the sharp corners of the thin plate and experience a weakly negative streamwise velocity. In this study, we quantify the non-contributing width only based on the numerical results, because the velocity field close to the trailing edge in the PIV results is affected by the motion of the plate itself and by the reflection of light from the surface. This is evident from the lower velocities of the PIV data in a narrow band (
 ${\sim}32$ pixels or overlapped portion of the cross-correlated windows) adjacent to the trailing edge in figure 3(a).
Three-dimensional vortex structures obtained from the experimental and numerical simulation results during one full cycle of oscillation (case 1).

Figure 4(b) shows the normalized streamwise average velocity profiles on the  $x$–
 $z$ plane
 $(y=0)$ at five different
 $x$ locations. The jet boundary in this figure exists at the locations where the velocity profiles change sign. We observe that the velocity profiles before the necking point (
 $x/A=0.2$ and 0.8) exhibit two peaks on either side of the midspan line. In contrast, the velocity profiles after the necking point
 $(x/A=2.44,3.25,4)$ have only single peaks along the midspan line. These profiles after the necking point exhibit approximately the same shape outboard of
 $z/w\sim \pm 0.05$, consistent with two nearly parallel lines defining the jet boundary after the necking point.
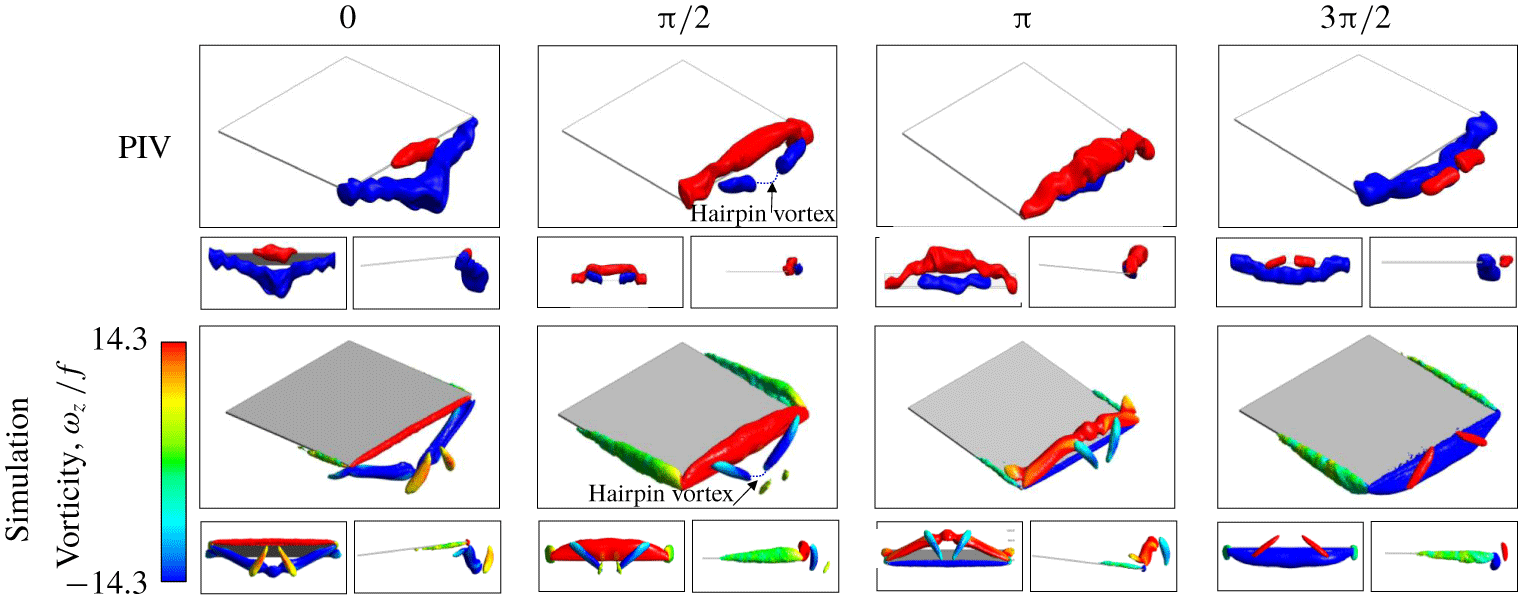
The physics underlying the counter-intuitive geometry of the jet can be understood by considering the transient 3-D wake vortex structures shed from the trailing edge and side edges of the plate. Figure 5 shows such structures in a full cycle of oscillation as obtained from our PIV experiments and numerical simulations. The vortex cores are identified using the second invariant of the velocity gradient tensor  $\unicode[STIX]{x1D735}U$, known as the
 $Q$-criterion (Jeong & Hussain Reference Jeong and Hussain1995). For consistency, the threshold for the
 $Q$-criterion was set at a fixed value equal to approximately 10 % of the maximum
 $Q$ values at phase
 $\unicode[STIX]{x1D719}=0$. The colour of the vortex structures in the numerical simulations represents the magnitude of the vorticity in the
 $z$ direction,
 $\unicode[STIX]{x1D714}_{z}$, while in the PIV results it only indicates the vortex rotation sign (clockwise or anticlockwise). We note that, because our PIV results do not resolve the spanwise velocity component, vortices along the side edges are not captured in these representations.
Figure 5 shows that the vortex formation starts slightly earlier than  $\unicode[STIX]{x1D719}=0$ with anticlockwise vortices forming in the spanwise direction along the width of the plate. This was also confirmed in the 2-D studies of Kim et al. (Reference Kim, Wereley and Chun2004) and Ebrahimi et al. (Reference Ebrahimi, Eldredge and Ju2019). This spanwise structure is accompanied by two streamwise vortices at the cantilever side edges, which together form a horseshoe structure. The oscillation velocity of the pitching plate linearly increases with the chordwise distance from the leading edge. Therefore, the vortex strength of the legs of the horseshoe increases in the chordwise direction. At the same instant, the previously generated clockwise vortex still exists as a coherent structure. This structure is attached to the cantilever plate at the sharp corners and increasingly separated from the plate towards the midspan. As the cantilever plate continues its downstroke half-cycle towards the neutral position
 $(\unicode[STIX]{x1D719}=\unicode[STIX]{x03C0}/2)$, the anticlockwise vortex structure grows and separates from the trailing edge in the midspan while still being attached to the corners. In addition, the clockwise vortex structure from the previous cycle breaks down from the midspan and the corners, forming two coherent substructures.
We emphasize that the vorticity does not actually disappear at the midspan and corners, but spreads and splits, forming a hairpin vortex that connects the two substructures. This hairpin vortex structure, however, is not shown, as its strength is below the threshold  $Q$ value. The two vortex substructures are wrapped around the new spanwise vortex as they are convected downstream. This wrapping effect adds a
 $y$-direction component to the vorticity of the substructures, inducing a significant flow towards the midspan and a corresponding outward flow in the
 $y$ direction. This behaviour leads to the abrupt expansion of the jet boundary on the
 $x$–
 $y$ plane (figure 3a) discussed earlier. At
 $\unicode[STIX]{x1D719}=\unicode[STIX]{x03C0}$, the clockwise vortex substructures travel further downstream while losing their core strength due to diffusion. Owing to the low strength of these vortex substructures, our PIV visualizations were not able to capture them beyond this point. At the same time, the anticlockwise spanwise structure (shown in red) has undergone the same process and is ready to break. At
 $\unicode[STIX]{x1D719}=3\unicode[STIX]{x03C0}/2$, the anticlockwise vortex structure breaks and the consequent substructures wrap around the new vortex in opposite directions, similar to
 $\unicode[STIX]{x1D719}=\unicode[STIX]{x03C0}/2$.
The vortex breakdown and tilting in the wake of pitching plates was also reported by Green et al. (Reference Green, Rowley and Smits2011). However, due to the higher strength of their vortices, vortex breakdown was delayed until after two-and-a-half cycles (as opposed to less than a cycle in the current study). Furthermore, the presence of a free stream in their experiments augmented vortex transport such that the vortex breakdown and the subsequent jet boundary shrinkage only occurred at the end of their domain where the flow characteristics were not of significant importance.
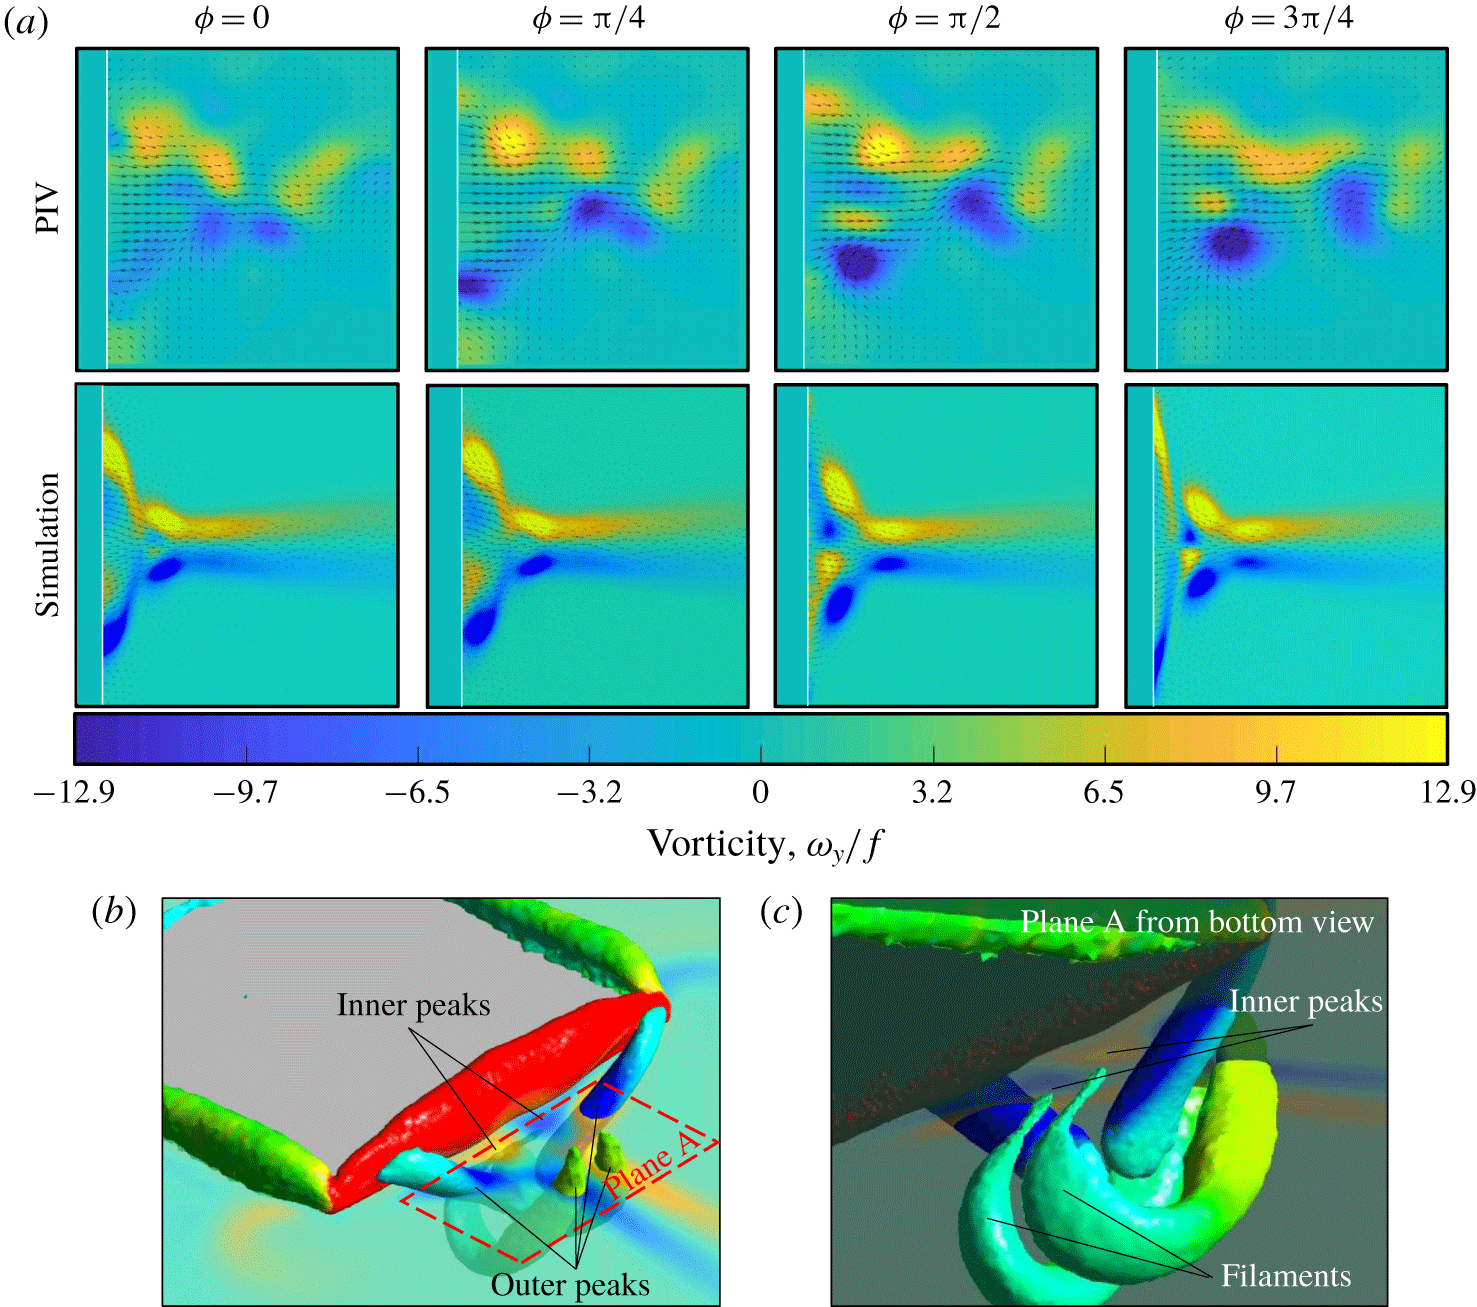
Figure 6 illustrates the temporal evolution of the  $y$ component of vorticity on the
 $x$–
 $z$ plane in a half pitching cycle. The frequency of vortex shedding on the
 $x$–
 $z$ plane is twice the original frequency. That is, the opposite-sign spanwise vortices have similar sign projections on the
 $x$–
 $z$ plane. Therefore, only a half-period of oscillation,
 $1/f$, is shown in this figure. The projections of the vortex substructures described above are shown as high-vorticity regions on this plane. These high-vorticity regions are concentrated along the jet boundary and are the primary reasons for the spanwise shrinking of the jet shape. We note that, unlike our numerical simulations, the instantaneous PIV results are highly asymmetric about the midspan line. We believe that the reason for this asymmetry is the strong sensitivity of the flow to the disturbances. Non-uniform deflections of the trailing edge due to plate imperfections (such as uneven mass distribution of the pitching plate due to manufacturing or assembly flaws) and secondary flows in the visualization chamber are examples of factors contributing to these disturbances. However, these disturbances do not significantly influence the time-averaged behaviour of the flow, as shown previously in figure 3.
(a) The temporal evolution of the  $y$-component vorticity on the
 $x$–
 $z$ plane over a half pitching cycle for case 1. (b,c) The source of the inner vorticity peaks clarified at
 $\unicode[STIX]{x1D719}=\unicode[STIX]{x03C0}/2$. The inner vorticity peaks have lower strength compared with the outer peaks. For example, at
 $\unicode[STIX]{x1D719}=\unicode[STIX]{x03C0}/2$, the vortex core circulation in the two outer peaks close to the trailing edge is
 $13.5Af^{2}$ and
 $11.6Af^{2}$ for PIV and simulation results, respectively. For the inner vorticity peaks, these values are
 $1.5Af^{2}$ and
 $1.4Af^{2}$ for the PIV and simulation results, respectively.

In figure 6, we also observe the presence of inner peaks in the vorticity contours. These inner peaks are projections of the vortex filaments stemming from the vortex shed one cycle before. These filaments are not shown in figure 5 due to their low strength. Figure 6(b,c) clarifies the origin of the inner vorticity peaks. Although these vorticity peaks do not affect the jet boundary, we can attribute the dual peak behaviour close to the trailing edge (corresponding to the profiles before the necking point in figure 4b) to the interactions between these vortices and the outer vortices. Vortices of opposite signs (each pair of inner and outer vortices on the same side of the midspan line) create a high-velocity region that forms the dual peak profiles of figure 4(b). The inner vorticity peaks, and hence the dual peak profiles, dissipate after the necking point.
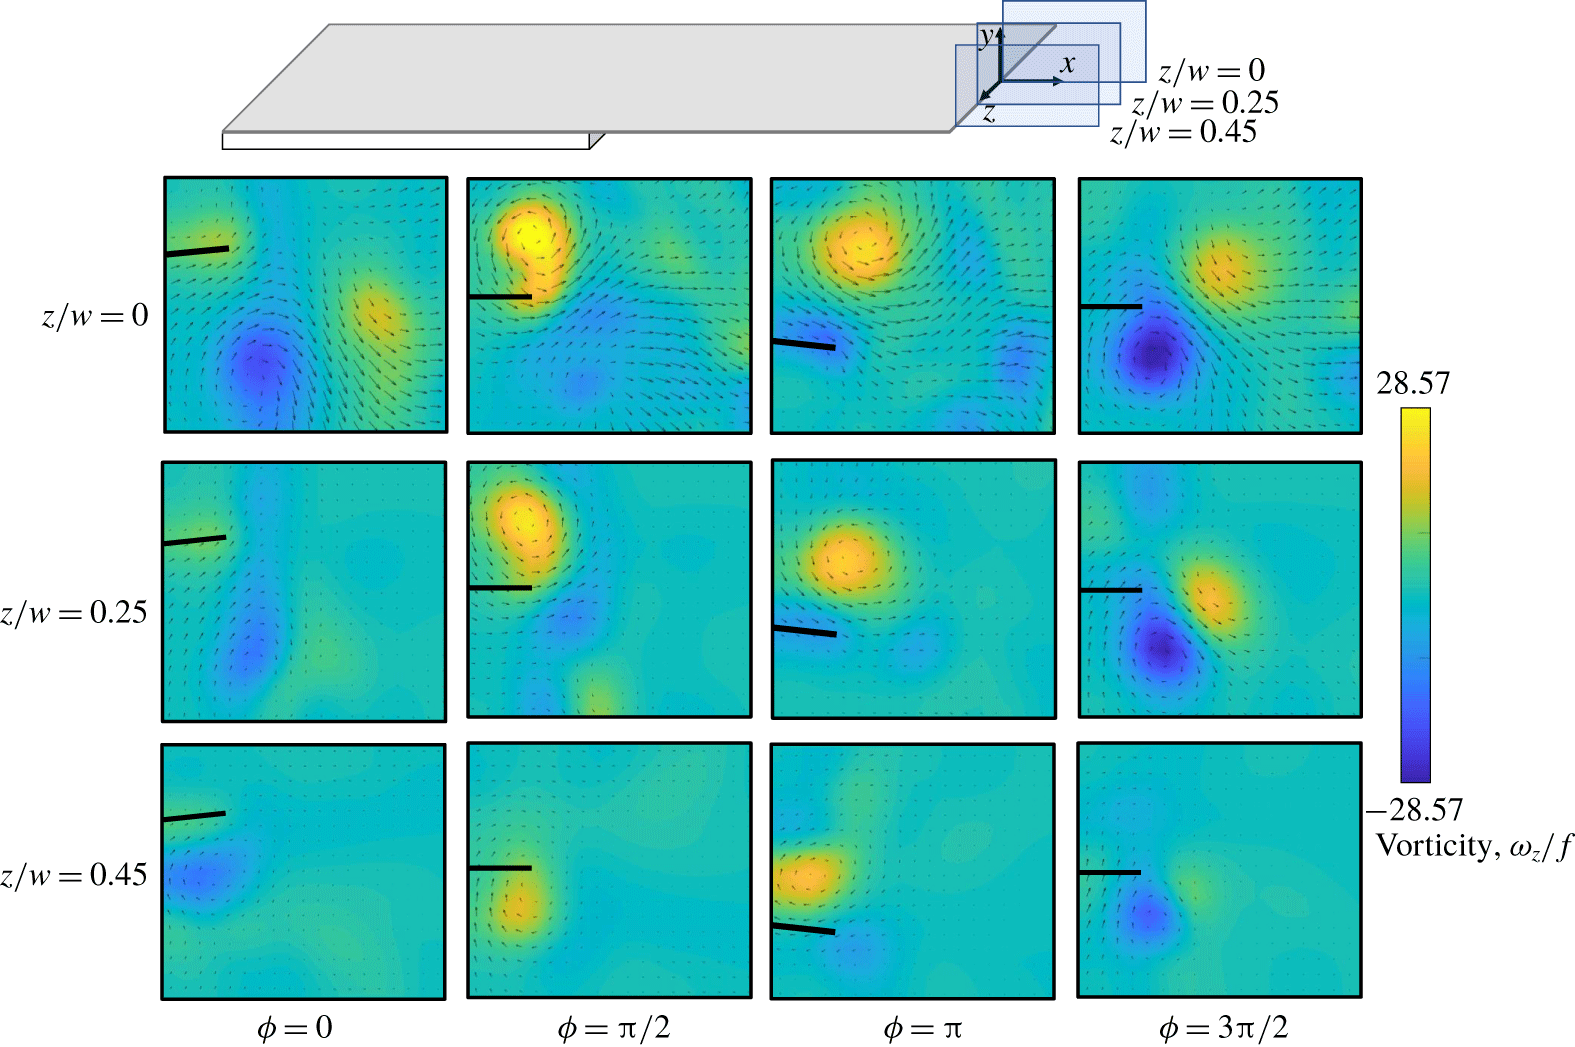
To further elucidate the three-dimensionality of vortex shedding from the trailing edge and clarify the presence of a non-contributing width, we compare the instantaneous spanwise vorticity contours in 2-D PIV results along the span of the plate. Figure 7 demonstrates these contours and velocity vectors in a full cycle of oscillation on three different planes at the indicated spanwise locations. Near the midspan  $(z/w=0)$, the vortices have higher strength and are further separated from the trailing edge. These vortices exhibit features resembling the propagating vortices observed in a previous work (Ebrahimi et al. Reference Ebrahimi, Eldredge and Ju2019). Towards the corners of the thin plate, the vortex remains attached to the trailing edge, characteristic of the non-propagating regime reported by Ebrahimi et al. (Reference Ebrahimi, Eldredge and Ju2019). An appreciable decrease in the strength of the spanwise vortex component and the velocity magnitude is also evident. Green et al. (Reference Green, Rowley and Smits2011) observed an analogous change from 2S thrust-producing vortex alignment near the midspan to 2S drag-producing alignment close to the corners for their trapezoidal pitching plates in moving water. The existence of non-contributing portions close to the spanwise extremes of the pitching plate may be attributed to the presence of such non-propagating vortices at the plate corners.
We note that the asymmetry in the vortex position relative to the plate at  $z/w=0.25$ and
 $z/w=0.45$ is mirrored in the next half-cycle, which leads to tilting in the induced flow in the
 $\pm y$ direction over each half-cycle. This effect, however, cancels out when averaged over a full cycle. Therefore, we believe that this up–down asymmetric behaviour is different from the symmetry-breaking phenomenon (also known as the bifurcating flows) observed in previous studies (see Godoy-Diana et al. Reference Godoy-Diana, Marais, Aider and Wesfreid2009; Cleaver, Wang & Gursul Reference Cleaver, Wang and Gursul2012; Shinde & Arakeri Reference Shinde and Arakeri2014). In these symmetry-breaking flows, the vortex pair in the reverse von Kármán street is skewed towards one side of the plate’s neutral axis and propagates in the same direction. Therefore, the time-averaged velocity forms a finite angle with respect to the midspan line. This feature is absent in our PIV results.
Spanwise vorticity contours at three different spanwise locations (case 1).

4.2 Governing factors of the shape of the jet
In the following subsections, we investigate the effect of several vibrational and geometric factors on the 3-D shape of the jet and the vortex behaviour at the trailing edge.
4.2.1 Effects of normalized amplitude,  $\unicode[STIX]{x1D6FC}$

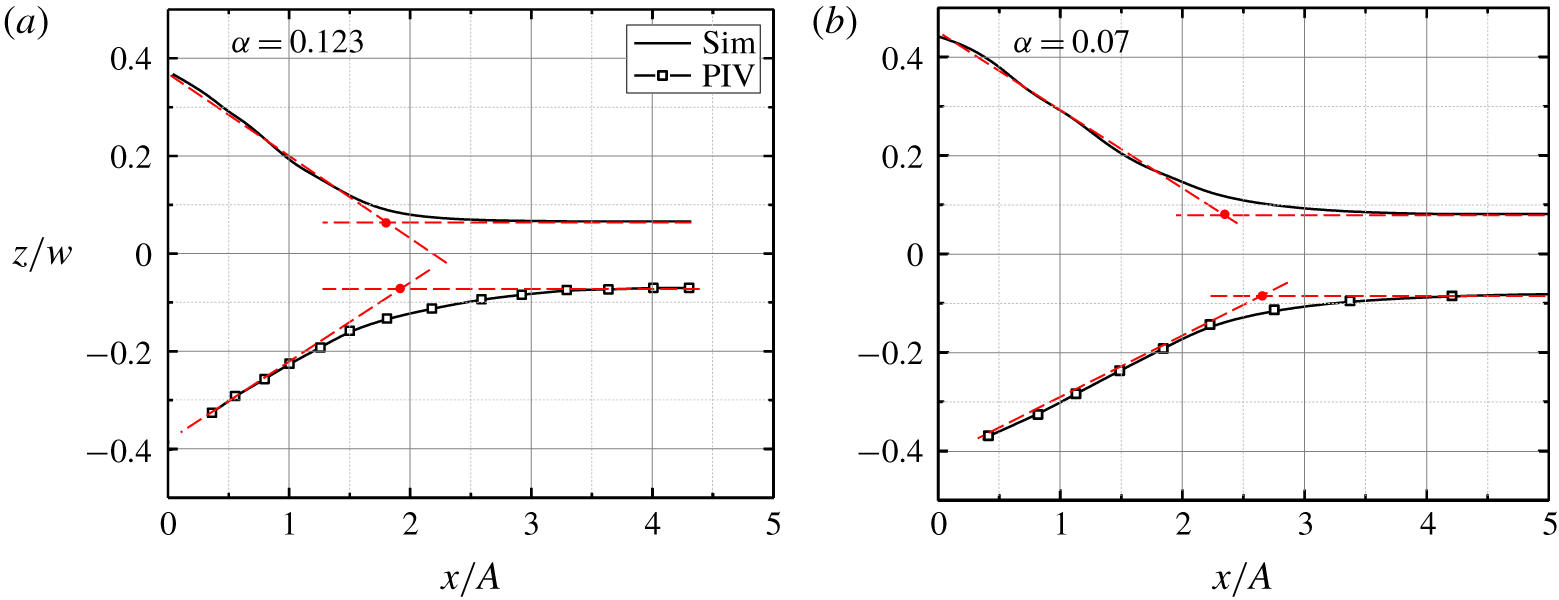
The two cases illustrated in figure 8, corresponding to cases 1 and 2 in table 1, differ only in their vibration amplitudes. The extent of the jet boundary in the streamwise direction, as quantified by the normalized necking length,  $x_{NP}/A$, in figure 8, is dependent on
 $\unicode[STIX]{x1D6FC}$. The normalized necking length decreases from 2.3 for the smaller
 $\unicode[STIX]{x1D6FC}$ to 1.7 for the larger
 $\unicode[STIX]{x1D6FC}$, representing 26 % decrease for 75 % increase in the normalized amplitude. The graphs also suggest a dependence of the normalized non-contributing width,
 $w^{\ast }/w$, on
 $\unicode[STIX]{x1D6FC}$. A more detailed discussion of the amplitude dependence of the necking length and the non-contributing width is presented in § 4.2.4.
Effect of  $\unicode[STIX]{x1D6FC}$ on the jet boundary projected on the
 $x$–
 $z$ plane for plates with different amplitudes corresponding to (a) case 1
 $(A=2.5~\text{mm})$ and (b) case 2
 $(A=1.4~\text{mm})$.

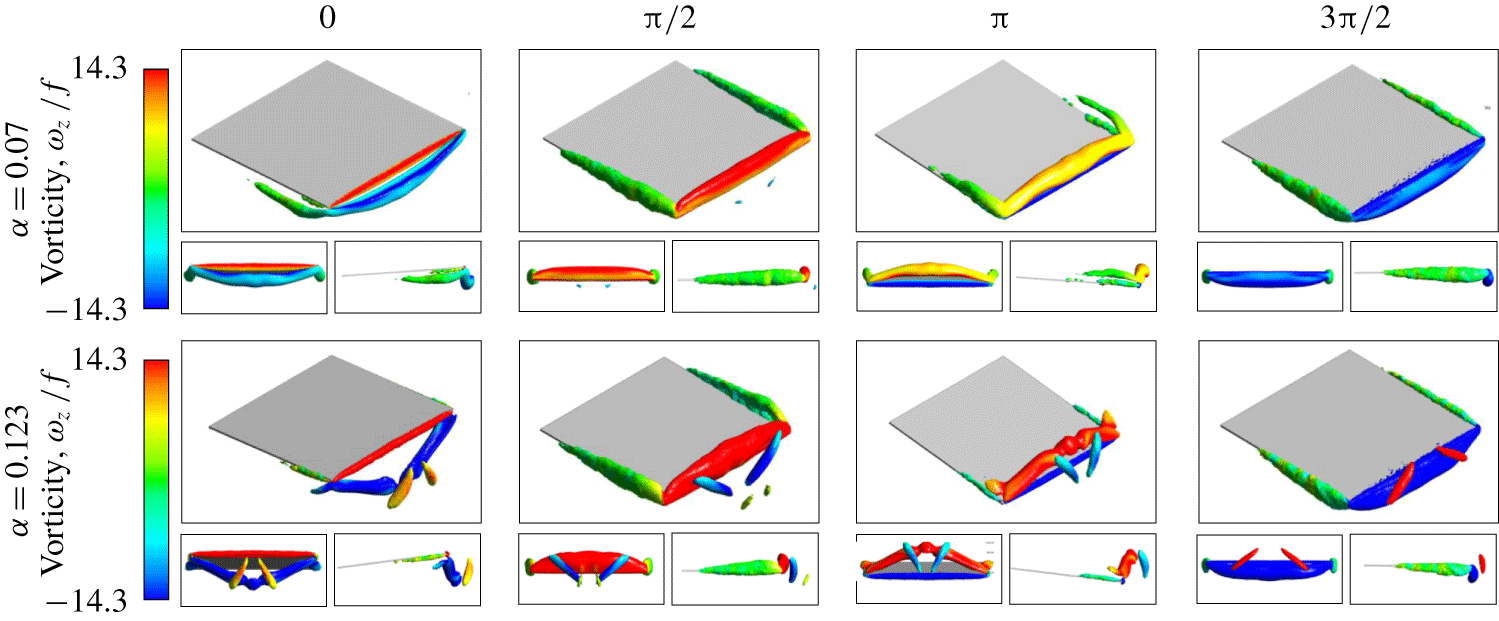
Three-dimensional vortex structures obtained from numerical simulation over one full cycle of oscillation at different values of  $\unicode[STIX]{x1D6FC}$ for plates vibrating at different amplitudes (
 $A=1.4$ and 2.5 mm, corresponding to cases 2 and 1) in the respective rows.

Figure 9 shows the vortex core structures emanating from the trailing and side edges of the plate for the two cases presented in figure 8. In these cases, the maximum and minimum height of the vortex structures at the midspan approximately coincide with  $y=\pm A$. Furthermore, the vortex structures in both cases arch over the width of the plate and connect to the sharp corners regardless of the amplitude. As a result, the curvature (bending) of the vortex structure is more pronounced at the larger values of
 $\unicode[STIX]{x1D6FC}$.
In addition, the strength of the vortex structures increases with  $\unicode[STIX]{x1D6FC}$, as indicated by the colour of the structures, enabling them to travel further downstream before diffusing due to viscosity. The combination of these two effects, i.e. the increased curvature of the structures and the higher vortex strength, causes the flow to stretch more in both the
 $x$ and
 $y$ directions at higher normalized amplitudes.
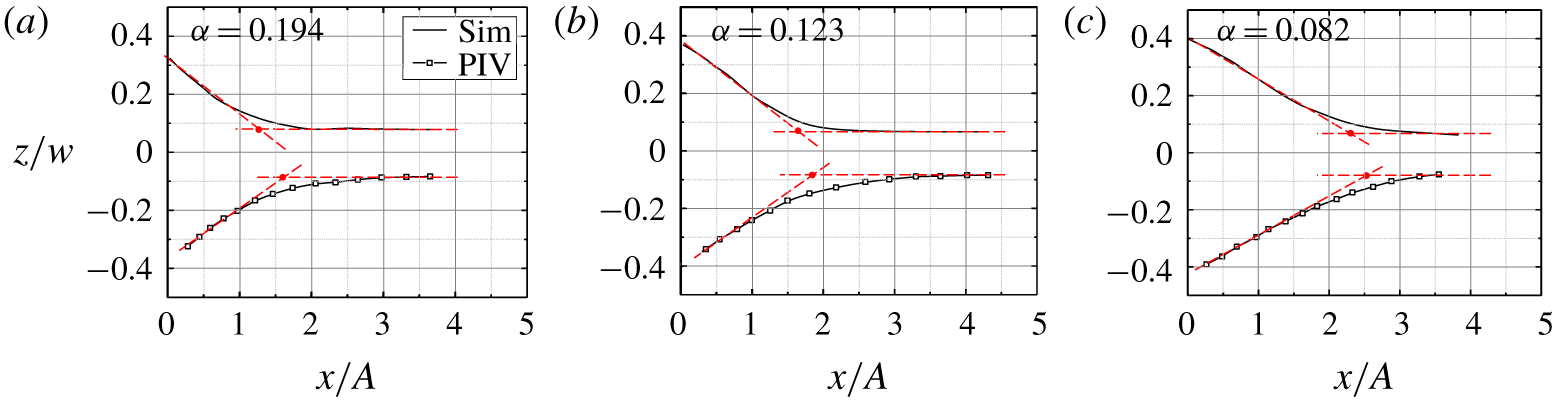
Figure 10 shows the jet boundary for the plates that differ only in their widths. The spanwise extent of the mean jet increases with the width of the plate, with an exception of areas close to the trailing edge, where the effect of the non-contributing width of the plate is more pronounced. Once again, we observe that  $w^{\ast }/w$ exhibits a strong dependence on
 $\unicode[STIX]{x1D6FC}$, increasing by approximately 80 % when
 $\unicode[STIX]{x1D6FC}$ is increased by 130 % from 0.082 to 0.194. Figure 10 also confirms our previous observation that decreasing
 $\unicode[STIX]{x1D6FC}$ elongates the streamwise extent of the mean jet, as indicated by the location of the necking point. The
 $x_{NP}/A$ value for the smallest
 $\unicode[STIX]{x1D6FC}$ is
 ${\sim}76\,\%$ larger than that for the largest
 $\unicode[STIX]{x1D6FC}$.
Effect of  $\unicode[STIX]{x1D6FC}$ on the jet boundary projected on the
 $x$–
 $z$ plane for plates with different widths corresponding to (a) case 3
 $(w=12.7~\text{mm})$, (b) case 1
 $(w=20~\text{mm})$ and (c) case 4
 $(w=30~\text{mm})$.

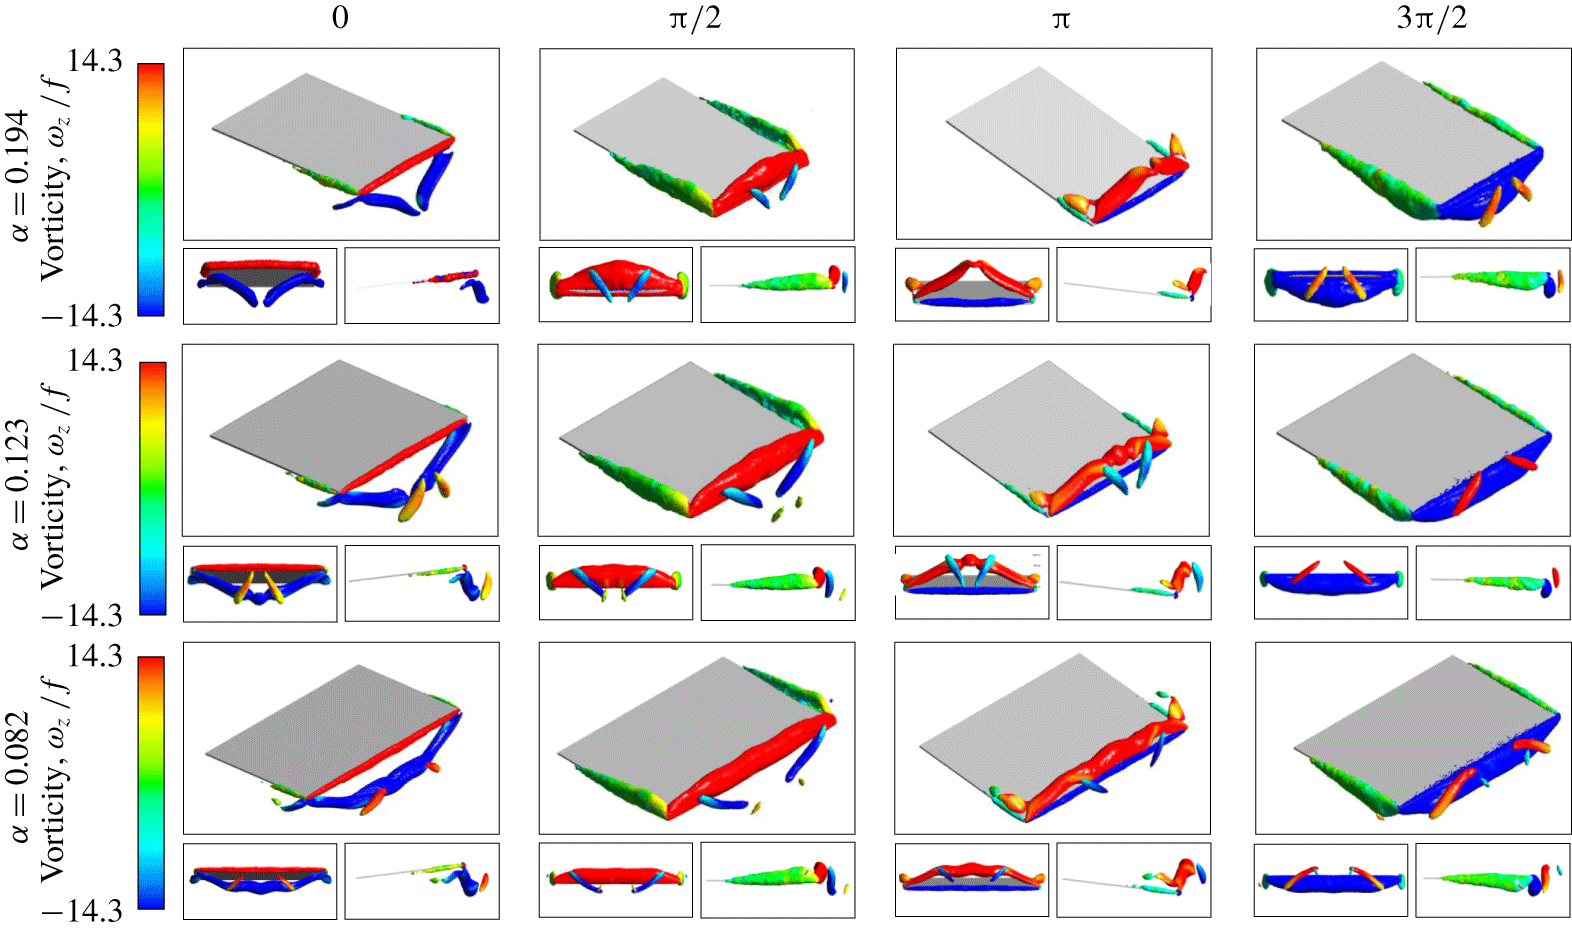
Figure 11 shows the downstream wake vortex structures for the plates of different widths. From the frontal views of the shed structures at  $\unicode[STIX]{x1D719}=0$ and
 $\unicode[STIX]{x1D719}=\unicode[STIX]{x03C0}$, we note that the maximum and minimum height of the vortex structures in the midspan are almost independent of the plate width, i.e. the vortex structures have the same normal distance from the trailing edge at the midspan. For the narrowest plate
 $(w=12.7~\text{mm})$, the vortex structure has a relatively higher curvature, which in turn makes the two wrapped substructures in
 $\unicode[STIX]{x1D719}=\unicode[STIX]{x03C0}/2$ and
 $\unicode[STIX]{x1D719}=3\unicode[STIX]{x03C0}/2$ closer to each other and oriented at a relatively small angle. For
 $w=20~\text{mm}$, the vortex core structure is less curved, and thus consecutive vortex substructures are further apart and oriented at a wider angle. For the widest plate
 $(w=30~\text{mm})$, the vortex structure is flat at the midplane, such that at low values of
 $\unicode[STIX]{x1D6FC}$ the flow near the trailing edge can be assumed to be 2-D.
Three-dimensional vortex structures obtained from numerical simulation over one full cycle of oscillation with different values of  $\unicode[STIX]{x1D6FC}$ for the plates with different widths
 $w=12.7~\text{mm}$ (case 3), 20 mm (case 1) and 30 mm (case 4).

4.2.2 Effects of plate aspect ratio, AR
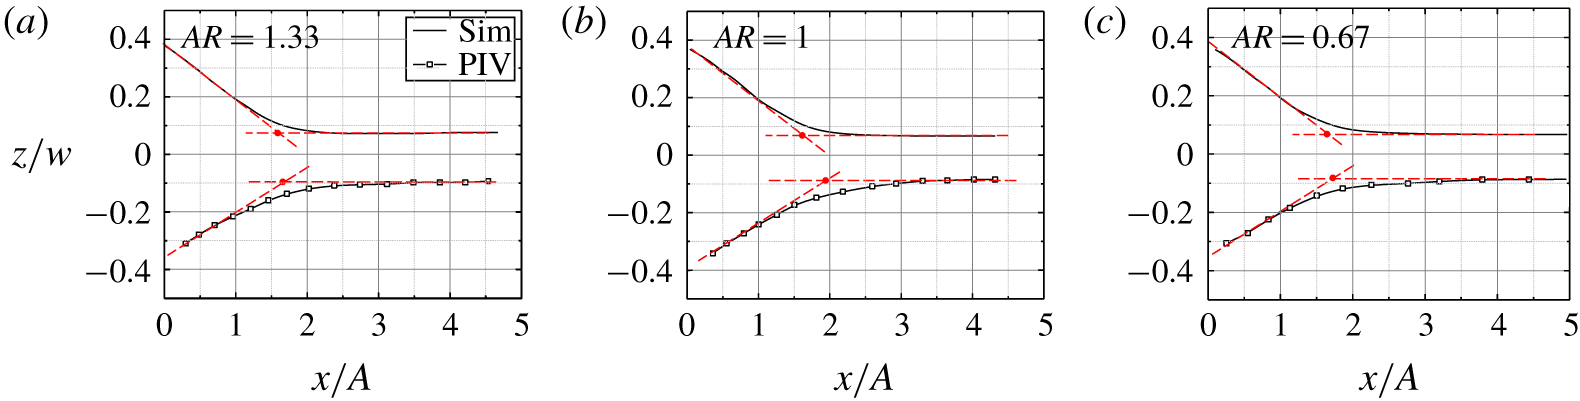
Our experimental and numerical simulation results show that, for the plates considered in the present study, the plate aspect ratio has relatively small effects on the geometry of the jet. Figure 12 shows the jet boundaries downstream of the pitching plates of different aspect ratios, showing no significant change. Only 3 % increase in the normalized necking length,  $x_{NP}/A$, and 18 % increase in the normalized non-contributing width,
 $w^{\ast }/w$, are observed when the plate aspect ratio is decreased by 100 %.
Effect of plate aspect ratio on the normalized jet boundary projected on the  $x$–
 $z$ plane for the plates with different lengths corresponding to (a) case 5
 $(l=15~\text{mm})$, (b) case 1
 $(l=20~\text{mm})$ and (c) case 6
 $(l=30~\text{mm})$.

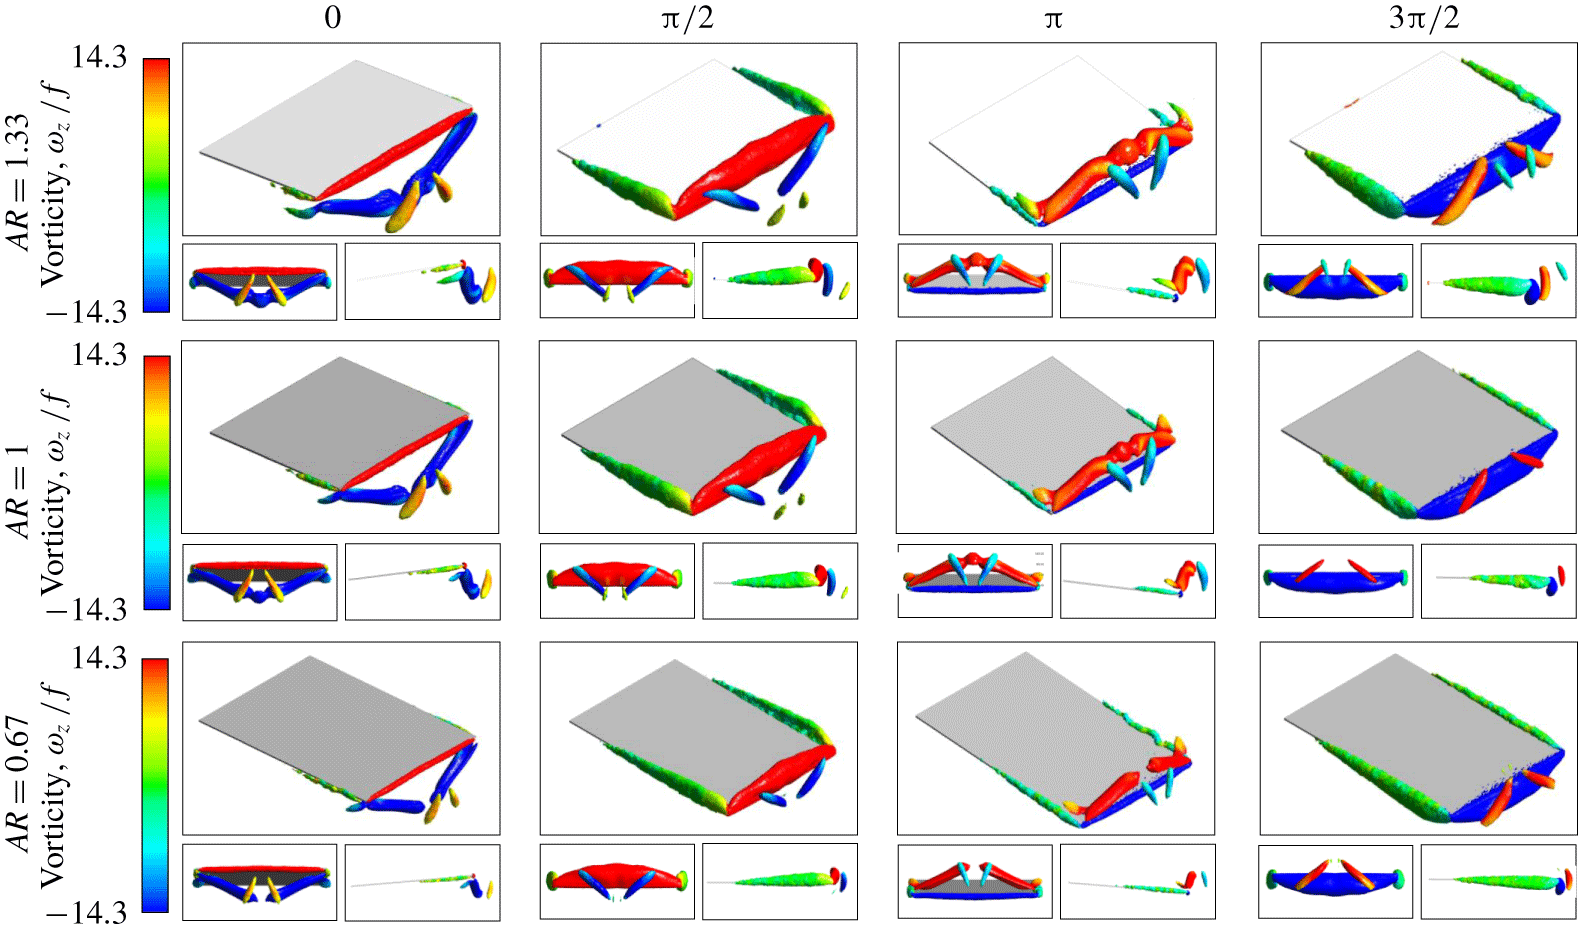
Figure 13 shows the wake vortex structures for different plate lengths examined. The curvature of the vortex structure is nearly identical in all three cases, indicating that the vibration amplitude and the plate width are the primary length scales affecting the wake. But the coherence of the vortex structures is weaker at smaller plate aspect ratios and the structures generated by these plates are more likely to break earlier.
Three-dimensional vortex structures obtained from numerical simulations during a full cycle of oscillation for plates with different aspect ratios, corresponding to different lengths in the respective rows:  $l=15~\text{mm}$ (case 5), 20 mm (case 1) and 30 mm (case 6).

4.2.3 Effects of Reynolds number, Re
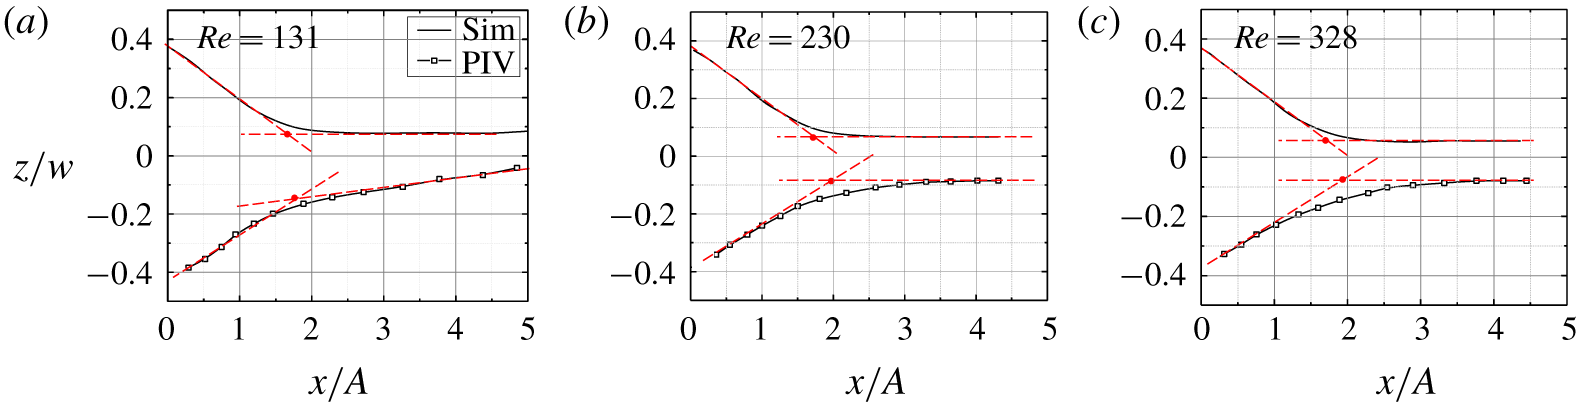
Figure 14 shows the jet boundary for three different vibration frequencies and hence different Reynolds numbers. Similar to the plate aspect ratio, changing  $Re$ does not affect the boundary of the jet. However, the magnitude of the jet velocity is almost linearly proportional to
 $Re$, as previously shown in figure 4. The slight up–down asymmetry observed in the PIV results at the lower
 $Re$ is believed to be an experimental artifact caused by environment disturbances.
Effect of  $Re$ on the normalized jet boundary projected on the
 $x$–
 $z$ plane for plates with different frequencies:
 $f=40$ (case 7), 70 (case 1) and 100 Hz (case 8).

4.2.4 Necking length and non-contributing width
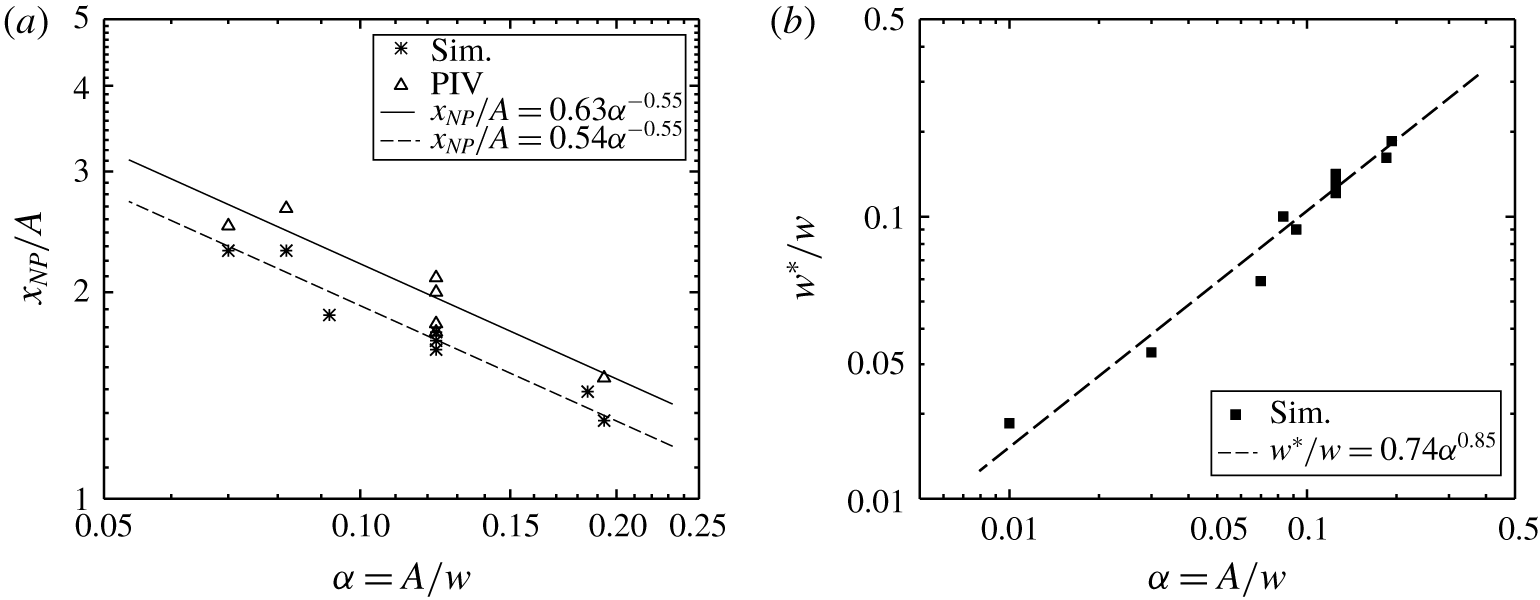
The normalized necking lengths for all the cases examined in this study are presented in figure 15(a). The necking length varies approximately with  $\unicode[STIX]{x1D6FC}$ as
 $$\begin{eqnarray}\frac{x_{NP}}{A}=n\unicode[STIX]{x1D6FC}^{m}.\end{eqnarray}$$
The power-law curve fits to our experimental and numerical simulation results are shown with the solid and dashed lines, respectively. The exponent,  $m$, is equal to
 $-0.55$, suggesting that the necking length is influenced to similar degrees by the plate width and vibration amplitude (
 $x_{NP}\sim A^{0.45}w^{0.55}$). We note that the quality of the curve fits in figure 15(a) is not sensitive to the exponent within a margin of
 $\unicode[STIX]{x0394}m=\pm 0.05$, suggesting approximately equal influence of the amplitude and the width. The coefficient
 $n$ is slightly
 $({\sim}17\,\%)$ larger for the experimental data. This difference may be attributed to a combination of factors, including the rigid-body approximation, the use of the first-order upwind scheme in the numerical simulation, and constant streamwise motion of seed particles due to buoyancy or other environment disturbances. Figure 15(b) shows that the normalized non-contributing width follows a similar power-law trend with
 $n=0.74$ and
 $m=0.85$ (
 $w^{\ast }=0.74A^{0.85}w^{0.15}$). The correlation suggests that the non-contributing width is predominantly governed by the amplitude of pitching motion and is only slightly affected by the plate width. This is consistent with the fact that the size of streamwise vortices produced at the lateral edges of the plate also scales with
 $A$ (Raspa et al. Reference Raspa, Ramananarivo, Thiria and Godoy-Diana2014). We believe that, at the sharp corners, these lateral vortices tend to suppress the trailing-edge vortices, which reduces the strength of vortices near the sharp corners and hence generates a non-contributing width.
(a) Normalized necking length as a function of the normalized vibration amplitude. The solid and dashed lines correspond to the power-law curve fits to the experimental and numerical simulation results, respectively. (b) Normalized non-contributing width obtained from the numerical simulation results as a function of the normalized amplitude. The dashed line represents the power-law curve fit.

4.3 Scaling laws for the shape of the jet
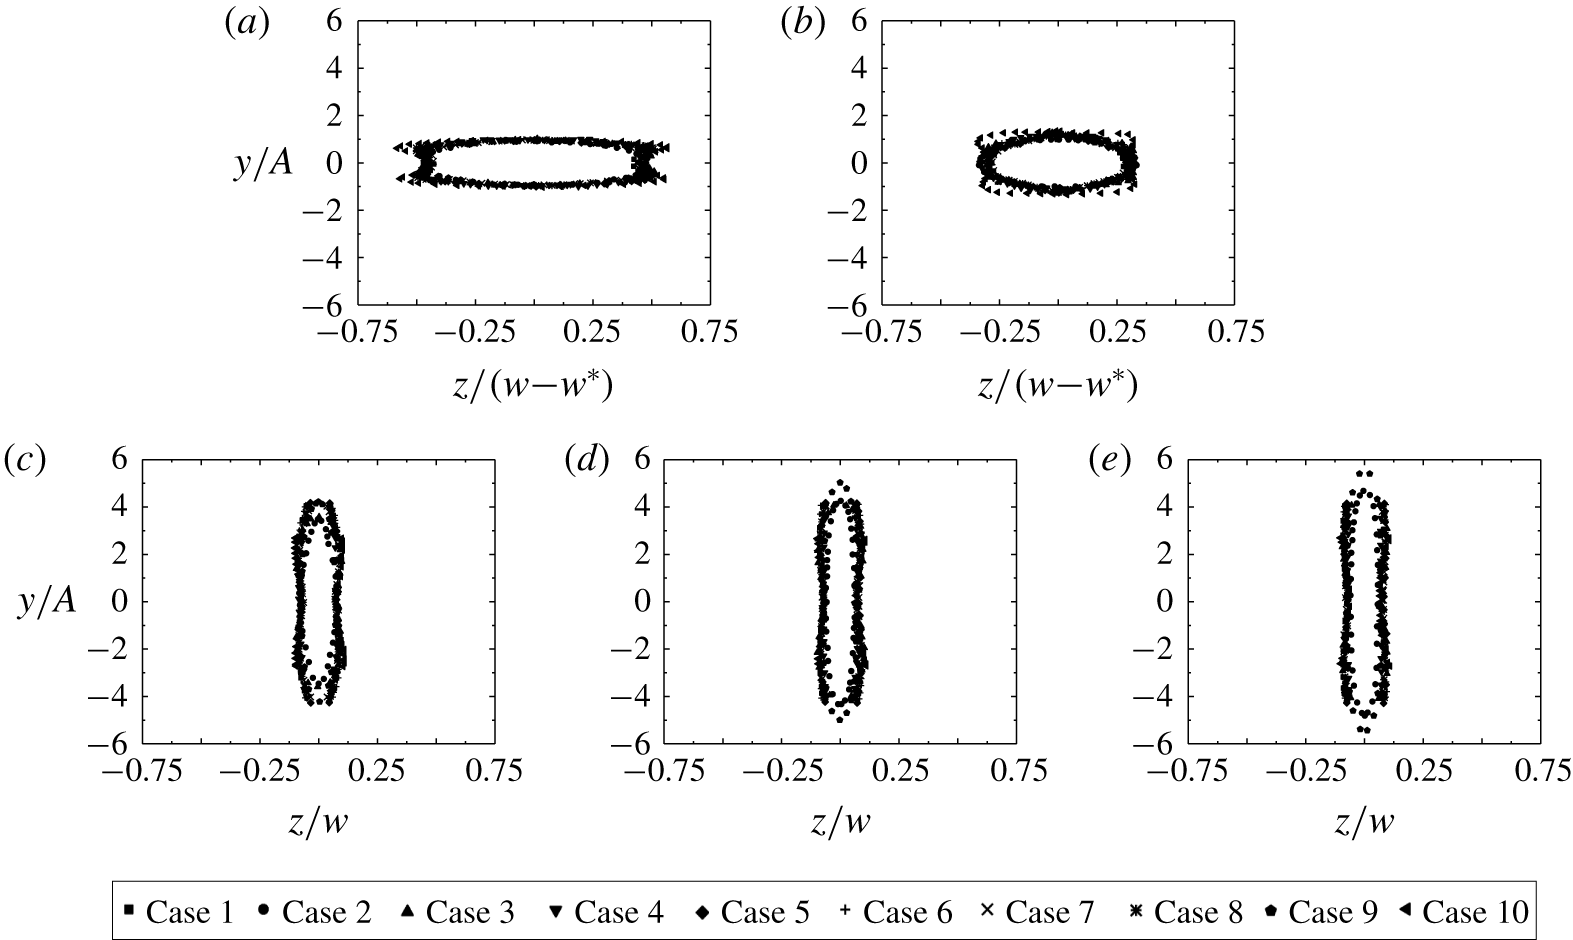
Figure 16 shows the jet boundaries, as projected on the  $y$–
 $z$ plane, at different streamwise locations from the trailing edge. The mean streamwise flow starts as a uniform jet exiting the aperture defined by the oscillation envelope. Before reaching the necking point (figure 16a,b), the jet shrinks linearly in the spanwise
 $(z)$ direction towards the midspan line but remains confined within approximately
 $\pm A$ in the normal
 $(y)$ direction. As the flow passes the necking point (figure 16c–e), the jet boundary expands in the normal
 $(y)$ direction. The width of the jet boundary (along the
 $z$ direction), however, remains nearly constant
 $({\sim}0.2w)$ after the necking point. We note that the jet boundaries from all the cases considered in the present study nearly collapse onto one curve if we normalize the position along the streamwise
 $(x)$ direction with
 $(Aw)^{1/2}$, the position along the normal
 $(y)$ direction with
 $A$, and the position along the spanwise
 $(z)$ direction with either
 $w-w^{\ast }$ (before the necking point) or
 $w$ (after the necking point). Accounting for the non-contributing width
 $(w^{\ast })$ in the normalization is important for convergence. After the necking point, the effect of the non-contributing width is diminished.
The transition from the contracting to the expanding region observed in the present study resembles the axis-switching phenomenon in non-circular jets (Krothapalli, Baganoff & Karamcheti Reference Krothapalli, Baganoff and Karamcheti1981; Hussain & Husain Reference Hussain and Husain1989; Koshigoe et al. Reference Koshigoe, Gutmark, Schadow and Tubis1989; Zaman Reference Zaman1996; Krebs et al. Reference Krebs, Silva, Sciamarella and Artana2012). In these past studies, the deformation of jet structures and subsequent development of axis switching is associated with the induced velocities of streamwise vortex pairs. The occurrence of this phenomenon is not unique; for instance, up to three axis switchovers are reported by Hussain & Husain (Reference Hussain and Husain1989) for a single jet. The first one is typically the most prominent, whereas the second and third switchovers take place much further downstream and are usually much weaker. Similar to our findings, the location of the first switchover was shown to be directly related to the jet aspect ratio (Krothapalli et al. Reference Krothapalli, Baganoff and Karamcheti1981). The uncertainty in these measurements, however, was large.
Jet boundaries projected on the  $y$–
 $z$ plane at different streamwise locations (a)
 $x/(Aw)^{1/2}=0.07$, (b)
 $x/(Aw)^{1/2}=0.29$, (c)
 $x/(Aw)^{1/2}=0.86$, (d)
 $x/(Aw)^{1/2}=1.14$, and (e)
 $x/(Aw)^{1/2}=1.43$.

5 Conclusion
We conducted a combined experimental and numerical study on the 3-D characteristics of the induced mean jet downstream of a pitching cantilever plate and correlated them with the transient behaviour of vortices in the wake. Our results showed that the time-averaged velocity field forms two distinct regions in the wake as identified by their shrinking or expanding nature. The first region extends from the trailing edge to a downstream distance of approximately  $0.55(Aw)^{1/2}$, called the necking point. In this region, the induced fluid jet from the trailing edge shrinks linearly in the spanwise direction towards the midspan line as the flow continues in the streamwise direction. The extent of the jet in the normal direction, however, remains contained within the tip-to-tip displacement of the trailing edge (
 $\pm A$). The velocity profile in the first region has a magnitude of approximately 5.6 times the tip velocity
 $(Af)$. The second region starts after the necking point. In this region, the jet boundary stops shrinking in the spanwise direction, forming approximately parallel surfaces
 $0.2w$ apart. It instead expands abruptly in the normal direction. An important feature of the second region is the appreciable decay of the streamwise velocity component downstream of the necking point.
To elucidate the physics behind the complicated shape of the mean jet, we examined the transient vortex formation at the sharp edges of the plate. Our 3-D visualization showed that the vorticity propagates into the wake in the form of curved coherent structures emanating from the trailing edge. These structures initially arch over the entire width of the plates and connect to the sharp corners. As they move in the streamwise direction, these structures lose their coherence due to diffusion and break into substructures. The resulting substructures tilt as they are convected downstream and induce the flow confinement observed in the mean jet.
We systematically studied the effect of several geometric and vibrational parameters on the shape of the induced jet. Our results revealed that the vibration amplitude and the width of the pitching plates are the primary factors affecting the shape of the jet. The oscillation frequency of the oscillations has minor effects on the mean jet geometry, even though the magnitude of flow velocity varies nearly in direct proportion to the frequency. We observed no significant influence of the length of the plates. We further showed that the jet boundaries for all the tested cases fall into a convergent surface when the spatial coordinates are normalized by appropriate length scales.
The present study helps improve our understanding of the complicated geometry of the mean jet downstream of a pitching plate. It also has practical significance in applications such as electronics cooling using piezoelectric fans. Placement of electronic components outside the jet boundary may result, for example, in inadequate heat dissipation and overheating of the components.
Declaration of interests
The authors report no conflict of interest.