


1. Introduction
Decades of research in political science have documented the influence of the social environment on individuals’ political beliefs, attitudes, and behaviors. This work typically focuses on the role of a single social environment in isolation. The dominant tradition examines individuals’ core networks, the handful of closest ties with whom people discuss important matters (e.g., Huckfeldt and Sprague, Reference Huckfeldt and Sprague1995; Huckfeldt et al., Reference Huckfeldt, Johnson and Sprague2004; Mutz, Reference Mutz2006). More recently, scholars have expanded attention to periphery networks of weaker ties (Pietryka and Sokhey, Reference Pietryka and Sokhey2026; Pietryka et al., Reference Pietryka, Santoro and Sokhey2026), and a few studies examine multiple social environments at the same time (McClurg, Reference McClurg2006a; Santoro, Reference Santoro2026).
Yet individuals are embedded in multiple social environments simultaneously. Core networks are only one piece of the social world. Neighborhoods, workplaces, voluntary associations, and the broader community all provide political information, expose individuals to political disagreement, and shape political attitudes and behaviors. Because much empirical work has studied these environments one at a time, we know surprisingly little about the cumulative role of an individual’s multiple social environments on political decision-making.
Consider a concrete example. Imagine an individual whose core network is politically homogeneous, meaning everyone around her agrees, but she lives in a competitive county, attends a religiously mixed congregation, and works alongside members of the opposing party. Now compare her to someone with that same homogenous core network who also lives in a like-minded community, worships with co-partisans, and belongs only to politically aligned organizations. By focusing on only their closest ties, the literature treats these two individuals similarly because their closest ties are identical. But prior work on autoregressive influence and contextual effects gives us reason to expect broader social environments to matter. The empirical question is how to measure those environments jointly and what is gained or lost by aggregating or disaggregating them.
Addressing this problem requires first confronting a prior question that the literature has not fully resolved. Should we study these multiple environments separately, or in aggregate? Should the effects of social influence be understood as discrete “snacks and meals,” each environment a distinct source of political information with its own mechanisms and effects? Or is there a single, cumulative “buffet” of social influence, an integrated experience of the political social world that is more than the sum of its parts?
This is not merely a measurement question. It is a theoretical one, and the answer has consequences for how we understand political attitude formation. As we develop below, both perspectives find theoretical support, and the tension between them is productive, not paralyzing. We use original survey data measuring political disagreement across four distinct social environments (core networks, periphery networks, affiliation networks, and social contexts) to examine both approaches and assess what each reveals. We find that disaggregated models preserve theoretically meaningful differences across environments, while an aggregated “global disagreement” measure reveals associations between the broader social environment and political attitudes that single-environment models miss. We argue that both approaches are informative, that each captures patterns the other cannot, and that the choice between them should be guided by theory and expectations rather than convention.
2. Beyond the core discussion network
A substantial literature documents the consequences of political disagreement exposure, including effects on tolerance (Mutz, Reference Mutz2002a, Reference Mutz2006), participation (Eveland and Hively, Reference Eveland and Hively2009; Mutz, Reference Mutz2002b; Nir, Reference Nir2005), and attitude strength (Levitan and Visser, Reference Levitan and Visser2008, Reference Levitan and Visser2009; Visser and Mirabile, Reference Visser and Mirabile2004), with these effects conditional on the amount of disagreement, its source, and individual characteristics (see Klofstad et al., Reference Klofstad, Sokhey and McClurg2013 for a review). This body of research shares a common limitation: it has most often examined disagreement within a single social environment.
This single environment focus reflects historical constraint and convention more than theoretical choice. Early measurement tools, particularly name generator techniques asking respondents to identify people with whom they discuss important matters, were designed to capture core networks in the individualized survey setting. The infrastructure of survey-based social network research developed around them. While the theoretical case for looking beyond core networks has long existed, the empirical literature has largely proceeded as if core networks were a sufficient window onto the socio-political world. Studies that do look beyond core networks have typically examined one alternative environment at a time, leaving the question of how multiple environments interact largely unaddressed.
There are notable exceptions. McClurg (Reference McClurg2006a) examines disagreement in the neighborhood context alongside core networks, finding that while the neighborhood social context shapes and constrains core network composition, core network effects largely absorb contextual influences. This suggests that the relationship between environments is not simply additive, and that different social environments may interact in ways that single-environment models cannot detect.
Pietryka and Sokhey (Reference Pietryka and Sokhey2026) introduce the aggregate relational data (ARD) battery to political behavior research as a technique for measuring weak ties, expanding beyond the traditional focus on core networks. Their paper validates these measures across multiple datasets, demonstrating strong test–retest reliability and construct validity. Pietryka et al. (Reference Pietryka, Santoro and Sokhey2026) use these ARD batteries to reassess the relationship between exposure to partisan disagreement and tolerance, finding that exposure to out-party members in individuals’ periphery networks is associated with increased tolerance, suggesting that the benefits of disagreement extend meaningfully beyond core relationships.
Santoro (Reference Santoro2026) examines disagreement in core networks, periphery networks, affiliation networks (which she labels whole networks), and broader social contexts simultaneously. Santoro finds that disagreement effects vary significantly across environments, with core and periphery networks associated with increasing attitude intensity. Critically, Santoro also finds that an additive measure of agreement across environments, ranging from no agreeing environments to all environments agreeing, predicts greater odds of stronger partisan and especially ideological identification. This work provides evidence that multiple environments matter and that their cumulative pattern is associated with political outcomes.
These studies show that a single environment focus can obscure meaningful variation in how and where individuals encounter disagreement. They also raise the question that motivates the current study. If multiple environments all matter, how should we treat them analytically? Should we study each environment separately, preserving the distinct mechanisms and effect sizes that characterize each one? Or should we aggregate across environments, treating the cumulative social experience as a unified phenomenon? Existing work answers the first part of the question by demonstrating that we should look beyond core networks. It does not resolve the second.
3. The aggregation question: snacks, meals, or buffets?
The central theoretical question of this paper is one that the literature on political disagreement has not fully resolved. When individuals are embedded in multiple social environments simultaneously, should we study the effects of those environments separately or in aggregate? This is not merely a question of measurement convenience. It reflects a deeper theoretical tension about how individuals experience, process, and integrate political information from the multiple social worlds they inhabit. The question has two dimensions. First, do disagreement measures across distinct social environments share enough common variance to justify combining them? If the environments are essentially uncorrelated, aggregation is incoherent. Second, even if environments are empirically correlated, does combining them into a single measure illuminate or obscure the processes we care about?
The tension is captured in Huckfeldt et al. (Reference Huckfeldt, Johnson and Sprague2004) account of social communication. They argue that “citizens do not experience their social setting as a whole. They do not consume their diet of information in a single bite, or even at a single meal. Rather… they consume socially supplied political information through a series of snacks and meals” (Huckfeldt et al., Reference Huckfeldt, Johnson and Sprague2004, p. 29). On this view, political information arrives in fragments, through discrete encounters with individual discussants, each weighted idiosyncratically by the credibility and social standing of the source. Citizens never directly experience the central political tendency of their environment but instead reconstruct it from fragmented exchanges. Each encounter is embedded within the cumulative effect of all prior encounters, creating what Huckfeldt et al. describe as a spatially autoregressive process in which “the impact of every social encounter depends on the cumulative social impact of all other social encounters” (p. 31).
This account suggests two conclusions about how to study disagreement across social environments. We take each in turn.
3.1. The case for disaggregation
Huckfeldt et al.’s (Reference Huckfeldt, Johnson and Sprague2004) emphasis on idiosyncratic weighting and fragmented experience supports the view that social environments should be studied separately. If individuals process political information through highly personalized filtering mechanisms and never experience their environment as a coherent whole, then combining disagreement across environments into a single measure risks obscuring the complexity of how political influence actually operates. Different environments operate through different mechanisms. The intimacy and repeated interaction that characterize close ties (Huckfeldt and Sprague, Reference Huckfeldt and Sprague1995) bear little resemblance to the weak-tie dynamics of casual acquaintances (Granovetter, Reference Granovetter1973), the ambient exposure of a politically competitive neighborhood (McClurg, Reference McClurg2006a), or the structured norms of collective participation in voluntary organizations. Treating them as interchangeable components of a single measure may obscure theoretically meaningful variation in how and why each matters. If each environment has distinct mechanisms and effect sizes, aggregation risks what statisticians call aggregation bias, or the appearance of a uniform effect that conceals heterogeneity in its component parts.
3.2 The case for aggregation
Yet Huckfeldt et al.’s (Reference Huckfeldt, Johnson and Sprague2004) framework also provides theoretical support for thinking about disagreement as a cumulative, integrated phenomenon. Their emphasis on the autoregressive nature of social influence, where each encounter is conditioned by all prior encounters, implies that what matters is not the snack or the meal in isolation but the accumulated pattern across all encounters and settings. When they note that “information is evaluated in a political context with respect to the information that is dominant within the setting” (p. 32), they are pointing toward the kind of cross-environmental integration that an aggregated measure attempts to capture. The buffet, in this account, is always open. Individuals move through multiple social environments in the course of ordinary life, and the political information they receive from each is interpreted in light of all the others.
This points toward a limitation in Huckfeldt et al.’s (Reference Huckfeldt, Johnson and Sprague2004) own empirical work. Despite theorizing about the cumulative and interconnected nature of social communication, their measurement approach focused primarily on core discussion networks. This was a practical constraint, not a theoretical choice, driven by the measurement tools available at the time. Our framework extends their theoretical insight by incorporating disagreement across periphery networks, affiliation networks, and broader social contexts, allowing us to observe a wider portion of the social environment that their theory describes.
The aggregated approach also returns to a foundational insight in political behavior research, the cross-pressure hypothesis. Lazarsfeld et al. (Reference Lazarsfeld, Berelson and Gaudet1948) recognized that individuals experience multiple, potentially competing social influences simultaneously. The classic example is a white-collar Catholic whose class and religious identities suggested opposing political loyalties. The insight was that the combined pattern of exposure across social contexts, not any single influence in isolation, shapes political outcomes. When the modern network literature adapted the cross-pressures hypothesis to study political communication, methodological constraints often narrowed the empirical focus to particular communication settings, especially core discussion networks, leaving the relationships among social environments difficult to observe directly. Our paper connects the original multi-environmental perspective of the cross-pressures tradition with the micro-level insights about fragmented processing that Huckfeldt et al. developed.
3.3 Reconciling the two perspectives
The reconciliation lies in recognizing that they address different questions, and that both questions are worth asking. Disaggregated models allow us to examine how social influence operates within each environment, comparing the magnitude and character of disagreement effects across distinct social environments. Aggregated models allow us to examine whether the cumulative experience of disagreement across environments produces systematic patterns that single-environment models miss. An individual who encounters disagreement from close ties, casual acquaintances, fellow organization members, and the broader community simultaneously is in a qualitatively different situation than one who encounters disagreement from only one of these sources, even if the disaggregated effect of each source is identical.
We therefore approach the aggregation question as a productive theoretical tension. The disaggregation perspective predicts that environments will differ meaningfully in the strength and pattern of their associations with political outcomes. The aggregation perspective predicts that a combined measure of disagreement across environments will capture variation in political attitudes that no single-environment model captures on its own. These predictions are not mutually exclusive. Both could be supported, which means the productive question is not which approach is correct, but when each is most informative. We assess both, compare what each reveals, and draw conclusions about how the choice of approach should depend on the inferential goal.
To accomplish this, we develop a measure of global disagreement that integrates exposure across core networks (closest ties), periphery networks (weak ties), affiliation networks (organizational contexts), and social contexts (geographic community). This measure enables us to test whether disagreement across environments shares a common latent structure, and if so, whether the resulting summary measure reveals associations with political attitudes that environment-specific measures do not. We present this measure alongside, rather than instead of, disaggregated analyses, so that readers can assess directly what each approach reveals and what each conceals.
4. Theory and hypotheses
The aggregation question matters only if disagreement in social environments has real consequences for political attitudes. Prior research establishes that it does. Visser and Mirabile (Reference Visser and Mirabile2004) demonstrate experimentally that individuals embedded in politically diverse networks exhibit weaker attitudes than those in attitudinally congruent networks. The mechanism is reinforcement and its absence. Social contacts who share one’s views provide repeated validation that strengthens attitude certainty, while disagreement introduces competing considerations that weaken attitude strength and increase openness to persuasion (Levitan and Visser, Reference Levitan and Visser2008, Reference Levitan and Visser2009). Zaller’s (Reference Zaller and Feldman1992) Receive-Accept-Sample model points to a similar process. Disagreement expands the set of competing considerations available at the moment of judgment, producing ambivalence and moderation (see also Groenendyk, Reference Groenendyk2013; Zaller and Feldman, Reference Zaller and Feldman1992). The question is not whether disagreement matters for attitudes but how to measure and model it when individuals are exposed to disagreement across multiple social environments simultaneously.
Santoro (Reference Santoro2026) establishes that the association between disagreement and political attitudes extends beyond core networks and that the cumulative pattern of exposure is associated with political outcomes. However, Santoro’s additive approach treats each disagreeing environment as contributing equally and does not test whether environments share common structure. We address both limitations here, using factor analysis to assess the dimensionality of disagreement across environments before aggregating and comparing disaggregated and aggregated models to evaluate what each approach reveals.
Before turning to hypotheses, one terminological distinction is useful. Much of the literature reviewed above uses the language of diversity, but the operationalizations almost uniformly measure disagreement: the extent to which others’ views differ from one’s own rather than the mere presence of varied viewpoints (Lupton and Thornton, Reference Lupton and Thornton2017; Santoro, Reference Santoro2026; Santoro and Eaton, Reference Santoro and Eaton2026). The distinction matters because the processes described above operate through the relational gap between the individual’s position and those in their social environment, not through variety alone. We focus on disagreement throughout.
We must also be precise about the outcomes we examine. We focus on the strength of partisan attachment and the strength of ideological identification. Following others in the literature (Green et al., Reference Green, Palmquist and Schickler2004; Mason, Reference Mason2018), we distinguish between these as conceptually related but psychologically distinct constructs. We also recognize that attitude strength is itself a multidimensional construct comprising importance, certainty, knowledge, and other components that do not always covary (Miller and Peterson, Reference Miller and Peterson2004). Our measures tap one component—the strength of identification with a partisan or ideological label—rather than attitude certainty or importance.
Partisanship, in the social identity tradition, is a psychological identification with a social group, sustained by the benefits of group membership, including belonging, self-esteem, and cognitive simplification. Partisan strength captures the intensity of that group identification, the degree to which an individual owns the partisan label. We refer to this as partisan attachment strength throughout.
Ideology presents a more complex case. Mason (Reference Mason2018) demonstrates that ideological labels can function as social identities in their own right, with citizens expressing affective attachment to “liberal” or “conservative” as group labels even when they hold few coherent policy positions. In this sense, ideological identification shares important features with partisanship. At the same time, Kinder and Kalmoe (Reference Kinder and Kalmoe2017), updating Converse’s (Reference Converse1964) classic findings, argue that genuine ideological thinking remains rare in the mass public and that ideological self-placement rests on somewhat thinner psychological foundations than partisan identification for most citizens. We do not attempt to resolve this debate here. What we measure is the strength of ideological self-placement, or how far an individual places themselves from the ideological midpoint. We refer to this as ideological strength throughout.
The two outcomes differ in ways that may matter for the aggregation question. Partisan identification is socially visible, deeply embedded in everyday group dynamics, and consistently reinforced through social interaction. Individuals can typically identify their discussants’ party affiliations, making partisan disagreement more immediately apparent in social encounters. Ideological positions, while increasingly identity-laden, are less socially visible and may be less consistently reinforced through the same group-based processes. This suggests that the two outcomes may respond differently to disagreement exposure, and potentially to the choice of modeling approach. Partisan identities, sustained by strong group-based reinforcement, may be more resistant to the cross-pressures that disagreement represents. Ideological identification, whether because it is less visible in interaction, less deeply reinforced, or both, may prove more responsive. We treat the relative sensitivity of partisan and ideological identification to disagreement as an empirical question rather than asserting a prediction in advance.
These dynamics motivate three hypotheses. The first tests the condition under which disaggregation is informative. The second and third test the aggregation perspective for each outcome separately.
-
Hypothesis 1 (Disaggregation): The association between political disagreement and attitude strength will differ across social environments in magnitude, for both partisan and ideological strength.
If supported, Hypothesis 1 establishes that social environments are not interchangeable and that an aggregated measure would conceal meaningful variation. If not supported, it strengthens the case for aggregation by suggesting that environments contribute similarly to attitude formation.
-
Hypothesis 2a (Aggregation, partisan attachment): Models that account for political disagreement across all social environments will explain variation in partisan strength that models restricted to core networks alone do not capture.
-
Hypothesis 2b (Aggregation, ideological strength): Models that account for political disagreement across all social environments will explain variation in ideological strength that models restricted to core networks alone do not capture.
We state the aggregation hypothesis separately for each outcome because, as developed above, partisan and ideological strength differ in social visibility and may therefore respond differently to the choice of modeling approach. If the aggregated approach outperforms core network only models for both outcomes, it establishes a general case for attending to the broader social environment. If the gains are concentrated in one outcome, it suggests that the appropriate level of aggregation depends not only on the inferential goal but on the nature of the political attitude under study.
These hypotheses are not mutually exclusive. Hypothesis 1 and Hypotheses 2a and 2b can all be supported simultaneously, which would be a theoretically productive outcome. It would mean that disaggregated models reveal meaningful variation across environments while aggregated models capture variation that single-environment models miss. The question is not which approach is correct, but when each is most informative.
5. Data and measures
This analysis employs original survey data from 1200 U.S. adults collected through Cloud Research’s Connect for Researchers platform in March 2025. The Connect platform provides access to high-quality survey respondents and has gained recognition among researchers as a reliable alternative to other on-line survey panels (Kay, Reference Kay2024; Stagnaro et al., Reference Stagnaro, Druckman, Berinsky, Arechar, Willer and Rand2024). The survey was specifically designed to capture political disagreement across multiple social environments, making it uniquely suited for examining patterns of global disagreement.
5.1 Sample design and characteristics
The study sample was constructed using demographic quotas to reflect the U.S. adult population. Recruitment targeted U.S. citizens currently residing in the United States, with quotas based on U.S. Census Bureau demographic benchmarks. Party identification targets were established using 2020 American National Election Study distributions: 46% Democrats, 42% Republicans, and 12% Independents. Despite these targets, our sample ended up containing 52% self-identified Democrats (including leaners), 4% true Independents, and 44% Republicans (including leaners). While these proportions differ slightly from the initial quota targets due to differences between Connect’s three-point screening measure and the survey’s seven-point scale, the high correlation between these measures (r = 0.91) confirms the reliability of the party identification data.
The resulting sample aligns with U.S. population benchmarks on key demographics. Gender distribution closely mirrors the U.S. population at 50.17% female, while the median age of 45 years approximates national demographics. Racial and ethnic composition includes 75.83% White respondents, 14.33% Black respondents, and 9.84% representing other racial and ethnic groups. Educational attainment shows some overrepresentation of college graduates (54.5% with bachelor’s degree or higher) relative to the national average (38%), which is consistent with typical patterns in online survey research (Appendix A).
5.2 Disagreement across social environments
Central to this project’s objectives, the survey instrument captured political disagreement exposure across four distinct social environments: core networks (closest personal relationships), periphery networks (weaker social ties), affiliation networks (via membership in voluntary organizations), and social contexts (geographic environments). For an extensive overview of these different types of associations, see Santoro (Reference Santoro2026).
Following Lupton and Thornton (Reference Lupton and Thornton2017), we operationalize political disagreement using a measure of the proportion disagreeing in each social environment, calculated as D/(A + D), where D = number of discussants (core networks), acquaintances (periphery networks), organizations (affiliation networks), or the vote share (social contexts) of all who disagree with the respondent and A = the number of discussants, group members, organizations, and the vote share of all who agree with the respondent. Thus, the measure captures the relative share of each environment that disagrees with the respondent rather than the absolute number of disagreeing individuals (e.g., D−A).
This measure was originally developed for core networks using name generators but has been adapted for use across all four social environments examined in this study (see Santoro, Reference Santoro2026 for more information). We employ the proportion disagreeing measure because it provides natural scaling across different social environments (the measure ranges from 0, denoting complete agreement, and 1, denoting complete disagreement), enabling meaningful comparisons of disagreement levels regardless of environment size or composition.Footnote 1
Core Networks represent an individual’s closest personal relationships, including family members, close friends, and romantic partners. These connections are characterized by high emotional investment and oftentimes frequent interaction. The intimate nature of these ties makes political disagreement particularly meaningful and potentially costly for individuals to navigate.
To measure core networks, the survey employed a name generator approach to identify respondents’ core discussion networks. Participants were asked to think of a person with whom they discuss important matters with and then answer questions about that individual (name interpreter). Each respondent could identify up to four discussants total, with all participants naming at least one person. The resulting core networks averaged 2.81 members with a median size of 3 discussants.
For each identified discussant, the survey collected detailed relational and political information. Relationship characteristics included connection type (spouse, family member, friend, colleague), gender, and frequency of political conversation. Political attributes encompassed the respondent’s assessment of each discussant’s political knowledge, party affiliation, ideological position, 2024 presidential vote choice, and electoral participation. Additionally, respondents evaluated their level of political agreement with each discussant, including the frequency of political disagreements and overall similarity of political opinions.
From the name interpreter questions, we constructed measures of overall political agreement and disagreement in their core networks by summing the number of discussants that agreed politically with the respondent (number in agreement) and the number of discussants that disagreed with the respondent (number in disagreement). We then created the proportion disagreeing measure as D/(A + D), where ‘D’ represents the number of discussants who disagreed with the respondent and ‘A’ represents the number who agreed (as used in McClurg, Reference McClurg2006b).Footnote 2 This measure captures the relative share of the core network that holds opposing political views and ranges from 0 (no disagreement) to 1 (complete/total disagreement—or, when every listed discussant disagrees with the respondent).
Because of the extensiveness of the core network battery, we were able to create the proportion disagreeing measure based on comparing the party identification, ideology, and candidate choice of the respondent with their discussants. Accordingly, we have three proportion disagreeing measures for core networks (and three for each of the following network types)—one measure for the proportion disagreeing based off party identification, one for ideology, and one for candidate choice.
The core networks in this sample demonstrate considerable political homogeneity, with most respondents reporting substantial agreement with their closest discussants. The mean levels of core network disagreement ranged from 0.21 (out of the 0 to 1 scale) for party identification and ideology and 0.19 for candidate choice disagreement (see Table 1). This pattern aligns with existing research on political discussion networks while providing a baseline for comparison with disagreement patterns in other social environments.
Candidate disagreement across social environments

Table 1 Long description
The table presents data on candidate disagreement across four social environments: Core network, Periphery network, Affiliation network, and Social context. It has four rows and five columns. The columns are labeled Candidate disagreement, N, Mean, Min, and Max. The row labels are Core network, Periphery network, Affiliation network, and Social context. Each row provides the number of observations (N), the mean disagreement score, the minimum disagreement score, and the maximum disagreement score. Row 1: Core network, 1158, 0.19, 0, 1. Row 2: Periphery network, 1155, 0.27, 0, 1. Row 3: Affiliation network, 747, 0.20, 0, 1. Row 4: Social context, 1145, 0.46, 0, 1.
Periphery Networks consist of individuals’ casual acquaintances—people they know well enough to recognize and engage in conversation but with whom they lack strong, frequent interactions. These connections include coworkers, neighbors, and various social contacts who represent individuals’ weaker social ties. Due to their greater number and lower emotional investment, these networks expose individuals to a wider array of political perspectives without the psychological costs associated with disagreement among close relationships.
To capture political exposure beyond core discussion networks, the survey incorporated an ARD approach adapted from DiPrete et al. (Reference DiPrete, Gelman, McCormick, Teitler and Zheng2011). This technique measures respondents’ broader social acquaintanceship patterns through the following prompt:
“Now we’d like you to think of all the people you are acquainted with (meaning that you know their name and would stop and talk at least for a moment if you ran into the person on the street or in a shopping mall). How many are you pretty certain have the following attributes [0/1/2-5/6-10/More than 10].”
The ARD battery presented respondents with eighteen different attributes spanning political, demographic, and social characteristics. Political attributes included party affiliation (Republicans, Democrats), ideological orientation (conservatives, liberals), 2024 voting behavior (Trump voters, Harris voters, general electoral participation), and other politically relevant characteristics. The complete attribute list also encompassed demographic markers such as race, education, religion, sexual orientation, and various social experiences (see Appendix B). Attribute presentation was randomized across respondents to minimize order effects.
Political disagreement in periphery networks was operationalized through respondents’ reported contact with individuals holding opposing political positions. For example, Democratic respondents’ exposure to Republican acquaintances indicates periphery network disagreement, while contact with Democratic acquaintances reflects agreement. We created the proportion disagreeing measure as Out-group/(In-group + Out-group), where Out-group represents the estimated number of acquaintances with opposing political characteristics and In-group represents the estimated number of acquaintances with similar political characteristics. This measure ranges from 0 (complete agreement) to 1 (complete disagreement), providing a standardized metric of political disagreement exposure within periphery networks. As with core networks, we calculate the proportion disagreeing measure for periphery networks using party identification, ideology, and candidate choice.
Analysis of periphery network composition reveals considerably greater political diversity compared to core discussion networks. The mean levels of disagreement in periphery networks ranges from 0.27 (out of the 0–1 scale) for candidate choice and 0.30 and 0.29 for partisan and ideological disagreement, respectively (Table 1). This pattern suggests that while individuals maintain politically homogeneous inner circles, their broader social environments contain more varied political perspectives, highlighting the importance of examining disagreement across multiple network contexts.
Affiliation Networks represent the organizational contexts in which individuals voluntarily participate, including religious congregations, civic associations, professional organizations, and social clubs. These networks are characterized by shared goals and structured interactions that shape how political disagreement is experienced and managed through organizational norms rather than solely interpersonal dynamics.
To examine political influence within these organizational contexts, the survey measured respondents’ membership in voluntary associations. This approach draws on established work (see its use in the General Social Survey) and provides a practical means of assessing whole network effects within survey constraints. Participants were presented with the following question:
“We would like to know something about the groups and organizations to which individuals belong. Here is a list of various kinds of organizations. Could you tell me whether or not you are a member of each type? [Yes; No; Don’t know/Unsure]”
The organizational inventory encompassed 16 different association types presented in randomized order, covering diverse organizational categories from professional groups to recreational clubs (see Appendix B). This measurement strategy offers a feasible approach to capturing organizational influences, though it primarily identifies formal membership rather than informal group participation patterns (e.g., Paxton and Rap, Reference Paxton and Rap2016).
For organizations where respondents indicated membership, additional questions assessed the political composition of each group. Specifically, participants evaluated whether fellow members were predominantly Democrats, Republicans, or represented a mixture of both parties. They also characterized the ideological orientation of group members as primarily liberal, conservative, or moderate. Finally, respondents reported their perception of which 2024 presidential candidate received majority support among organization members. We constructed the proportion disagreeing measure as Organizations dominated by out-party/(Organizations dominated by in-party + Organizations dominated by out-party), ranging from 0 (all organizations dominated by in-party) to 1 (all organizations dominated by out-party).Footnote 3 For ideological disagreement, the numerator is the number of organizations dominated by the respondent’s ideological out-group; for candidate disagreement, it is the number of organizations dominated by the candidate the respondent did not support.
There is meaningfully less disagreement present in affiliation networks than in periphery networks, and especially the social context. Table 1 depicts mean levels of disagreement in affiliation networks, which ranges from 0.16 to 0.20.
For the 433 respondents who reported no voluntary association memberships, the disagreement measures are mathematically undefined, representing a qualitatively different situation from having memberships with zero disagreement since these individuals are not experiencing voluntary associations at all. Active exposure to an agreeable, homophilous association is qualitatively different than simply not being exposed to associations at all. As such, we cannot estimate a global exposure to disagreement measure for these respondents for construct validity reasons. To address this issue, we treat these respondents as missing data in the analyses that follow, thereby reducing the reported number of observations in subsequent tables. Future work could consider a partial exposure to global disagreement measure that omits association-level variables.
Social Contexts represent the broader geographic and institutional environments in which individuals are embedded, including neighborhoods, communities, and cities. These contexts can provide ambient political exposure that individuals may not consciously recognize but that nevertheless shapes their political attitudes through environmental cues rather than through direct social interaction.
Geographic political context was assessed using respondents’ residential zip codes, which were subsequently linked to county-level 2020 presidential election results to determine local political composition.Footnote 4 For the candidate choice analyses, we constructed the social context proportion disagreeing measure using the same logic as the network measures: D/(A + D), where D represents the share of the respondent’s county supporting the opposing major-party candidate and A represents the share supporting the respondent’s own major-party candidate. For respondents who reported voting for Trump, disagreement is measured as the Democratic presidential vote share divided by the combined Democratic and Republican presidential vote share in the respondent’s county. For respondents who reported voting for Harris, disagreement is measured as the Republican presidential vote share divided by the combined Republican and Democratic presidential vote share. Respondents without a Trump or Harris vote choice (e.g., who voted for a third party candidate) remain in the survey but do not receive values on the candidate disagreement measure because agreement and disagreement cannot be defined around a two-party candidate choice. This measure ranges from 0 to 1, where 0 indicates no disagreement (no out-party voters in the area), 0.5 indicates equal presence of in-party and out-party voters, and 1 indicates complete disagreement (all voters in the area support the opposing party). Mean candidate disagreement in social contexts (0.46) is roughly double the mean in any of the three network environments (0.19 to 0.27), consistent with the interpretation that geographic context and interpersonal networks capture different aspects of political exposure. Table 1 contains descriptive statistics for candidate disagreement by environment type.
Global disagreement factor analysis results

Table 2 Long description
A table comparing global disagreement factor analysis results. The table has two panels: Panel A and Panel B. Panel A shows Eigenvalues with four rows and three columns. Column headers are Factor, Eigenvalue, and Proportion. Row 1: Factor 1, Eigenvalue 1.43, Proportion 0.85. Row 2: Factor 2, Eigenvalue 0.22, Proportion 0.13. Row 3: Factor 3, Eigenvalue 0.02, Proportion 0.01. Row 4: Factor 4, Eigenvalue 0, Proportion 0. Panel B shows Factor loadings with four rows and three columns. Column headers are Environment, Loading, and Communality. Row 1: Environment Core network, Loading 0.57, Communality 0.32. Row 2: Environment Periphery network, Loading 0.79, Communality 0.62. Row 3: Environment Affiliation network, Loading 0.56, Communality 0.31. Row 4: Environment Social context, Loading 0.35, Communality 0.12.
5.3 Measuring global disagreement
To construct a global disagreement measure, we consider the proportions of individuals in our respondents’ core, periphery, affiliation networks, and social contexts who diverged in their candidate choice in the most recent presidential election following McClurg (Reference McClurg2006b) and Lupton and Thornton (Reference Lupton and Thornton2017). We believe a proportion better captures the theoretical concept of exposure to disagreement, as some individuals simply have larger and denser social networks than others (see also Lupton and Thornton, Reference Lupton and Thornton2017).
We then performed an iterated principal factor analysis of these four measures of proportion disagreeing across the four social environments. This analysis was performed for the 735 observations with non-missing values on all four candidate-specific measures. Table 2 shows the results of this analysis. As Table 2 demonstrates, a single latent factor explains about 85 percent of the total joint variability across these four measures. No other factor presents an eigenvalue remotely approaching 1, the standard threshold for retaining factors (Kaiser, Reference Kaiser1960). As such, we extract this first factor and utilize it as our measure of global disagreement in the analyses that follow.Footnote 5
Table 2 also reports the individual factor loadings for each environment on the extracted latent factor. Periphery networks load most strongly (0.79), followed by core networks (0.57) and affiliation networks (0.56), with social context loading most weakly (0.35). The corresponding communalities indicate that the latent factor accounts for approximately 62% of the variance in periphery network disagreement but only 12% of the variance in social context disagreement. This pattern is consistent with the distributional evidence shown in Figure 1: social context, with its mean roughly double that of any network environment and its distinct distributional shape, shares the least variance with the other three measures. The uneven loading structure is informative for the aggregation question. It suggests that while the four environments share a common dimension, they do so to varying degrees, and an aggregated measure will be more heavily weighted toward the network-based environments than toward geographic context.
Ridgeline plot of candidate disagreement across social environments.

Figure 1 Long description
The image contains four ridgeline plots stacked vertically, each representing a different social environment: Core Network, Periphery Network, Affiliation Network, and Social Context. Each plot shows the distribution of the candidate disagreement measure within that environment. The x-axis for all plots is labeled 'Proportion Disagreeing' and ranges from 0.0 to 1.0. The y-axis is not labeled with specific values but indicates the density of the proportion disagreeing. Each plot has a dashed vertical line representing the group mean for that environment. The Core Network plot, colored in blue, shows a high density of low disagreement proportions with a mean (M) of 0.19 and a sample size (N) of 1,158. The Periphery Network plot, in green, displays a more spread-out distribution with a mean of 0.27 and a sample size of 1,155. The Affiliation Network plot, in red, is concentrated near zero, with a smaller right tail and an additional concentration near 1.0; its mean is 0.20 and its sample size is 747. The Social Context plot, in purple, shows the highest mean disagreement proportion of 0.46 with a sample size of 1,145. The dashed lines in each plot indicate the group mean for that specific social environment.
We treat this factor structure as informative evidence for the plausibility of aggregation rather than as decisive justification. Factor co-loading is consistent with aggregation but does not require it. It is possible for items to share a common underlying dimension while still having meaningfully different associations with the outcomes of interest. Indeed, the uneven loading structure reported in Table 2 suggests this is precisely the case here. The four environments contribute to the latent factor to varying degrees, meaning that an aggregated measure will reflect some environments more than others. We therefore present models using this global disagreement measure alongside disaggregated environment-specific models, explicitly comparing what each approach reveals.
5.4 Dependent variables
The survey instrument measured multiple dimensions of political attitudes to assess how global disagreement exposure influences different aspects of political life. Two primary outcome variables form the focus of this analysis. First, respondents’ self-reported strength of their partisan attachment—do they consider themselves strong Republicans/Democrats, or not very strong? Second, respondents’ self-reported ideological strength—do they consider themselves very conservative/liberal, or only somewhat conservative/liberal?
Party identification was measured using the standard seven-point party identification scale ranging from Strong Democrat to Strong Republican, with Independent as the midpoint. No “don’t know” option was provided to discourage satisficing. The sample distribution shows 52.16% identifying as Democrats, 43.84% as Republicans, and 4% as pure Independents. From this measure, we constructed an index of partisan strength coded as: 0 for Independents, 1 for partisan leaners, 2 for weak partisans, and 3 for strong partisans.
Ideological identification was captured through the seven-point scale from Extremely Liberal to Extremely Conservative, with Moderate as the center point. The sample distribution reveals 47% identified as liberals, 43.42% as conservatives, and 9.83% as moderates. The strong correlation between ideological and partisan measures (r = 0.86) reflects the typical alignment between these political orientations. An ideological strength variable was created using the same coding scheme as partisan strength, with moderates receiving the lowest score and extreme ideologues receiving the highest. The correlation between our partisan strength and ideological strength variables is more modest, but still strong (r = 0.61).
These outcome measures capture the intensity of both partisan and ideological identification, enabling examination of how global disagreement patterns relate to each other. Descriptive statistics reveal a politically engaged sample with balanced partisan (mean = 3.75 on a 1–7 scale) and ideological (mean = 3.87) distributions. Table 3 displays the descriptive statistics of the strength variables.
Descriptive statistics for outcome variables

Table 3 Long description
A table comparing descriptive statistics for partisan and ideological strength. The table has two rows and six columns. The columns are labeled Variable, Mean, SD, Min, Max, and N. Row 1: Partisan strength, Mean 2.39, SD 0.79, Min 0, Max 3, N 1200. Row 2: Ideological strength, Mean 1.84, SD 0.91, Min 0, Max 3, N 1200.
5.5 Control variables
Of course, our two dependent variables have many potential correlates. In the analyses to follow, we account for a variety of well-established predictors of political behavior and attitudes, particularly in a social network context. Following Santoro (Reference Santoro2026), we use the following battery of control variables (see Appendix B):
-
• Core network size to account for the size of respondents’ closest ties.
-
• Sociality, to account for respondents’ general level of exposure to social environments.
-
• Affiliation network size, to account for respondents’ varying levels of social engagement
-
• Political interest, measuring respondents reported interest (scale = not at all, very little, somewhat, quite a lot, a great deal), with the reference category “Not at all”
-
• Respondents’ self-reported race, age, gender, level of education, and socio-economic status
6. The landscape of political disagreement across social environments
Before estimating the relationship between disagreement and political attitudes, we describe the landscape of candidate disagreement across our four social environments. This descriptive portrait establishes what disagreement looks like within each environment, how consistently it appears across environments, and whether the empirical structure supports the aggregation approach developed in the theoretical framework. Throughout this section, we focus on candidate-choice disagreement, which serves as the basis for our global disagreement measure.
6.1 Distributional patterns within environments
Figure 1 presents ridgeline density plots of candidate disagreement in each social environment. The distributions reveal variation in both the level and shape of disagreement across environments. Core networks (M = 0.19, N = 1,158) and affiliation networks (M = 0.20, N = 747)Footnote 6 show similar mean levels of disagreement, with distributions concentrated heavily near zero. Most respondents report little to no candidate disagreement among their closest ties and organizational affiliations. The low means mask important distributional features, however. Both environments show long right tails, indicating that a meaningful minority of respondents experience substantial disagreement even in these relatively homogeneous settings. Both distributions also appear lumpy rather than smooth. This is because the core network measure is built from at most four discussants and most respondents belong to only a handful of voluntary organizations, so the proportion disagreeing in each case can take on only a small number of possible values. The concentration near zero is substantively real, but the sharpness of the spike at exactly zero reflects the small number of possible values the proportion can take when the denominator is small (e.g., a respondent with three core discussants who all agree produces a proportion of exactly zero, with no values available between zero and one-third).
Periphery networks (M = 0.27, N = 1,155) show a higher mean and a distinctive bimodal shape, with one concentration near zero and a second near 0.40. This pattern suggests two subpopulations, one whose broader acquaintance circles are politically uniform and another whose acquaintances include substantial representation of the opposing candidate’s supporters. Some of this distributional difference relative to the core and affiliation environments reflects measurement. The ARD battery used for periphery networks asks respondents to estimate counts of acquaintances across categorical response options, yielding a proportion with more possible values than the small-denominator measures used for core and affiliation networks. The bimodality in the periphery distribution should be interpreted with this difference in mind, though the broad, rounded shape of the two modes appears more consistent with meaningful heterogeneity than with a simple measurement artifact. The higher mean is not obviously reducible to the instrument alone; it is consistent with the weak-tie literature’s expectation that acquaintance networks bridge otherwise disconnected social clusters (Granovetter, Reference Granovetter1973; Pietryka and Sokhey, Reference Pietryka and Sokhey2026), increasing individuals’ exposure to political disagreement beyond what they encounter in their core networks.
Social context (M = 0.46, N = 1,145) stands apart from all three network environments. Its distribution centers near 0.50, reflecting the geographic reality that most Americans live in communities where the opposing party holds a nontrivial vote share. The mean social context disagreement is roughly double that of any network environment. Social context is also measured differently from the other three environments. Specifically, it is constructed from county-level election returns rather than self-reported assessments of interpersonal political composition, and its smooth, continuous distribution reflects that difference. If social context measures something structurally different from network-based disagreement, combining them into a single index requires justification beyond statistical co-loading.
6.2 Cross environment consistency
These distributions describe disagreement within each environment separately, but a central question for this paper is how disagreement is distributed across environments simultaneously. Figure 2 addresses this by showing, for each respondent with valid data in all four environments (N = 735), the number of environments in which they experience any candidate disagreement, as measured by the proportion disagreement measure.
Cross-environment consistency of candidate disagreement.

Cross-environment disagreement is the norm, not the exception. No respondent reported zero candidate disagreement across all four environments. The modal category is disagreement in three environments (34%), followed by two environments (31%) and all four environments (20%). Only 15% of respondents experience candidate disagreement in a single environment alone.
This finding speaks directly to the cross-pressures tradition discussed above. The vast majority of respondents are simultaneously embedded in multiple disagreeing environments. The question is not whether individuals encounter disagreement, virtually all do, but whether they encounter it in one environment or many, and whether the cumulative pattern matters above and beyond any single source. For the 20% exposed to candidate disagreement across all four environments, disagreement extends throughout their social worlds. For the 15% exposed in only one environment, the pattern is more localized.
6.3 Who encounters disagreement, and where?
Figure 3 examines who encounters candidate disagreement and where, breaking down mean exposure by gender, race, age, and party identification across the four environments. Several patterns emerge.
Mean candidate disagreement by demographic group and social environment.

Figure 3 Long description
The image contains four bar graphs, each depicting mean candidate disagreement by demographic group and social environment. Panel A shows the data for gender, with bars for men and women across different social environments: Core Network, Periphery Network, Affiliation Network, and Social Context. Panel B presents the data for race, with bars for White, Black, and Other across the same social environments. Panel C illustrates the data for age, with bars for different age groups (18-34, 35-49, 50-64, 65+) across the social environments. Panel D shows the data for party identification, with bars for Democrats, Republicans, and Independents across the social environments. Each bar graph has the mean proportion disagreeing on the vertical axis and the social environments on the horizontal axis. Notable trends include higher disagreement in the Social Context for all demographic groups, with specific values and significant differences marked by asterisks.
Gender differences are modest but statistically significant in three of four environments. Men report higher candidate disagreement than women in core networks, periphery networks, and social contexts (p < .05 in each case). The gender gap is absent in affiliation networks. Age differences are most pronounced in periphery networks, where the youngest cohort (18–34) reports significantly higher disagreement than older cohorts (p < .05).
The most striking demographic pattern involves party identification. Independents report the highest candidate disagreement across all four social environments, substantially so in core networks, where their mean disagreement (0.32) exceeds that of Democrats (0.18) and Republicans (0.19) by a wide margin (p < .001). This pattern reflects how the candidate disagreement measure is constructed. Figure 3 groups respondents by party identification, but candidate disagreement is measured relative to the respondent’s 2024 presidential vote choice. Independent respondents who supported Trump are coded as agreeing with Trump-supporting contacts and disagreeing with Harris-supporting contacts, while Independent respondents who supported Harris are coded oppositely. Respondents who did not report a Trump or Harris vote choice remain in the survey data, but they do not receive values on the candidate disagreement measures used here because agreement and disagreement cannot be defined around two-party candidate choice. The higher disagreement among Independents therefore does not mean that all partisan contacts are automatically counted as disagreement. Instead, it suggests that Independents who did report a Trump or Harris vote are embedded in less consistently aligned social environments than Democrats or Republicans. The partisan gap narrows in social context, where all three groups converge near 0.45–0.51, reflecting the common geographic reality of politically mixed communities.
Taken together, these descriptive patterns establish that candidate disagreement is pervasive, multi-environmental, and structured by both geography and social position. Most respondents encounter disagreement in multiple environments simultaneously, and the four measures share substantial common variance, but with important differences in level, distribution, and demographic patterning that the aggregated measure cannot capture. We now turn to the question of whether this disagreement is associated with the strength of political attitudes, examining what both aggregated and disaggregated approaches reveal.
6.4 Results, hypothesis 1: disaggregating disagreement across environments
Partisan and ideological strength are four-point ordinal measures, so we estimate all models using ordered logistic regression (Long and Freese, Reference Long and Freese2006). Hypothesis 1 predicts that the four social environments in which Americans encounter political disagreement have different relationships to the strength of partisan and ideological identification. If the source of disagreement does not matter, the four environment-specific measures should perform comparably once entered jointly in the same model. If the environments are distinct sources of exposure, the four coefficients should differ from one another in size and in whether they are statistically distinguishable from zero.
Table 4 reports ordered logistic regression models in which all four measures of candidate disagreement are entered simultaneously. Models 1 and 2 predict partisan strength, without and with controls. Models 3 and 4 do the same for ideological strength. The sample is restricted to the 735 respondents with data on every environment (full model results available in Appendix C).
Disaggregated models of partisan and ideological strength on disagreement across social environments

Table 4 Long description
Table 4 presents four ordered logistic regression models of partisan and ideological strength. Rows report core, periphery, affiliation, and social context disagreement, controls, thresholds, AIC, and N. Periphery disagreement is negative and significant in all models; core disagreement is significant in Models 1, 3, and 4; affiliation disagreement is significant in Models 3 and 4; social context disagreement is not significant.
Notes: *p < .05, **p < .01, ***p < .001. For all disagreement measures, classifications that are neither Harris- nor Trump-aligned are excluded from the denominator, where applicable. Models with controls include discussion network size, sociality, affiliation network size, political interest dummies (very low interest as the reference category), female, age, white, less than college, and high social class. Coefficients on controls suppressed for readability.
Three findings stand out. First, disagreement from periphery networks—the broader set of acquaintances with whom respondents discuss politics less frequently than their closest ties—has the largest point estimate in each specification and remains statistically significant after controls are added (b = −0.99, p < .05 for partisan strength; b = −1.34, p < .001 for ideological strength). We do not interpret these coefficient differences as evidence that periphery disagreement is statistically distinguishable from core disagreement. To assess the substantive size of the two associations more directly, we compared the change in the predicted probability of reporting the strongest level of partisan or ideological attachment as core and periphery disagreement each move from their observed minimum to their observed maximum, holding the remaining covariates constant. Both core and periphery disagreement are associated with lower predicted probabilities of the strongest partisan and ideological attachments, but the predicted probability changes are not statistically different from one another. Thus, although periphery disagreement has the largest point estimates in these models, the evidence does not support the claim that periphery disagreement is more consequential than core disagreement for attitude strength.
Still, the pattern is substantively important because it suggests that disagreement encountered in broader acquaintance networks is closely associated with weaker partisan and ideological attachments. In the model with controls, the periphery is the only environment whose relationship with partisan strength clears conventional significance, and its association with ideological strength is the largest of the four.
Second, core network disagreement retains a meaningful association with both outcomes, but its magnitude is smaller than the periphery’s, and its association with partisan strength weakens to marginal significance once controls are introduced (b = −0.56, p < .10 in Model 2). Disagreement from core networks remains relevant, especially for ideological strength, but it is not the strongest association in these specifications.
Third, disagreement from affiliation networks and social contexts behave differently from one another and across outcomes. Disagreement within affiliation networks is reliably associated with lower ideological strength in both Model 3 (b = −0.60, p < .05) and Model 4 (b = −0.54, p < .05) but bears no detectable relationship to partisan strength. Disagreement from social contexts is statistically indistinguishable from zero for both outcomes in every specification, and its sign is not stable across models. Of the four environments, social context disagreement appears least connected to the strength of political identity.
Taken together, these results are consistent with Hypothesis 1. The four environments are not interchangeable. They differ in the size of their associations with political identity strength, in whether those associations are statistically distinguishable from zero, and in which of the two outcomes they predict. Treating disagreement as a single, uniform form of exposure, as much of the existing literature implicitly does, obscures a more complicated pattern in which disagreement from periphery networks has the largest point estimates of both outcomes, core networks remain associated with identity strength but do not have the largest coefficients in these models, disagreement from affiliation networks predicts ideological strength but not partisan strength, and disagreement from social contexts predicts neither.
6.5 Results, hypothesis 2: aggregating disagreement across environments
Hypothesis 1 establishes that the four social environments are not interchangeable. Hypothesis 2 asks a different question: whether the disagreement a respondent encounters across those environments, taken together, accounts for variation in partisan and ideological strength that disagreement in core networks alone does not. Hypothesis 2a makes this claim for partisan strength, and Hypothesis 2b makes it for ideological strength. Both are motivated by the observation that the political behavior literature has most often measured disagreement through the core discussion network, and that this convention may miss a good deal of the disagreement people actually encounter.
To test the aggregation argument, we combine the four environment-specific measures into a single underlying dimension. An iterated principal factor analysis of the four disagreement measures yields a first factor on which all four environments load positively (see Table 2). Table 5 reports ordered logistic regression models that use this factor score as a key predictor of partisan attachment strength (Models 1 through 4) and ideological strength (Models 5 through 8) on the same 735 respondents analyzed in Table 4. Within each outcome, the first two columns report the core-only specification used by most of the existing literature, and the next two columns report the global disagreement factor model. Within each pair, the first column omits controls and the second adds the same battery of controls used in Table 4 (full model results available in Appendix D).
Core-only and global disagreement factor models of partisan and ideological strength

Table 5 Long description
The table presents ordered logistic regression models analyzing partisan and ideological strength. It includes eight models divided into two main sections: Partisan strength and Ideological strength. Each section has four models, with the first two columns showing core-only specifications and the next two columns showing global disagreement factor models. The table includes coefficients, standard errors, and an indicator showing whether controls are included. Key predictors include Core disagreement and Global disagreement factor, with their respective coefficients and standard errors listed. Threshold parameters cut1, cut2, and cut3 are reported with their standard errors. The table also provides AIC values and the difference in AIC compared to the core-only model. The number of observations (N) is consistently 735 across all models.
Notes: *** p < .001. For all disagreement measures, classifications that are neither Harris- nor Trump-aligned are excluded from the denominator, where applicable. Models with controls include discussion network size, sociality, affiliation network size, political interest dummies (very low interest as the reference category), female, age, white, less than college, and high social class. Coefficients on controls suppressed for readability.
Two results are central. First, the core-only specification is itself a reliable predictor of both outcomes. The core coefficient reaches p < 0.001 in every column, and disagreement from the core of a respondent’s political discussion network is consistently associated with weaker partisan and ideological attachment. This is consistent with existing findings. Second, and more directly relevant to the hypotheses under test, the global disagreement factor model improves on the core-only baseline in every comparison. For partisan strength, replacing the core-only measure with the global disagreement factor reduces the Akaike Information Criterion by 8.3 points without controls and by 16.7 points with controls. For ideological strength, the same substitution reduces the AIC by 19.9 points without controls and by 22.0 points with controls. By the conventional benchmark that a change in AIC of 10 or more constitutes strong evidence in favor of the better-fitting model (Burnham and Anderson, Reference Burnham and Anderson2004), the global disagreement factor provides strong evidence of improved fit for ideological strength and moderate evidence for partisan strength (see results in Appendix E). The aggregated measure captures variation in both outcomes that the core measure alone does not.Footnote 7
In substantive terms, restricting attention to disagreement from core networks captures less of the disagreement exposure relevant to the strength of partisan and ideological identification than a measure built from all four environments does. Taken together, the results show that these environments are distinct enough to warrant disaggregated attention (Hypothesis 1), but similar enough that aggregation recovers information missed by a core-only measure (Hypothesis 2).
Figures 4 and 5 translate the Table 5 coefficients into predicted probabilities. In both figures, the control variables are held at their observed mean for continuous variables and their mode for discrete variables, and the global disagreement factor is varied from two standard deviations below to two standard deviations above its mean.
Predicted probability of high and low partisan strength, by global disagreement.

Predicted probability of high and low ideological strength, by global disagreement.

Figure 4 plots the predicted probability that a respondent falls into the Independent category, the lowest level of partisan strength, and the Strong Democrat/Strong Republican category, the highest level of partisan strength, across the range of global disagreement. As global exposure to disagreement rises, the predicted probability of strong partisanship declines by about 0.33, roughly a third of the available range on the scale. This pattern is consistent with Hypothesis 2a because aggregating disagreement across environments captures variation in partisan strength that the core-only specification understates.
Figure 5 presents the parallel plot for ideological strength, comparing self-identified Moderates, the lowest level of ideological strength, to Extreme Liberals and Conservatives, the highest level of ideological strength, across the range of global disagreement. The movement is steeper than for partisan strength, consistent with the larger coefficient in Table 5. The predicted probability of extreme ideological self-placement declines by about 0.43 from the lowest to the highest levels of global disagreement, nearly half of the available range. At the high end of global disagreement, the predicted probabilities of the highest and lowest categories of ideological strength are roughly indistinguishable. This pattern is consistent with Hypothesis 2b. The combined disagreement an individual encounters across her social environments is associated with sizable differences in ideological strength.
6.6 Interaction between core and non-core environments
The analysis to this point treats the four environments as additive contributors to a single global disagreement factor. A natural next question is whether the environments also interact. One might reasonably expect that disagreement encountered in core networks matters more when it is reinforced by disagreement in the periphery, in voluntary affiliations, or in the broader social context. Alternatively, disagreement beyond the core might dampen the association between core disagreement and identity strength rather than amplify it. Either pattern would imply that the relationship between disagreement and attitude strength is conditional on the combination of environments a respondent occupies, not simply a function of the total disagreement encountered.
To test this possibility, we estimate six ordered logistic regression models, one for each pairing of the core discussion network with a non-core environment (periphery, affiliation, social context), separately for partisan and ideological strength. Each model interacts core disagreement with the relevant non-core measure and includes the same battery of controls used in the disaggregated models in Table 4, including core network size, sociality, number of organizations, political interest, gender, age, race, education, and income. Rather than restricting the sample to the 735 respondents with valid data on all four environments, we estimate each model on the largest available sample for that particular pairing, which preserves statistical power for the interaction test and avoids discarding respondents who are missing data on environments not involved in the model (see full model results in Appendix F).
As Ai and Norton (Reference Ai and Norton2003) show, the sign and statistical significance of an interaction coefficient in a nonlinear model can be misleading taken on its own. Following Brambor et al. (Reference Brambor, Clark and Golder2006), we interpret the interaction through the marginal association of core disagreement across the observed range of the non-core environment, rather than from the coefficient and its standard error alone. Table 6 reports the model coefficients.
Conditional relationships between disagreement across social environments and partisan and ideological strength

Table 6 Long description
Table 6 presents six interaction models, three for partisan strength and three for ideological strength. Each outcome includes separate core-by-periphery, core-by-affiliation, and core-by-social-context models. Rows report core disagreement, the relevant non-core disagreement measure, their interaction, controls, N, and AIC. Only the core-by-periphery interaction for ideological strength is statistically significant.
* p < .05, ** p < .01, *** p < .001.
Predicted probability of maximum partisan strength, by core and periphery disagreement.

Across the six models, five of the six interaction coefficients are statistically indistinguishable from zero. The exception is the core by periphery interaction for ideological strength (b = 1.83, SE = 0.86, p = 0.03 in Table 6, Model 4). Figures 6 and 7 present the predicted probabilities of the strongest partisan and ideological strength categories under the core by periphery interaction model, with both core and periphery disagreement varied across their observed minimum and maximum, using the fixed covariate profile used for the plotted margins. We do not present marginal-effect plots for the remaining interactions because their estimated interaction terms are statistically indistinguishable from zero, and the predicted probabilities add little beyond what the tables report.
Predicted probability of maximum ideological strength, by core and periphery disagreement.

Figure 6 shows that when core and periphery disagreement are both at their observed minimums, the predicted probability of identifying as a strong partisan is about 0.80. That probability falls to roughly 0.50 when core disagreement is at its minimum, but periphery disagreement is at its maximum. Whether the model predicts strong or weak partisan attachment depends on disagreement across both environments, not on core disagreement alone. Periphery disagreement is associated with weaker partisan attachment whether or not core disagreement is present. This pattern is consistent with Hypothesis 2a. Disagreement outside the core has its own association with identity strength.
Figure 7 shows the parallel pattern for ideological strength. When core and periphery disagreement are both at their minimum, the predicted probability of identifying as an extreme ideologue is about 0.50. That probability falls to under 0.20 when core disagreement is at its minimum and periphery disagreement is at its maximum. As core disagreement increases to its maximum, that probability falls sharply to about 0.15. When periphery disagreement is high, however, the predicted probability of the strongest ideological identification is already low (approximately 0.15), regardless of core disagreement. The two lines converge at high core disagreement, where both periphery conditions produce roughly the same predicted probability. This is the interaction for which the coefficient reaches conventional significance (p = .034), and the figure suggests that the association between core disagreement and ideological strength is conditional on periphery disagreement. When periphery disagreement is low, core disagreement has a large negative association with ideological strength. When periphery disagreement is high, that association is substantively weaker. This pattern is consistent with Hypothesis 2b because disagreement beyond the core is associated with weaker ideological attachments independent of what occurs in the core network.
Taken together, the results support both hypotheses.Footnote 8 The disaggregated models in Table 4 show that the four environments are not interchangeable. They differ in the size of their associations with partisan and ideological strength. In these specifications, periphery networks have the largest point estimates, but we do not treat those estimates as statistically distinguishable from the core network estimates. The aggregated models in Table 5 show that the global disagreement factor improves on the core only specification for both outcomes. The core periphery interaction models suggest that periphery disagreement is associated with weaker partisan and ideological attachments even when core disagreement is low, with the clearest conditional pattern appearing for ideological strength. The four social environments differ enough from one another to warrant disaggregated attention, and they share enough common variance for a single aggregated measure to recover information that the core-only convention does not. The cumulative disagreement an individual encounters across the broader set of environments is associated with the strength of her partisan and ideological identities in ways that the core only measurement strategy that has dominated much of the literature, does not capture.
7. Discussion and conclusion
Much of the survey-based social influence literature has measured political disagreement through the core discussion network, treating it as a sufficient window onto the political social world. This study asked whether that convention misses something. Consider again the two individuals described in the introduction, one embedded in a homogeneous core network and surrounded by cross-cutting disagreement in her periphery, affiliations, and community, and another embedded in the same homogeneous core network but also in politically like-minded environments at every other level. A core network only measurement strategy would treat these individuals as equivalent with respect to disagreement exposure, even though their broader social environments differ sharply.
The paper posed two complementary tests of this claim. Hypothesis 1 asked whether the association between disagreement and identity strength differs across four social environments when all are entered simultaneously. Hypothesis 2 asked whether an aggregated measure of disagreement built from all four environments explains variation in partisan and ideological strength that a core-only model does not. Both hypotheses are supported, and the findings reinforce rather than compete with one another.
Hypothesis 1 receives direct support. When all four environment-specific measures are entered simultaneously, their coefficients differ in size, in sign stability, and in whether they are statistically distinguishable from zero. The most striking result is the role of periphery networks. Disagreement encountered among the broader set of acquaintances with whom respondents discuss politics less frequently than their closest ties has the largest point estimate in each specification and remains statistically significant after controls are added. We do not interpret those coefficient differences as evidence that periphery disagreement is statistically distinguishable from core disagreement, but the pattern is substantively important. This finding complicates the emphasis in much prior work on core discussion partners as a central site of politically relevant disagreement exposure (Huckfeldt et al., Reference Huckfeldt, Johnson and Sprague2004; Mutz, Reference Mutz2006). The periphery result is consistent with Granovetter’s (Reference Granovetter1973) insight that weak ties serve as bridges across otherwise closed social clusters, potentially exposing individuals to political perspectives that are less common in their closest relationships. If weak ties are the primary channel through which novel political information enters an individual’s social world, the broader acquaintance network may be an especially important site of disagreement exposure.
The remaining two environments tell a more selective story. Disagreement within voluntary affiliations is associated with lower ideological strength but bears no detectable relationship to partisan strength, while residential social context is indistinguishable from zero for both outcomes. We do not detect an association between variation in respondents’ residential social context and the strength of their partisan or ideological attachments once the other environments are accounted for.
The Hypothesis 2 results do not contradict this finding. Despite the differences across environments, they share enough common variance for a single aggregated measure to recover information about disagreement exposure that the core-only convention does not capture. The contribution is therefore both substantive and methodological. Disaggregated models show how the association between disagreement and identity strength varies across environments, while the aggregated model shows that a core only measure leaves out information that is related to both outcomes.
Across both outcomes, the associations between disagreement and identity strength are larger for ideological strength than for partisan strength. We note this pattern but are cautious about explaining why it occurs. One possibility is that partisan identification, as a deep social identity with strong group-based reinforcement (Green et al., Reference Green, Palmquist and Schickler2004), is more resistant to the cross-pressures that disagreement exposure represents. Ideological positions, while increasingly identity-laden (Mason, Reference Mason2018), may rest on somewhat thinner psychological foundations for many citizens (Kinder and Kalmoe, Reference Kinder and Kalmoe2017) and are less socially visible in everyday interaction (Converse, Reference Converse1964), potentially making them more responsive to disagreement. But our data do not allow us to distinguish among these explanations. The pattern is consistent with several mechanisms, and establishing which ones are operative will require research designs that can isolate the relevant pathways.
The interaction models offer only limited evidence that the environments shape associations with identity strength. Five of the six interaction terms are statistically indistinguishable from zero. The exception is the core by periphery interaction for ideological strength, which is conventionally significant. The predicted probabilities in Figures 6 and 7 help clarify this pattern. For partisan strength, periphery disagreement is associated with a lower predicted probability of strong partisanship even when core disagreement is low, but the interaction term is not statistically distinguishable from zero. For ideological strength, where the core by periphery interaction is significant, the association between core disagreement and ideological strength is strongest when periphery disagreement is low and weaker when periphery disagreement is high. Put differently, the evidence does not support a broad claim that the environments consistently condition one another across outcomes. It does suggest, more narrowly, that disagreement in the broader acquaintance network is associated with partisan and ideological strength in ways that are not fully captured by core network disagreement alone.
Several limitations warrant discussion. Most important, the evidence presented here is cross-sectional and observational. The associations we report are not causal estimates. Individuals who hold weaker partisan or ideological attachments may select into more politically heterogeneous social environments, rather than the reverse. Disentangling selection from influence remains a central challenge for research on political disagreement, and our design cannot resolve it (Lyons, Reference Lyons2011). We have been careful throughout to describe our findings as associations, and we encourage readers to interpret them in that light. The same limitation applies to the timing of exposure. Our data provide a snapshot of disagreement across environments, not a record of how those environments change or influence one another over time. Whether disagreement in one environment spills over into others, whether individuals compensate for disagreement in one environment by seeking agreement in another, and whether the associations we report are stable across electoral cycles are questions for longitudinal and panel designs.
Second, our measure of global disagreement is limited to interpersonal social environments and does not incorporate media exposure. Other forms of disagreement, whether encountered through traditional media or social media platforms, may also relate to the strength of partisan and ideological attachments (Settle, Reference Settle2018). Earlier evidence suggested that interpersonal contexts mattered more than media exposure for political behavior (Beck et al., Reference Beck, Dalton, Greene and Huckfeldt2002), but that work predates the fragmentation and nationalization of political media (Darr et al., Reference Darr, Hitt and Dunaway2018; Hopkins, Reference Hopkins2018) and the rise of platforms that blur the boundary between interpersonal and mass communication (Settle, Reference Settle2018). Future work should examine how media-based disagreement exposure relates to the interpersonal disagreement we measure here.
These limitations notwithstanding, the central pattern is clear. Measuring political disagreement through the core discussion network alone captures less of the variation in partisan and ideological strength than a measure built from a fuller set of social environments in which Americans encounter political disagreement. Periphery disagreement has the largest associations with both outcomes in these models, although we do not treat those coefficient differences as evidence that the periphery is statistically distinguishable from the core. The core by periphery models further suggest that periphery disagreement may shape how core disagreement is associated with ideological strength. The four environments, while sharing enough common structure to support a single latent factor, differ meaningfully in which outcomes they are associated with and how strongly. As social and geographic sorting continues to reshape the composition of Americans’ social environments (Bishop, Reference Bishop2008; Brown and Enos, Reference Brown and Enos2021; Mason, Reference Mason2018), understanding the full landscape of disagreement exposure, not just the slice visible in core discussion networks, will be important for understanding the strength and stability of political identities in the United States.
Data availability statement
Anonymized data relevant to replication will be made available upon publication.
Acknowledgements
The authors would like to thank the Political Networks section of the American Political Science Association for organizing this special issue. We would also like to thank Janet Box-Steffensmeier, Cassy Dorff, Matthew Pietryka, and Anand Sokhey for their very helpful comments on earlier drafts of this paper.
Supplementary material
The supplementary material for this article can be found at https://doi.org/10.1017/nws.2026.10045.
Financial support
This work received support from the Institute for Humane Studies under grant no. IHS018713.
Competing interests
None.
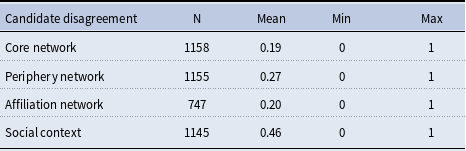
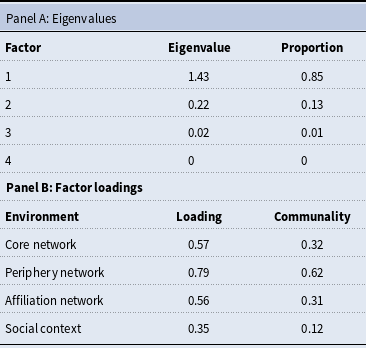

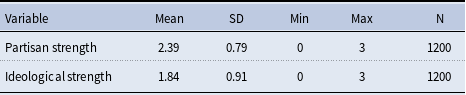
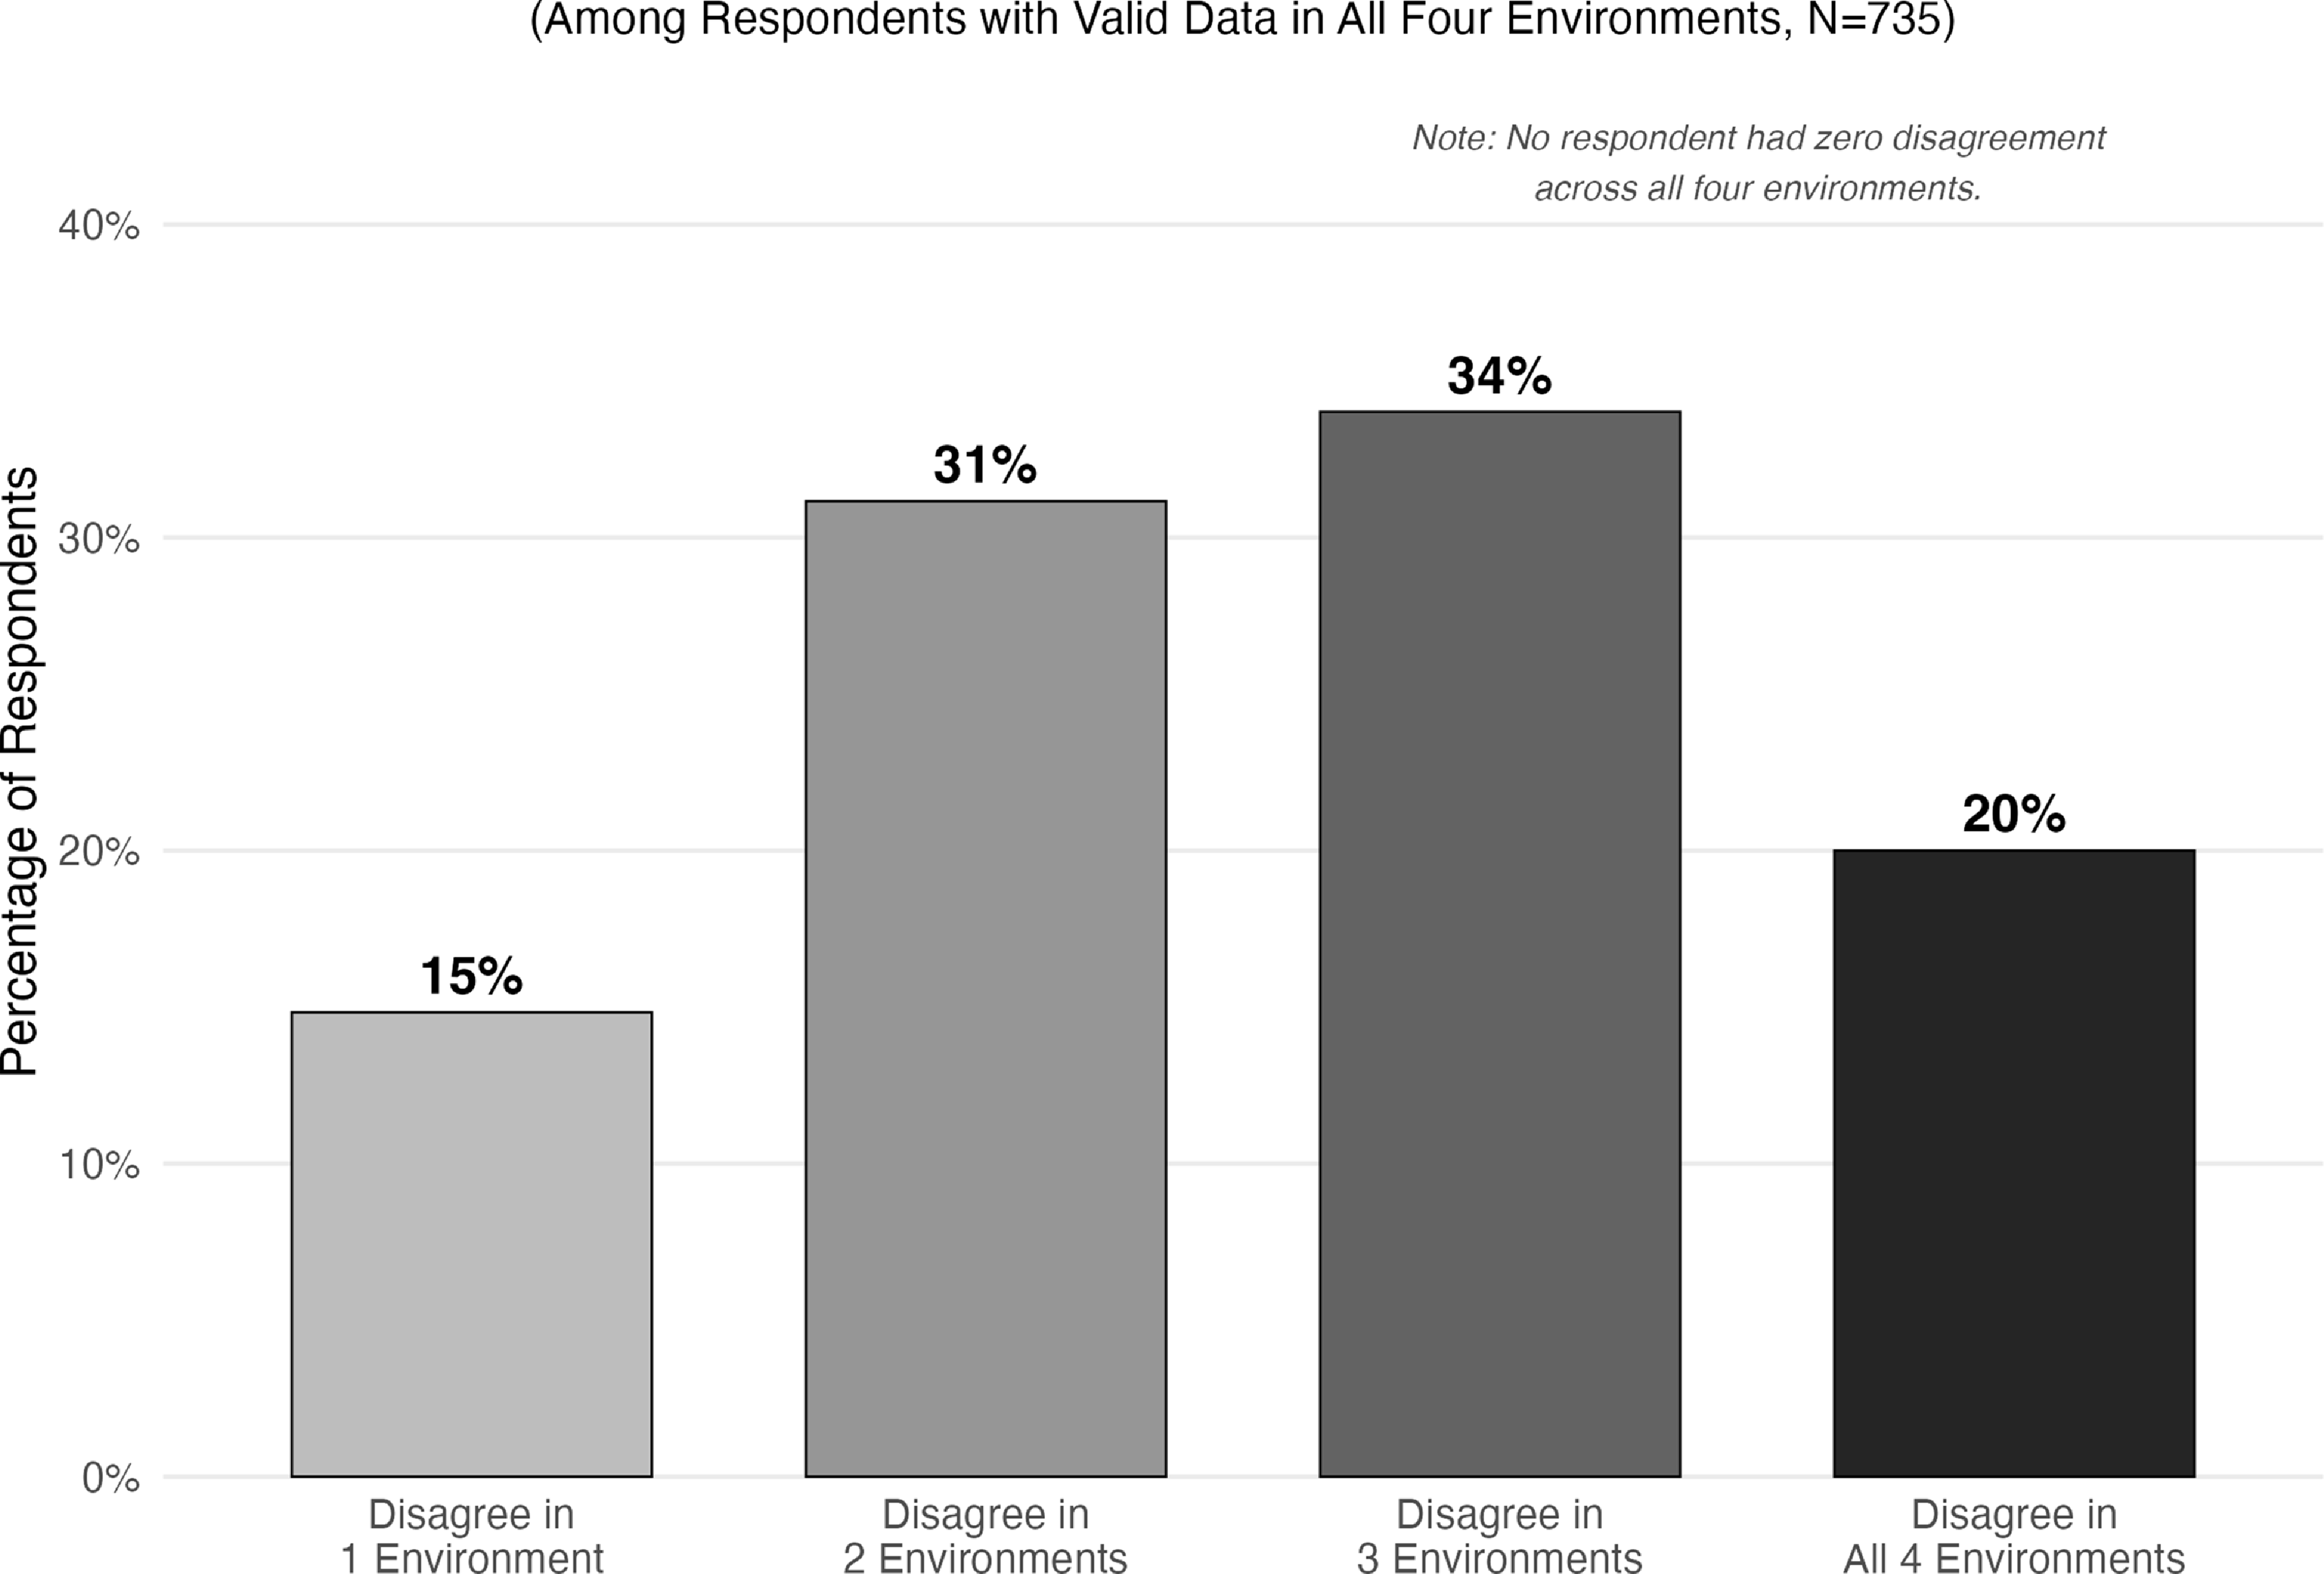

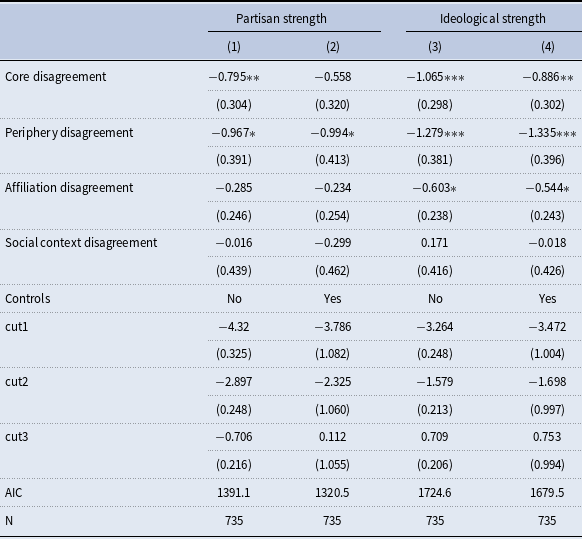
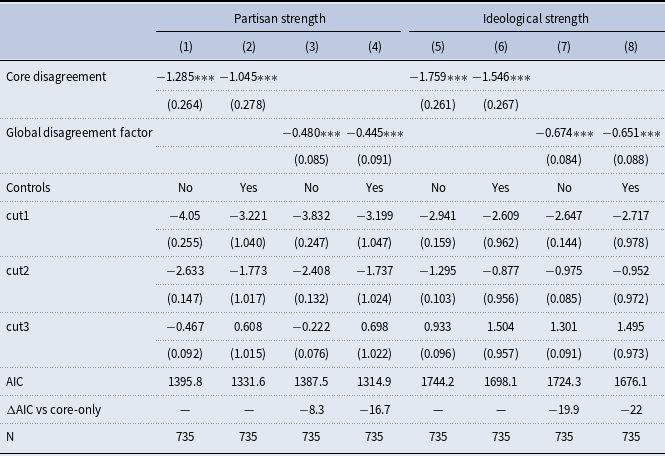


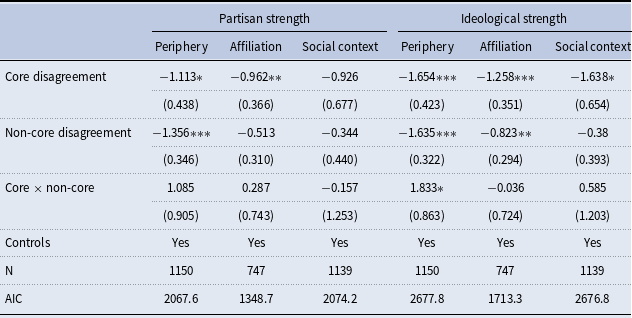


 Open access

