Introduction
Parasites can impose large selective forces on host organisms; however, the specific fitness consequences are often variable among individual hosts as well as host species (Allander and Bennett, Reference Allander and Bennett1995; Merino et al. Reference Merino, Moreno, Sanz and Arriero2000; Marzal et al. Reference Marzal, Bensch, Reviriego, Balbontin and de Lope2008; Knowles et al. Reference Knowles, Palinauskas and Sheldon2010; Martínez-de la Puente et al. Reference Martínez-de la Puente, Merino, Tomas, Moreno, Morales, Lobato, Garcia-Fraile and Belda2010; Grillo et al. Reference Grillo, Fithian, Cross, Wallace, Viverette, Reilly and Mayer2012; Zylberberg et al. Reference Zylberberg, Derryberry, Breuner, Macdougall-Shackleton, Cornelius and Hahn2015). Haemoproteus, a haemosporidian within the Apicomplexa phylum, is a common malaria parasite that infects a variety of avian families globally (Pérez-Tris et al. Reference Pérez-Tris, Hasselquist, Hellgren, Krizanauskiene, Wald- enstro m̈ and S2005; Valkiūnas, Reference Valkiūnas2005). Early acute infections of Haemoproteus tend to be severe; subsequent, chronic infections are more benign and re-emerge during periods of increased probability of transmission by vector hosts, i.e. spring and summer months (Atkinson and Van Riper, Reference Atkinson, Van Riper, Loye and Zuk1991; Super and van Riper, Reference Super and van Riper1995). Thus, Haemoproteus infection prevalence and intensity is known to vary seasonally and between years (Worms, Reference Worms, Canning and Wright1972; Bensch et al. Reference Bensch, Waldenström, Jonzén, Westerdahl, Hansson, Sejberg and Hasselquist2007; Podmokła et al. Reference Podmokła, Dubiec, Drobniak, Arct, Gustafsson and Cichoń2014), with higher prevalence and intensity during the vector-rich months of summer and early autumn and lower prevalence and intensity during winter due to parasite dormancy within avian host tissues (Atkinson and Van Riper, Reference Atkinson, Van Riper, Loye and Zuk1991).
In addition to higher vector abundance, parasite infection intensities are thought to be higher in the summer months due to trade-offs driven by higher levels of glucocorticoids and/or androgens, which can decrease immune investment and increase haemoparasitic infection, as observed in dark-eyed juncos (Junco hyemalis) (Casto et al. Reference Casto, Nolan and Ketterson2001; Deviche and Parris, Reference Deviche and Parris2006) and house sparrows (Passer domesticus) (Greenman et al. Reference Greenman, Martin Ii and Hau2005). Additionally, it has been hypothesized that reproductive behaviours, such as singing from elevated, exposed perches may also increase exposure to insect vectors and thus likelihood of infection (Deviche et al. Reference Deviche, Greiner and Manteca2001). The strength of host immune defences against the parasite (Knowles et al. Reference Knowles, Nakagawa and Sheldon2009; Sorci, Reference Sorci2013) and the blood-feeding arthropods that transmit them (Andrade et al. Reference Andrade, Teixeira, Barral and Barral-Netto2005; Leitner et al. Reference Leitner, Wali and Cotero-Saint Denis2013; Waite et al. Reference Waite, Henry, Owen and Clayton2014) contribute to variation in parasite infection intensities within individuals. Thus, any reduction in immunity leaves individuals less resistant to both new and re-emerging haemoparasitic infection and with more intense infections overall (Gustafsson et al. Reference Gustafsson, Nordling, Andersson, Sheldon and Qvarnström1994; Allander, Reference Allander1997; Casto et al. Reference Casto, Nolan and Ketterson2001; Martin et al. Reference Martin, Weil and Nelson2008; Cornelius et al. Reference Cornelius, Zylberberg, Breuner, Gleiss and Hahn2014), but see (Deviche et al. Reference Deviche, Fokidis, Lerbour and Greiner2010).
The changes in avian physiology associated with reproductive activation of the hypothalamic–pituitary–gonadal axis (androgens, oestrogens, gonadotropins) are also hypothesized to act as an endogenous cue for the timing of re-emergence (prevalence) of dormant parasites present in the host. The relationship between higher circulating hormone levels and parasite emergence, however, is tenuous at best (Buttemer and Astheimer, Reference Buttemer and Astheimer2000), as evidenced in bird species that do not constrain reproduction to summer months, e.g. red crossbills (Loxia curvirostra) (Cornelius et al. Reference Cornelius, Zylberberg, Breuner, Gleiss and Hahn2014) and white-winged crossbills (Loxia leucoptera) (Deviche et al. Reference Deviche, Fokidis, Lerbour and Greiner2010), but still exhibit typical seasonal shifts in parasite abundance. Alternatively, it has been suggested that parasites may use other physiological changes that occur directly in response to changes in day length to time re-emergence (e.g. melatonin or other endogenous cues) (Valkiunas et al. Reference Valkiunas, Bairlein, Iezhova and Dolnik2004; Cornelius et al. Reference Cornelius, Zylberberg, Breuner, Gleiss and Hahn2014; Schultz, unpublished results).
Intense or chronic Haemoproteus infections can have negative fitness consequences in some bird species (Knowles et al. Reference Knowles, Palinauskas and Sheldon2010; Martínez-de la Puente et al. Reference Martínez-de la Puente, Merino, Tomas, Moreno, Morales, Lobato, Garcia-Fraile and Belda2010; Asghar et al. Reference Asghar, Hasselquist, Hansson, Zehtindjiev, Westerdahl and Bensch2015; but see Zylberberg et al. Reference Zylberberg, Derryberry, Breuner, Macdougall-Shackleton, Cornelius and Hahn2015; Podmokla et al. Reference Podmokla, Dubiec, Drobniak, Sudyka, Krupski, Arct, Gustafsson and Cichon2017), which highlights the importance of understanding how different factors contribute to parasite infection prevalence and intensity. Currently, it is difficult to determine which combination of factors (i.e. fluctuations in vector abundance that may also vary in response to environmental conditions, reproductive trade-offs and/or immune status) have the greatest effect on parasite infection intensity within individuals because most studies focus on species that confine reproduction to times of year when vector abundance remains high.
Red crossbills provide an ideal model in which to examine predictors of Haemoproteus infection intensity due to their unique ecology. Crossbills are morphologically specialized to extract seeds from conifer cones (Adkisson, Reference Adkisson1996), an erratically available food resource both in space and time (Fowells, Reference Fowells1968; Koenig and Knops, Reference Koenig and Knops2000). Because of the unpredictable nature of their food resource, crossbills will migrate nomadically and irruptively to locate areas with good cone crops (Adkisson, Reference Adkisson1996). Once located, good cone crops can allow breeding 9 months of the year under a wide range of environmental conditions (Benkman, Reference Benkman1987, Reference Benkman1990; Hahn, Reference Hahn1998), both within and outside the time period of peak vector abundance and parasite prevalence.
Building on previous work done on crossbill species by Cornelius et al. (Reference Cornelius, Zylberberg, Breuner, Gleiss and Hahn2014) and Deviche et al. (Reference Deviche, Fokidis, Lerbour and Greiner2010), we examined how fluctuations in red crossbill Haemoproteus infection prevalence and intensity across multiple seasons and years are related to environmental effects and/or competing physiological investments in an environment characterized by large seasonal fluctuations in day length, temperature, precipitation, food availability and vector prevalence. Specifically, we used daily ambient temperature and precipitation levels, and host food availability to quantify environmental effects and five measures of immune function (complement and natural antibody activity, microbial killing ability, haptoglobin concentration and leucocyte counts), reproductive condition [using cloacal protuberance (CP) size and brood patch (BP) appearance] and plumage molt intensity as measures of physiological investment. We predicted that environmental fluctuations would affect parasite prevalence and intensity by affecting (1) vector abundance and thus the likelihood of transmission and (2) crossbill physiology (e.g. benign environmental conditions reduce trade-offs between reproduction and immunity and thus higher maintained immunity results in lower parasite loads). Although we cannot directly test the first prediction using our data, we test it indirectly given that temperature and precipitation levels often predict insect vector abundance (e.g. Golding et al. Reference Golding, Nunn and Purse2015).
Materials and methods
We captured 343 free-living red crossbills from 2010 to 2013 in the Grand Teton National Park, in Jackson Hole, WY, USA (43°45′N, 110°39′W). No individual crossbills were recaptured. There are ten described vocal ‘types’ or ecomorphs of red crossbills that are grouped based on body size and bill morphology (Groth, Reference Groth1993; Benkman, Reference Benkman2003; Irwin, Reference Irwin2010). These morphological differences among types suit them best to foraging on specific conifer taxa in which foraging efficiency is maximized (Benkman, Reference Benkman1993, Reference Benkman2003; Groth, Reference Groth1993). Of the ten vocal types, the four call types most commonly found in the Grand Teton National Park are types 2 (large birds), 3 (small birds), 4 (medium-sized birds) and 5 (large birds) (Kelsey, Reference Kelsey2008; see Groth, Reference Groth1993). In general, the vocal types are more often found in areas where their ‘key conifer’ (cf. Benkman, Reference Benkman1993) is abundant, but there is some flexibility in habitat use among types. In the Grand Teton National Park, type 5s are present every year primarily due to the abundance of Lodgepole pine (Pinus contorta) which produce cones every year (Burns and Honkala, Reference Burns and Honkala1990). In response to large cone crops on Douglas-fir (Pseudotsuga menziesii) and Blue and Engelmann spruce (Picea pungens; Picea engelmannii), types 2, 3 and 4 will periodically invade the area (Kelsey, Reference Kelsey2008). In this study, we examined parasite prevalence and intensity data from the four vocal types 2, 3, 4 and 5: type 2: n = 35, type 3: n = 14, type 4: n = 30, type 5: n = 248, unknown type: n = 16 (birds of unknown type did not give flight calls when released, and therefore could not be identified positively).
Crossbills were captured with mist-nets and sexed and aged using plumage and skull characteristics described in (Pyle, Reference Pyle1997). Blood samples (approximately 300 µL individual−1) were taken between 07:00 and 20:00 h via the brachial vein using a 26-gauge needle, with a median elapsed time from capture to sample of 3.73 min, and a maximum elapsed time of 60 min. Samples were kept on ice prior to centrifuging where plasma was separated from cellular components and immediately stored at −20 °C until immune assays were performed. For those crossbills caught in the summers of 2012 and 2013, we swabbed the brachial vein with an alcohol prep-pad prior to blood collection into sterilized, heparinized microhaematocrit capillary tubes. These sterile tubes were used for the microbial killing assay, detailed below. Haematocrit was measured in all birds except birds from the summer of 2010 by centrifuging blood in capillary tubes for 10 min at 10 000 RPM in an IEC clinical centrifuge with a haematocrit head and measuring per cent packed cell volume. Individual haematocrit scores were based on the average haematocrit scores from approximately five capillary tubes. All capture and handling protocols were approved by the University of California Davis Institutional Animal Care and Use Committee (protocol number: 16729).
Measures of condition
Tarsometatarsus was measured using dial calipers by compressing the entire section of leg from ankle (foot closed and held at 90°) between the caliper jaws and measuring the base of the metatarsals. We calculated body condition by performing a linear regression of mass (measured to the nearest 0.1 g using a Pesola spring scale) by tarsus length and comparing residuals.
Reproductive measures
To assess reproductive potential, we measured CP length and BP stage on males and females, respectively, using criteria previously described in (Cornelius et al. Reference Cornelius, Breuner and Hahn2012). CP length and BP scores >0 are correlated with testes length and ovary condition in male and female crossbills, respectively (Cornelius et al. Reference Cornelius, Breuner and Hahn2012).
Plumage molt intensity
We assessed both primary feather and contour (body) molt intensity in all birds using methodology previously described in (Cornelius et al. Reference Cornelius, Perfito, Zann, Breuner and Hahn2011). Briefly, we defined primary molt intensity as the number of primary feathers actively growing and scored body molt intensity on an arbitrary scale of 0–3, with 0 being no actively growing feathers and 3 being heavy molt (many actively growing feathers on multiple feather tracts).
Cone crop (food availability assessment)/‘cone year’
To evaluate the availability of conifers serving as major crossbill food sources in the Grand Teton National Park (Lodgepole pine, Douglas-fir, Engelmann spruce and Blue spruce), one experienced observer (TPH) visited 12 different long-term, point-count sites between early July and early September 2010–2013. At each site, 10–20 individual trees present within 50 m of the survey point (Kelsey, Reference Kelsey2008) were scored for new, developing cones using a cone abundance index (USFS 1994), which ranges from 0 to 5 (0 = zero cones and 5 = large number of cones on cone-bearing section of the tree). The abundance of conifer seeds is generally highest during summer and early autumn when the cones are ripe and opening, and lowest in winter and spring due to cone opening and seed loss through predation or harsh weather conditions (Burns and Honkala, Reference Burns and Honkala1990). We define a ‘cone year’ as the time between approximately June 1 of one year (when the cones are developing) and the subsequent spring when old cones are depleted and/or the new cones are developing.
Local weather conditions (precipitation and daily max/min temperature)
For each day of bird capture, we accessed 24 h precipitation amounts (mm) and daily maximum and minimum temperature (degrees Celsius) from the National Oceanic & Atmospheric Administration (NOAA) National Climate Data Centre website, using stations MOOSE 1 NNE, WY, USA (elevation: 1970.84 m, latitude: 43.662°N, longitude: 110.712°W) or MORAN 5 WNW, WY, USA (elevation: 2072 m, latitude: 43.85°N, longitude: 110.6°W) depending on capture site, which on average were 2.36 km and a maximum of 16.87 km away, except for five birds that were captured at a more distant site (Phillip's Pass), 20.90 km away from the Moose weather station.
Immune assays
In this study, we quantified five measures of immune function: (1) plasma complement, (2) plasma natural antibodies, (3) microbial killing ability of blood, (4) plasma haptoglobin (PIT54) concentration and (5) leucocyte counts.
To measure complement and natural antibodies from the plasma, we used the protocol described in (Matson et al. Reference Matson, Ricklefs and Klasing2005) and made modifications for small blood volumes described in (Schultz et al. Reference Schultz, Hahn and Klasing2017). Samples were run in five batches: the first in December 2010, the second in December 2011, the third in May 2012, the fourth in October 2012 and the fifth in June 2014. The average inter-plate variation (standard deviation) was 0.28 lysis titres and 0.09 agglutination titres.
To quantify Escherichia coli (ATCC 8739) and Candida albicans (ATCC 10231) killing ability, we used the protocol described in (Millet et al. Reference Millet, Bennett, Lee, Hau and Klasing2007) using fresh, whole blood taken within 5 min of the bird hitting the net and processed within 30 min of collection. We measured microbial-killing ability only from birds captured in the summers of 2012 (n = 49) and 2013 (n = 7).
To quantify PIT54 plasma concentrations, we used a commercially available colorimetric assay kit (TP801; Tri-Delta Diagnostics, NJ, USA) (Millet et al. Reference Millet, Bennett, Lee, Hau and Klasing2007) and made modifications for small blood volumes previously described in (Schultz et al. Reference Schultz, Hahn and Klasing2017). Due to low plasma volumes collected during the summer of 2010, we did not measure haptoglobin values from these samples.
To identify and quantify the number and type of leucocytes present, a drop of blood collected from a baseline sample was placed onto each glass slide, and spread in a thin layer by drawing it out using the clean edge of another slide, allowed to air-dry, fixed with 100% methanol and stained with Wright–Giemsa (Cambridge Diagnostic Camco Stain Pack). Smears were examined for number of leucocytes under 1000 × magnification with oil immersion. For each slide, we identified and counted the number of lymphocytes, heterophils, monocytes, eosinophils and basophils, using methods described in (Campbell, Reference Campbell1995) across 100 microscope ‘fields’ which contained approximately 100 erythrocytes per field. The fields examined were counted evenly across the slide's surface to prevent oversampling. We report the number of leucocytes per (mL) of blood by multiplying haematocrit volume (%) by the proportion of leucocytes per erythrocytes to account for variation in individual and seasonal variation in haematocrit. All slides except for those collected in the summer of 2012 were scored by one observer (EMS).
To detect blood parasites infection, we quantified the number of erythrocytes infected with Haemoproteus spp., Leukocytozoon spp., and Plasmodium spp. using morphological characteristics outlined in Campbell (Reference Campbell1995); however, only Haemoproteus spp. infections were detected, thus we only report the number of erythrocytes infected with Haemoproteus spp. The red crossbills in this study were likely infected with Haemoproteus tartakovskyi based on DNA that was extracted from 437 red crossbills of vocal types 2, 3, 4 and 5 captured in 21 locations throughout Washington, Oregon, California and the Teton Mountain Range of Wyoming from 2003 to 2012. This species accounted for 72% of all Haemoproteus infections (Lovett, Reference Lovett2016). The remaining 28% of infections were due to a single lineage (PYERY01) that has not been identified at this time. Importantly, there was no difference in the prevalence of these two Haemoproteus species by vocal type or geographic region sampled. Given that the red crossbills in our study were also vocal types 2, 3, 4 and 5 and were sampled from the same study sites within the Teton Mountain Range of Wyoming from 2010 to 2013, it is likely that the red crossbills sampled in our study were infected predominantly by H. tartakovskyi, with some infections due to the other unidentified lineage of Haemoproteus. When determining Haemoproteus infection status (or prevalence), we assigned individuals a 0 or 1 score, 0: no signs of Haemoproteus infection, and 1: any signs of Haemoproteus infection (Bush et al. Reference Bush, Lafferty, Lotz and Shostak1997). When determining Haemoproteus intensity among infected individuals (i.e. individuals with a ‘1’ infection status), we calculated the severity of infection by calculating the proportion of erythrocytes infected/not infected (Bush et al. Reference Bush, Lafferty, Lotz and Shostak1997).
Statistical analyses
Data were analysed in R (version 3.1.1) (R Core Team, 2016) using generalized linear and generalized linear mixed models (GLM, GLMMs, respectively) via glm and glmer from the lme4 package (version 1.1-7-1.1-12). Overall, we used GLMs to analyse the effects of environmental variables (annual cone crop scores of conifers, daily precipitation, maximum and minimum temperatures and their interactions), physiological variables (CP length/BP score, number of primary feathers molting, and body molt score and their interactions) and other measures (age, sex, vocal type) on Haemoproteus infection prevalence and intensity. The distribution of parasite infection status and intensity were fit using a binomial (0 = no Haemoproteus detected, 1 = any Haemoproteus detected) and log-normal error distribution, respectively. Because many of these variables vary seasonally and our sampling was unbalanced among years, we tested whether including a random effect of date, season and year, or year improved the models. Including a random effect of season and year significantly improved non-environmental models predicting Haemoproteus prevalence but not intensity.
For each of the model families, we created and compared a series of models using Akaike's Information Criterion for small sample sizes (AICc) and calculated Akaike weights (ω ι) (Burnham and Anderson, Reference Burnham and Anderson2002). For each model family set, we compared null models (intercepts only) to those models that contained predictive variables as both main and interactive effects. We considered models with a ΔAICc < 2 from the lowest model score to be statistically supported or equivalent (Richards, Reference Richards2005). We calculated regression coefficients, standard errors and 95% confidence limits using the summary function in the base package (v. 3.1.1) and the confint function in the stat package (v. 3.1.1) to determine the effect and precision of each predictor. When confidence intervals (CIs) included zero, the parameter estimates were considered statistically non-significant and interpreted to have minimal effect on the parasite parameters. Additionally, we compared models that included capture location, time of day and the amount of time elapsed between capture and blood sampling to account for unintended variation due to these measures, as advised by (Zylberberg, Reference Zylberberg2015); however, models containing these variables had low AICcω ι and did not significantly affect outcomes.
We did not compare model families when determining the relationship between each immune measure and parasite prevalence and intensity due to unequal sample sizes among immune parameters which would have produced inaccurate AICc values, i.e. smaller sample sizes would receive lower AICc scores regardless of actual predictive power (Burnham and Anderson, Reference Burnham and Anderson2002). Instead, we analysed each of the immune parameters separately by using GLMMs (with a random effect of season and year) and GLMs to predict parasite prevalence and intensity, respectively.
The list of generalized linear and generalized linear mixed models ranked by AICc score and model parameter estimates from best-supported models are included in Tables 1–5.
List of generalized linear and linear mixed models predicting Haemoproteus infection status (parasite prevalence) ranked in order of lowest to highest AICc score, grouped by model family

Model estimates and 95% confidence intervals for top model predicting Haemoproteus infection status (parasite prevalence)

Estimates relative to summer 2010 refer to predicted difference in Haemoproteus infection status by season and year.
Model estimates (A) and odds ratios (B) for top models predicting Haemoproteus infection status (parasite prevalence)

Odds ratio refers to increase/decrease change in odds associated with one unit change of each variable.
a Indicates estimates and 95% confidence intervals calculated based on averaging of equivalent top models.
List of generalized linear and linear mixed models predicting Haemoproteus infection intensity ranked in order of lowest to highest AICc score, grouped by model family

Model estimates for averageda top models predicting Haemoproteus infection intensity

Results
Interannual and seasonal variation in infection status (parasite prevalence)
The prevalence of Haemoproteus infection varied between and within years: 50% of individuals sampled in the summer of 2010 (15/30) exhibited Haemoproteus infection, 61% in summer 2011 (33/54), 20% in fall 2011 (2/10), 9% in winter 2012 (7/79), 29% in spring 2012 (8/28), 18% in summer 2012 (15/84) and 27% in summer 2013 (3/11) (Fig 1A and B). Additionally, season and year were included in a top model (Table 1: AICcω ι = 1, ΔAICc = 10.7), with parameter estimates supporting these data (Table 2).
Variation in parasite prevalence (% of individuals caught infected by Haemoproteus) by year (A) and by season (B). Numbers indicate total number of individuals scored per season for Haemoproteus.

Interannual and seasonal variation in infection intensity
While date was included in a top model predicting parasite infection intensity among infected individuals (Table 4: AICcω ι = 0.694, ΔAICc = 3.0), infection intensity fluctuated by season and year, but this variation was only significant among seasons (Fig. 2, Table 5). Specifically, infection intensity did not significantly vary when comparing summers 2010, 2011, 2012 and 2013; however, 2013 had lower mean intensities than 2010, 2011 and 2012 (Fig. 2A). There was seasonal variation in infection intensity among infected individuals, which was higher in the summer (mean intensity 1.40, s.e. = 0.25), lower in fall (intensity = 0.11, n = 1 infected individual) and winter (mean 0.05, s.e. = 0.02), and moderately elevated in early spring (mean 0.30, s.e. = 0.18) (Fig. 2B).
Inter (A) and (B) intra-annual variation in parasite intensity among infected individuals. Inter-annual variation in scores as indicated by blood samples collected between June 23–August 30, 2011 (summer 11), July 2–September 12, 2012 (summer 12) and July 6–August 10, 2013 (summer 13). Intra-annual variation in parasite density as indicated by blood samples collected between June 23–August 30, 2011 (summer 11), October 25–30, 2011 (fall 11), March 1–11, 2012 (winter 12) and May 3–9 2012 (spring 12). Bars indicate standard errors, numbers indicate sample size.

Relationship between immune parameters and parasite infection status and intensity
None of the immune parameters measured were significantly related to parasite prevalence or infection status (CIs surrounding parameter estimate included zero, data not shown). Leucocytes counts, however, were positively related to infection intensity, whereas natural antibodies (agglutination scores), complement-mediated lysis, microbial killing ability and PIT54 concentrations were not significantly related to intensity. Among infected individuals, leucocyte counts (Fig. 3, estimate: 0.89, 95% CI 0.07–1.71) were also higher.
Plot of best-fit line demonstrating relationship between Haemoproteus infection intensity (per cent erythrocytes infected) and leucocyte counts per blood volume. The black line represents the fitted relationship between the two variables in GLM model. The shaded grey represent the 95% confidence intervals around the predicted value. Model structure: infection intensity ~ leucocytes per blood volume, estimate: 0.89, 95% CI 0.07–1.71. No haematocrit data were collected from individuals caught in summer 2010.

Relationship between measures of condition and parasite infection status and intensity
We examined two measures of condition: individual mean haematocrit scores (for all birds except those caught in 2010) and mass-tarsus length residuals. Overall, haematocrit did not vary significantly by season or year (models containing year or season were outperformed by null models). There was no relationship between haematocrit and parasite infection prevalence or intensity (prevalence: GLMM, estimate: 0.05, CI −0.04 to 0.14; intensity: GLM, estimate: 0.02, CI −0.01 to 0.06), nor with mass-tarsus length residuals (GLM, estimate: −0.11, CI −0.23 to 0.02).
Environmental correlates of parasite infection status and intensity
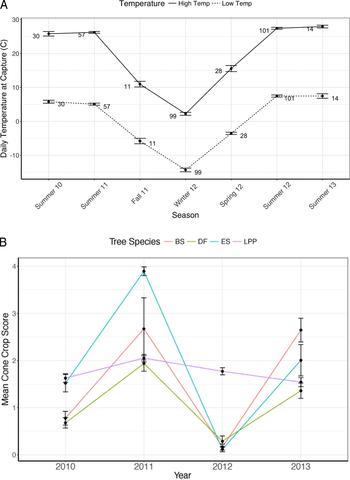
Models that contained ambient temperature, annual cone crop scores and an interaction between the two variables were weighted the highest (Table 1, infection status: AICcω ι = 0.55, ΔAICc = 0.4; Table 4, infection intensity: AICcω ι = 0.3165, ΔAICc = 0.9). Models containing maximum and minimum daily temperature that had a ΔAICc < 2 were averaged together (Tables 1 and 4). Based on confidence limits around the regression coefficients, only the interaction between minimum daily temperature and mean cone crop scores was positively related to parasite infection status or prevalence (Table 3A; CIs did not include zero). Converting parameter estimates to odds ratios revealed that higher temperatures and cone crop scores increase the probability of parasite infection (Table 3B). Although minimum daily temperature and mean cone crop score were contained in top models explaining variation in parasite infection intensity, none of the parameter estimates were significant (Table 5, CIs included zero). Collectively, these results indicate that Haemoproteus prevalence is more likely to be higher in years with larger cone crops and times of year with higher ambient temperatures (Fig. 4).
Daily and annual fluctuations in temperature (A) and cone crop scores (B). (A) The mean ±s.e.m. high and low temperature (°C) was the high and low temperature recorded the day of capture. Numbers indicate sample size. (B) Mean cone crop score by ‘cone year’, by conifer species in the Grand Teton National Park. s.e.m. calculated based on 20 cone surveys conducted in summer of the reported year. BS, Blue Spruce; DF, Douglas-fir; ES, Engelmann Spruce; LPP; Lodgepole pine.

Effects of vocal type (ecomorph), age, sex and parasite infection status and intensity
Vocal type (ecomorph), age and sex were included in a best-supported model predicting parasite prevalence when controlling for seasonal effects (Table 1, AICcω ι = 0.946, ΔAICc = 5.7); however, only age and vocal type had significant effects based on the confidence limits around the regression coefficient (Table 3A). Specifically, birds that were vocal type 4 had higher rates of infection than vocal types 2, 3 and 5. Additionally, hatch-year (HY) birds had lower rates of infection than after-hatch-year (AHY) birds (Table 3A, Figs 5 and 6, respectively). Similarly, odds ratios revealed that HY birds had a lower probability of infection (Table 3B). Although sex was included in a best-supported model as a main effect, the CIs surrounding the estimate included zero (Table 3A). Vocal type was also included in a best-supported model predicting parasite intensity (Table 4, AICcω ι = 0.503, ΔAICc = 1.2); however, the ΔAICc between this model and the null model was <2 and thus it was considered statistically equivalent and had minimal effects on parasite intensity.
Variation in Haemoproteus prevalence by crossbill vocal type. Sample sizes and s.e.m. given. Vocal type 4 had significantly higher parasite prevalence than other vocal types (GLMM, type 4 estimate: 2.17, 95% CI 1.10–3.24).

Variation in Haemoproteus prevalence by crossbill age. AHY, after hatch year; HY, hatch year. Sample sizes and s.e.m. given. HY birds had significantly lower parasite prevalence than AHY birds (GLMM, HY estimate: −1.30, 95% CI −2.10 to −0.50).

Effects of plumage molt intensity and reproductive investment
The number of flight feathers molting or ‘molt intensity’ and reproductive investment (quantified by CP length and BP score) were included in best-supported models as main and interactive effects predicting parasite prevalence (Table 1, AICcω ι = 0.677, ΔAICc = 2.1). Model parameter main-effect estimates indicated that birds with either higher flight feather molt intensity or reproductive investment had lower rates of parasite infection, while interaction-effect estimates indicated that individuals with both higher molt intensity and reproductive investment had higher rates of parasite infection (Table 3A). However, model parameter estimates and CIs for these effects and their interactions included zero and were not considered to be significant (Table 3A). Similarly, odds ratios indicated that individuals with higher molt intensity and reproductive investment had higher probability of infection (Table 3B).
Reproductive investment, flight feather and body molt intensity, and their interactions were included in best-supported models predicting parasite infection intensity (Table 4, top two models were averaged because ΔAICc was <2). Model estimates and CIs for these effects and their interactions included zero and thus were not considered to have significant effects (Table 5).
Discussion
In this study, we examined environmental and/or physiological predictors of parasite infection status (or prevalence) and intensity by measuring the number of erythrocytes infected with Haemoproteus spp. in red crossbills caught at several times of year (2010–2013) in the Grand Teton National Park, Wyoming. In addition to examining potential environmental and physiological effects, we assessed whether age, sex or crossbill vocal type (types 2, 3, 4, 5) had effects on parasite infection status and intensity.
Interannual and seasonal variation in Haemoproteus prevalence and intensity
While infection prevalence was higher in the summer, there was variation across summers sampled: 2010 and 2011 had significantly higher prevalence than 2012 and 2013 (Fig. 1A). Infection intensities also varied annually but not significantly, with lower overall intensities in 2013 than in 2010, 2011 and 2012 (Fig. 2A). The likelihood of parasite infection and the infection intensity also exhibited seasonal variation. Both were highest in the summer when comparing data across one year (2011–2012) and lower in fall and winter (Figs 1B and 2B). Lower prevalence and intensity in fall and winter likely corresponds to parasite dormancy within crossbill tissues and clearance of previous infections. Parasite infection prevalence and intensity increased in early spring and was likely due to a combination of old infection relapses and new infections (Atkinson and Van Riper, Reference Atkinson, Van Riper, Loye and Zuk1991) (Figs 1B and 2B). This summer peak in parasite infection intensity has been found in other studies (e.g. Atkinson and Van Riper, Reference Atkinson, Van Riper, Loye and Zuk1991; Cornelius et al. Reference Cornelius, Zylberberg, Breuner, Gleiss and Hahn2014).
Innate immune function and parasite infection intensity
While the immune parameters measured were not related to parasite prevalence, leucocyte concentration relative to haematocrit blood volume was positively related to parasite infection intensity (Fig. 3), suggesting that crossbills with higher parasite loads have higher white blood cell counts which is not due to decreased red blood cell volume caused by Haemoproteus infection. Immune activity, specifically leucocytes and complement, was found to be higher overall among crossbills caught during the summer (Schultz, Reference Schultz2015), a trend that is consistent with the ‘breeding season-high exposure’ hypothesis (Hasselquist, Reference Hasselquist2007). This hypothesis predicts that an enhancement of immune indices in the summer months is the result of both re-emergence of existing parasites and exposure or re-exposure to new infections by vectors. Overall, it is difficult to determine whether immune activity increases as a direct result of the parasites or in preparation for this predictable annual increase in infection because this dataset is limited to independent rather than repeated sampling of individuals.
In response to a malaria infection, the immune system first induces inflammation by releasing cytotoxic compounds followed by the production of antibodies (Sorci, Reference Sorci2013). Domestic canaries (Serinus canaria) experimentally infected with Plasmodium had higher haptoglobin concentrations than those not infected (Cellier-Holzem et al. Reference Cellier-Holzem, Esparza-Salas, Garnier and Sorci2010); however, haptoglobin concentration was not higher among crossbills infected with Haemoproteus perhaps suggesting that Plasmodium and Haemoproteus may affect haptoglobin differently. The acute phase protein PIT54 (the avian functional analogue to haptoglobin) increases within hours during an inflammatory response to an infection but returns to baseline once the inflammatory phase has been resolved (Klasing, Reference Klasing2004). This rapid production of acute phase proteins is nutritionally expensive to the animal during its response to the infection (Schmid-Hempel and Ebert, Reference Schmid-Hempel and Ebert2003; Klasing, Reference Klasing2004; Lee, Reference Lee2006). In contrast, the nutritional costs of production and deployment of most leucocytes (phagocytic cells, granulocytes) is thought to be relatively low (reviewed in Lee, Reference Lee2006), though some lymphocytes, such as B and T cells (Janeway et al. Reference Janeway, Travers, Walport and Shlomchik2004), have relatively high developmental and use costs (Lee, Reference Lee2006). In response to infection, organisms must consider the costs and benefits of investing in certain components of the immune system, particularly the more costly and damaging inflammatory response. For this reason, during periods of higher infection prevalence and intensity (e.g. summer 2010, 2011), crossbills should favour less costly or potentially damaging forms of immunity in order to combat frequent infection (i.e. via leucocytosis).
Further, optimal balance between costs and benefits of an immune response may not always favour complete clearance of an infection. It might be more beneficial for an organism to decrease infection levels to a manageable level (tolerance) that minimally decreases fitness rather than eliminating the infection entirely, potentially at greater immunopathology costs (resistance) (Raberg et al. Reference Raberg, Sim and Read2007). With this dataset, it is difficult to determine whether crossbills with higher parasite loads and higher immune investment in less costly components are more tolerant (birds with higher parasite loads do not have lower fitness than those with lower parasite loads) or whether these birds were sampled in the middle of their immune system's attempt to eliminate the parasites entirely, which would require subsequent sampling to detect. Finally, the individuals sampled could be experiencing their first or second bout of infection, which tend to be lower intensity than later infections (Cellier-Holzem et al. Reference Cellier-Holzem, Esparza-Salas, Garnier and Sorci2010). Haematocrit or red blood cell volume has been used in previous studies as a proxy for the potential fitness costs incurred by infection (Sorci, Reference Sorci2013). In this study – and in agreement with Cornelius et al. Reference Cornelius, Zylberberg, Breuner, Gleiss and Hahn2014 – there was no relationship between haematocrit and parasite intensity or prevalence in crossbills, nor with mass-tarsus length residuals (another correlate of condition), suggesting that crossbills with higher parasitaemia are not necessarily experiencing strong negative fitness costs.
Environmental correlates of Haemoproteus prevalence
Our data show that higher ambient temperature and larger annual cone crop scores are related to higher likelihood of Haemoproteus infection. This result suggests that years with more abundant food resources and days with warmer temperatures tend to see more birds infected with Haemoproteus. These environmental variables are likely having multiple effects: (1) larger cone crops provide more food for crossbills, which attracts crossbills of multiple vocal types into the area (Hahn, Reference Hahn1998; Kelsey, Reference Kelsey2008), some potentially with higher parasite infection rates (see below, Fig. 5); (2) larger cone crops increase the reproductive rate of crossbills, which in turn could impact infection susceptibility and intensity (see below); and (3) vectors are more prevalent in warmer weather (Atkinson and Van Riper, Reference Atkinson, Van Riper, Loye and Zuk1991; Super and van Riper, Reference Super and van Riper1995). The summers of 2010 and 2011 had the highest proportion of infected individuals (Fig. 1A), although cone crops were lower in summer 2010 and higher in 2011 (Fig. 4).
Temperature, particularly minimum temperature, was related to parasitaemia, a trend that was also supported in white-winged crossbill populations (Deviche et al. Reference Deviche, Fokidis, Lerbour and Greiner2010). While daily average precipitation was not related to parasite prevalence in this dataset, 2011 had higher total precipitation recorded earlier in the year (January 1–May 30, Fig. 7) which positively affects mosquito (Anopheles plumbeus) abundance (i.e. more standing water results in more proliferation) (Golding et al. Reference Golding, Nunn and Purse2015; Ibanez-Justicia and Cianci, Reference Ibanez-Justicia and Cianci2015). To our knowledge, no study has specifically identified the vectors that transmit Haemoproteus to crossbills (Deviche et al. Reference Deviche, Fokidis, Lerbour and Greiner2010), but the likely candidates are blackflies (Simulium species) and biting midges (Culicoides species), both of which lay eggs in standing water (McAlpine, Reference McAlpine1981). It is worth noting, however, that some of the between-year variation in crossbill parasitaemia could be the result of sampling different populations, i.e. the populations of crossbills caught in the summers of 2010 and 2011 had higher parasitaemia than those sampled in subsequent summers. To truly test whether or not these environmental variables significantly affected infection intensities, multiple captures from the same individuals across different years would be required.
(A) Total snow fall (±s.e.m. of months January 1–May 31 of the given year), (B) total snow depth (±s.e.m. of months January 1–May 31 of the given year), and (C) total precipitation (±s.e.m. of months January 1–May 31 of the given year). The year 2011 had significantly higher total precipitation in the months January through the end of May than other years; GLM: 2011 estimate: 4.11 95% CI 1.99–6.24.

Haemoproteus prevalence different among crossbill vocal (eco) types
There was a significant difference in crossbill vocal type parasite prevalence levels, with type 4s having significantly higher parasite prevalence than types 2, 3 and 5. In this study, we cannot determine the precise origin of the type 4 crossbills captured in the Grand Teton National Park that might explain their higher Haemoproteus prevalence. However, type 4 crossbills are most prevalent in the Pacific Northwest (Adkisson, Reference Adkisson1996; Kelsey, Reference Kelsey2008) and the warmer, wetter conditions there could lead to higher vector activity and thereby higher overall prevalence than in the Rocky Mountain Region (see Cornelius et al. Reference Cornelius, Zylberberg, Breuner, Gleiss and Hahn2014). Additionally, it is possible – though not probable – that type 4 individuals were infected by a currently uncharacterized species of Haemoproteus that has higher overall prevalence. Haemoproteus infection intensity, however, did not significantly vary by vocal type. Similarly, Cornelius et al. (Reference Cornelius, Zylberberg, Breuner, Gleiss and Hahn2014) found no difference in infection intensity among types 3, 4 and 5 in the Grand Teton region specifically – although type 3s had much higher infection intensities in coastal regions.
Effects of age and sex on Haemoproteus prevalence and infection intensity
Previously published work examining the effects of age and sex on parasite infection intensity is inconsistent, with some studies finding significant differences (e.g. Zuk and McKean, Reference Zuk and McKean1996; Deviche et al. Reference Deviche, Fokidis, Lerbour and Greiner2010) and others none (e.g. Ricklefs et al. Reference Ricklefs, Swanson, Fallon, Martínez-Abraín, Scheuerlein, Gray and Latta2005; Latta and Ricklefs, Reference Latta and Ricklefs2010; Fecchio et al. Reference Fecchio, Lima, Silveira, Ribas, Caparroz and Marini2015; Granthon and Williams, Reference Granthon and Williams2017). Similar to the latter studies, neither age (AHY or HY) nor sex had significant effects on parasite infection intensity in red crossbills in this study, which may be due to more or less equal distribution of infection intensities among birds exhibiting symptoms of Haemoproteus infection (Norte et al. Reference Norte, Araujo, Sampaio, Sousa and Ramos2009). Age did however have a significant effect on parasite prevalence, with HY birds being less likely to be infected with Haemoproteus (Fig. 6). Parasite prevalence is thought to be lower in juveniles because they are typically born after vectors have emerged, creating a time lag between parasite colonization and actual detection of infection (Deviche et al. Reference Deviche, Fokidis, Lerbour and Greiner2010; Cornelius et al. Reference Cornelius, Zylberberg, Breuner, Gleiss and Hahn2014). However, crossbill juveniles born in the late winter or spring would experience vector emergence and thus should exhibit higher infection intensities but would not exhibit the spring relapse of previous infections as older adults would (Cornelius et al. Reference Cornelius, Zylberberg, Breuner, Gleiss and Hahn2014). Juvenile crossbills born in winter/spring were not differentiated from those born in summer in this study (they were all categorized as HY), which could contribute to the inability to detect differences in parasite infection intensity between age classes.
No effects of reproductive investment or molt on Haemoproteus prevalence or intensity
Reproductive investment and plumage molt intensity did not significantly affect parasite prevalence or intensity. However, our measures of reproductive investment, CP length and BP score, provide a very coarse assessment of total reproductive investment or cost. Although CP length and BP score are correlated with testes length and ovary condition in crossbills (Cornelius et al. Reference Cornelius, Breuner and Hahn2012), these measures are not quantifying total reproductive cost incurred during egg laying, incubation and feeding nestlings, which are energetically demanding in birds (Monaghan and Nager, Reference Monaghan and Nager1997). Despite this limitation, other studies have also found minimal effects of reproductive condition (using CP lengths and BP scores) on parasite infection intensity and immune function in red crossbills (Cornelius et al. Reference Cornelius, Zylberberg, Breuner, Gleiss and Hahn2014) and parasite prevalence in collared flycatchers (Ficedula albicollis) (Szollosi et al. Reference Szollosi, Garamszegi, Hegyi, Laczi, Rosivall and Torok2016). However, plasma testosterone (which was not measured in this study) has been shown to negatively covary with parasite intensity in red crossbills (Cornelius et al. Reference Cornelius, Zylberberg, Breuner, Gleiss and Hahn2014), but not white-winged crossbills (Deviche et al. Reference Deviche, Fokidis, Lerbour and Greiner2010). Because crossbill plumage molt may not be as demanding as it is in other bird species, due to their ability to arrest molt during summer breeding and protract a relatively slow molt across several months (Hahn, Reference Hahn1995; Adkisson, Reference Adkisson1996; Cornelius et al. Reference Cornelius, Perfito, Zann, Breuner and Hahn2011), it is not entirely surprising that molt intensity had little effect on parasite prevalence and intensity.
Conclusions
In this study, parasite prevalence in red crossbills varied seasonally and across years, with the highest number of infected individuals occurring in the summer, although there was considerable variation across summers sampled. This can be partially attributed to variation in annual mean cone crop sizes and daily ambient temperature. Parasite intensity was significantly related to one measure of immunity: leucocytosis. Neither crossbill age, vocal type, nor sex significantly impacted parasite infection intensity; however, parasite prevalence did significantly vary among vocal types and age classes. Considering these results together, it is probable that a combination of physiological (specifically immune activity) and environmental factors (specifically host food availability and ambient temperature) affect parasite prevalence and infection intensity in crossbills and other bird species, either by directly affecting host physiology or indirectly by affecting vector abundance.
Acknowledgements
This study would not have been possible without the help of SE Knox, DZ Jaul, RE Koch, C Lopez, and V Iseri. We would like to thank the UW-NPS Research Station and the Murie Center for providing housing and support during field collection. The state of Wyoming, Grand Teton National Park, and Mary Lohuis provided access to netting sites. Finally, we would like to thank two anonymous reviewers for their comments that improved the manuscript.
Financial Support
Many thanks to the funding and support from the University of Wyoming and National Park Service; NSF grant 0744705 to TPH, and NSF Graduate Research Fellowship; grants from Sigma Xi; Society for Integrative and Comparative Biology; and the American Ornithologists’ Union to EMS.