Implications
The sulphur hexafluoride (SF6) tracer technique is a method of choice to estimate individual methane (CH4) emissions from large groups of animals under production conditions such as grazing. However, the CH4 emissions estimates appear related to the SF6 release rate (RR) in the rumen. This suggests the need to use permeation tubes with a small range in RR in animal experiments, and that the RR is balanced across treatments. The performance of the SF6 tracer technique to estimate CH4 emissions from ruminants diminishes with the increase of SF6 RR in the rumen.
Introduction
The production of greenhouse gases (GHG) from livestock and their impact on climate changes are a major concern worldwide (Gill et al., Reference Gill, Smith and Wilkinson2010). In their review, Martin et al. (Reference Martin, Doreau and Morgavi2010) reported that enteric methane (CH4) is the most important GHG emitted (50% to 60%) at the farm scale in ruminant production systems. The sulphur hexafluoride (SF6) tracer technique (Johnson et al., Reference Johnson, Huyler, Westberg, Lamb and Zimmerman1994) is the method of choice in all situations where simultaneous estimations of individual CH4 emissions on large number of free ranging animals are required (Clark et al., Reference Clark, Pinares-Patiño and deKlein2005). Most comparative studies show that mean estimates of CH4 production using the SF6 technique are not statistically different from those obtained using calorimetric methods (e.g. Boadi et al., Reference Boadi, Wittenberg and Kennedy2002; McGinn et al., Reference McGinn, Beauchemin, Iwassa and McAllister2006; Grainger et al., Reference Grainger, Clarke, McGinn, Auldist, Beauchemin, Hannah MC Waghorn, Clark and Eckard2007; Johnson et al., Reference Johnson, Westberg, Michal and Cossalman2007) or using the micrometeorological technique (Leuning et al., Reference Leuning, Baker, Jamie, Hsu, Klein, Denmead and Griffith1999). The tracer technique relies on the release of a known quantity of SF6 tracer gas from a pre-calibrated permeation tube inserted into the reticulo-rumen, and the CH4/SF6 ratio of concentrations (above the background air) on the representative breath samples collected from the tested animal. Recent studies reported a positive relationship between the pre-calibrated release rate (RR) of SF6 and the estimated CH4 emissions on cattle (Vlaming et al., Reference Vlaming, Brookes, Hoskin, Pinares-Patiño and Clark2007; Pinares-Patiño et al., Reference Pinares-Patiño, Machmüller, Molano, Smith, Vlaming and Clark2008b). This could suggest that the stability of permeation tubes at high rates is not as robust as lower rates, and/or that the molar proportion of SF6 in the breath sample, relative to that of CH4, decreases as the RR of SF6 in the rumen increases. As gas-mixing processes within the rumen headspace, as well as during eructation, are highly turbulent, it would not be expected that such mixing could discriminate between CH4 and the nine-fold heavier SF6 molecules (Johnson et al., Reference Johnson, Westberg, Michal and Cossalman2007). Alternatively, it can be hypothesised that the SF6 gas released in the reticulum or the ventral sac of the rumen, where the permeation tube sits, does not reach the ruminal headspace gas pool available for eructation. A loss of the tracer to the lower digestive tract with the liquid and/or the solid fraction of the ruminal content, by absorption through the ruminal wall, and/or by ‘trapping’ within the rumen, might be implicated in a systematic lower abundance of SF6 (relative to that of CH4) in the breath sample. This study explored the above hypothesis by comparing ratios of the concentration of fermentation gases (CH4 and CO2) and SF6, and estimated volumes of CH4 and CO2 in the samples collected from the rumen gas headspace and from the breath of cows deployed with permeation tubes with low RR (LRR) and high RR (HRR) of SF6.
Material and methods
The experiment was conducted at the animal experimental facilities of the INRA's Herbivores Research Unit (Saint-Genès-Champanelle, France). Procedures on animals were in accordance with the guidelines for animal research of the French Ministry of Agriculture and all other applicable national and European guidelines and regulations for experimentation with animals (see http://www2.vet-lyon.fr/ens/expa/acc_regl.html for details).
Animals, experimental design and diets
Six non-lactating Holstein cows fitted with a ruminal cannula (made of polyvinyl chloride (PVC) and polyamide, 120 mm internal diameter, Synthesia, Nogent-sur-Marne, France) were used in this experiment. The surgery had been performed aseptically at least 1 year before the experiment, under general anaesthesia using halothane (ICI Pharma, Paris, France).
Animals were used in a crossover design consisting of two treatments (rates of release of the SF6 tracer, RR) and two periods during which gas measurements were carried out. Ruminal cannulae were equipped with stoppers, allowing collection of rumen gas headspace samples (hereafter referred as ‘ruminal samples’) without having to open the cannula (Jouany and Senaud, Reference Jouany and Senaud1979). Ruminal liquid and gas leakages throughout the fistula were minimised by fitting an inner rubber tube around it. No visual leakages have been postponed during the experiment. The study involved 21 days adaptation, which was followed by an 18-day experimental period (days 1 to 18). Gas measurements were carried over days 1 to 3 and 16 to 18.
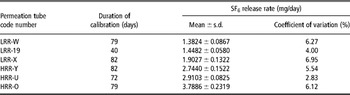
The cows were randomly allocated into two groups (three animals each) balanced for live weight (average 816 ± 101 and 832 ± 56 kg for groups A and B, respectively). Each group was allocated to permeation tubes with either LRR (1.577 ± 0.283 mg/day) or HRR (3.147 ± 0.561 mg/day) of SF6 in the first period, and the permeation tubes were swapped between groups in the second period. Permeation tubes were introduced in the rumen 5 days before each gas measurement period. Brass permeation tubes (12.5 mm × 40 mm) were charged with 733 ± 6 mg and calibrated by regular weighing (two times a week) for a 10-week period on average while they were kept in an Erlenmeyer glass in 39°C water bath. Coefficients of variation of the SF6 RR estimated during the period of calibration were similar between the LRR and HRR tubes (Table 1). Before each gas collection period, the calibrated permeation tubes were dosed via fistula into the reticulum of the cows 7 days earlier and retrieved at the end of each measurement period. To find permeation tubes easily in the rumen, they were tied at the end of a twine measuring 1 m, and the other end of the twine being fixed to the ruminal cannula. Between the two periods of gas measurement, the permeation tubes were kept in the laboratory in the same conditions as during the calibration period. The concentration of the residual SF6 in the rumen before switching the tubes for the second period of gas measurement was determined. It averaged 19.4 ± 9.4 ppt and represented less than 0.1% of the SF6 concentration detected in the rumen loaded with permeation tubes during the first period of gas measurement.
Characteristics of individual SF6 permeation tubes used in this experiment

LRR = low release rate; HRR = high release rate.
Animals were individually fed a 100% maize silage diet obtained from a single batch and were supplemented (180 g/day) with a commercial mineral–vitamin premix (Galaphos Midi Duo GR, CCPA, Aurillac, France) and with bicarbonate (140 g/day). Feed allowance was ad libitum during the adaptation period, and then was restricted to 80% of ad libitum intake during the experimental period to ensure no refusals. Daily feed allowance was split into two meals delivered at 0800 and 1600 h. The amount of feed delivered during the morning and afternoon feedings were, respectively, 40% and 60% of the daily feed allowance. Drinking water was available ad libitum. Animals were kept in individual stalls in a barn (30 000 m3 of volume). Ventilation of the barn was a natural ventilation system with side- (shutters) and ridge tile-opening.
Feed intake
Dry matter intake (DMI) was measured twice daily at 0800 and 1600 h throughout the experiment. Maize silage dry matter (DM) content was measured at 103°C for 24 h, and its chemical composition (crude protein, NDF, starch and gross energy) was determined on pooled samples taken daily on the gas measurement periods after drying (60°C for 48 h) and grinding (0.8-mm screen). Analytical methods used for determination of maize silage chemical composition were as described by Martin et al. (Reference Martin, Rouel, Jouany, Doreau and Chilliard2008). The maize silage contained 285 g DM/kg, 233 g starch, 74 g crude protein, 442 g NDF and 18.5 MJ gross energy/kg DM.
Gas collection and analyses
At each experimental period, breath and ruminal gases were simultaneously collected during 3 consecutive days. Both breath and ruminal gas samples were collected over an 8-h period beginning just before the morning feeding and ending just before the afternoon feeding.
Breath samples
Breath samples from each animal were continuously collected into pre-evacuated (−0.9 atm) yoke-shaped PVC collection devices (∼2.5 l). Sample flow was set by means of capillary and Teflon tubing calibrated for a gas collection period of 8 h, and fitted to a halter as described by Martin et al. (Reference Martin, Rouel, Jouany, Doreau and Chilliard2008). Samples of background air inside the barn were also collected over the same period. Collections of both breath and background samples were stopped at 1600 h just before the afternoon feeding and collection devices were immediately transported to the laboratory where they were over-pressured with N2 gas (∼1.4 atm) and analysed for concentrations of SF6, CH4 and CO2.
Ruminal gas samples
On each animal, ruminal gas samples were collected before the morning feeding and at 1-h intervals following the feeding (i.e. nine samples per cow). At each sampling time, 50 ml of gas was collected from the rumen headspace gas (dorsal sac) using a plastic syringe (one per sample) on standing animals to avoid contamination with ruminal juice as described by Jouany and Senaud (Reference Jouany and Senaud1979). Gas samples were immediately sub-sampled into two vacutainer tubes of 10 ml without additives (red cap; VT-100SU; Terumo Europe N.V. 3001 Leuven, Belgium) and transported to the laboratory. Ruminal gas samples were diluted with N2 gas (1/200 to 1/300 vol/vol) to obtain gas concentrations within the range of concentration of the standards. Because of varying dilution rates of samples, comparisons between treatments (LRR v. HRR) and sampling sites (breath v. ruminal) were based on ratios of gas concentrations rather than on their specific concentrations.
Gas analyses
Concentrations of SF6, CH4 and CO2 in the breath, ruminal and background air samples were determined using gas chromatography as described by Martin et al. (Reference Martin, Rouel, Jouany, Doreau and Chilliard2008). A gas chromatograph (Varian-Chrompack, CP-9003, Les Ulis, France) fitted with electron capture detector was used to determine concentrations of SF6, whereas another gas chromatograph (Perkin Elmer instruments; Autosystem XL, Courtaboeuf, France) fitted with a flame ionisation and a thermal conductivity detector, was used to determine the concentrations of CH4 and CO2, respectively. For determination of SF6, the samples were run on the chromatograph using a Molecular Sieve 0.5 nm column (3 m × 3.2 mm internal diameter) at 50°C, whereas a Porapack N 80–100 mesh column (3 m × 3.2 mm internal diameter) maintained at 40°C was used for determination of CH4 and CO2. The carrier gas used for determination of SF6 was N2 (30 ml/min), whereas He (40 ml/min) was used as carrier for CH4 and CO2. Chromatographic analyses were performed after calibration with standard gases (Air Liquide, Mitry-Mory, France) for SF6 (55 and 195 ppt), CH4 (100 ppm) and CO2 (1490 ppm).
Data calculation and statistical analysis
Data calculation
Ruminal gas samples were uniformly spaced in time separated by a period of 1 h. Ruminal concentrations of SF6, CH4 and CO2 of each 1-h period were estimated by averaging their concentrations from gas samples taken at two consecutive time points, and then were used to calculate the ratios of concentrations (CH4/SF6 and CO2/SF6). Subsequently, these ratios in conjunction with the known RR of SF6 were used to estimate the hourly emissions of CH4 and CO2 arising into the rumen gas headspace. The total ruminal emissions of CH4 and CO2 over the 8-h sampling period were obtained by adding their estimates of hourly emissions.
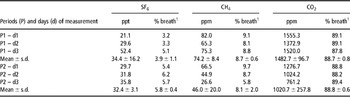
The 8-h period breath emissions of CH4 and CO2 were calculated using the net concentrations of SF6, CH4 and CO2 in the breath samples (i.e. subtracting background air concentrations reported in Table 2). Both the hourly emissions of CH4 and CO2 in the rumen, and the emissions of CH4 and CO2 in the breath over the 8-h period, were calculated according to Johnson et al. (Reference Johnson, Huyler, Westberg, Lamb and Zimmerman1994):




Concentration of tracer gas (SF6), methane (CH4) and carbon dioxide (CO2) in ambient air of the barn across days and periods of measurement

1Expressed as % of gas concentration detected in the breath gas samples of the cows (n = 6).
Statistical analysis
The statistical software GenStat 10th edition (Payne et al., Reference Payne, Murray, Harding, Baird and Soutar2007) was used to analyse the gas and ratio data with analysis of variance (ANOVA). The model comprised emission source (S: breath or rumen), RR (high or low), S × RR as fixed effects, and cow, period, cow × period, period × day, cow × period × day as random effects. Data were analysed as a 2-period crossover design, where RR was the crossover treatment and was tested against the period-within-cow variability, whereas S and SS × R were tested against day-within-period-within-cow variability. DMI during the 8-h gas measurement period was used as a covariate only for those measurements for which it explained a significant portion of the variability as assessed from the ANOVA. The nature of the relationship between CO2/CH4 ratios and DMI differed for breath and rumen sources, and thus it was not possible to incorporate DMI as a covariate in a combined ANOVA; therefore, the CO2/CH4 ratios data from the two sources were analysed separately.
The gas and ratio time-trend data for the rumen emissions measured over the 8-h period were analysed using repeated measurements of ANOVA, with the same block structure as above, to compare the two RRs of SF6.
Means for each combination of RR and emission source were presented together with least significant difference. Most of the gas and ratios data had variances that tended to increase with the mean; this meant that a log transformation had to be applied to the data before analysis in order to stabilise the variance. In such cases, log-transformed and back-transformed means were presented.
Results
Feed intake
The mean feed intake during the 8-h gas measurement period was 2.94 ± 0.49 kg DM per cow. Because feeding level was fixed and restricted, feed intake did not differ (P > 0.05) between LRR and HRR treatments (data not shown).
Post-feeding kinetics of ruminal gas concentration ratios and emissions
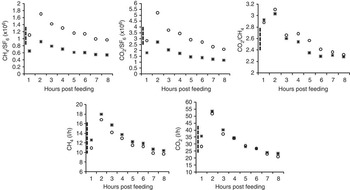
Ruminal post-feeding kinetics of the different gas concentration ratios (CH4/SF6, CO2/SF6 CO2/CH4) and of the hourly gas production (CH4 and CO2) for the two RRs of SF6 tracer are presented in Figure 1. No interaction effect of sampling time × RR treatment (P > 0.05) was observed for these parameters (data not shown). Irrespective of the post-feeding hour, both CH4/SF6 and CO2/SF6 ratios of gas concentrations were higher (P < 0.01) for the LRR treatment than for the HRR, whereas the CO2/CH4 ratio did not differ (P > 0.05) between LRR and HRR. Through the entire period of sample collection, the estimated hourly ruminal emissions of CH4 were numerically higher (P > 0.05) for the HRR than for the LRR treatment (Figure 1). The estimated hourly emissions of ruminal CO2 showed a similar post-feeding pattern to that of CH4 without difference between the two RR treatments, except towards the start of the 8-h sampling period where values were numerically higher for HRR than for LRR.
Post feeding kinetics of gas concentration ratios and estimated hourly productions of CH4 and CO2 based on gases sampled from the rumen headspace with low (LRR, o) and high (HRR, ▪) release rates of SF6. Dashes bars represent approximate LSD (5%).

Ruminal v. breath gas sampling
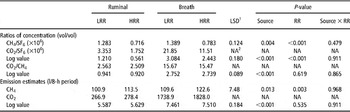
The mean ratios of gas concentrations and estimated emissions of CH4 and CO2 over the 8-h sampling period for ruminal and breath sampling sources are presented in Table 3.
Effects of RR of SF6 tracer (LRR v. HRR) and source of gas samples (ruminal v. breath) on mean ratios of concentrations of gases and estimated emissions of CH4 and CO2 over a 8-h sampling period

RR = release rate; LRR = low release rate; HRR = high release rate; LSD = least significant difference.
1Least significant difference for comparing ruminal v. breath (d.f. between 6 and 9).
2NA = not applicable because the statistical analysis was conducted on natural log data.
Overall, the effect of RR of SF6 tracer, both on ratios of gas concentrations and estimated emissions of CH4 and CO2, was similar for ruminal and breath gas samples (source × RR treatment: P > 0.05).
Treatment differed significantly (P < 0.001) in CH4/SF6 and CO2/SF6 ratios, but not in CO2/CH4 ratios (P = 0.619). As expected, the rumen and breath samples had significantly higher means CH4/SF6 and CO2/SF6 concentrations ratios with LRR compared with HRR (×1.78 and 1.90, respectively; P < 0.001). However, the differences were lower than twice the difference in the tracer RR between LRR and HRR. The ruminal and breath estimated emissions of CH4 were lower with LRR than with HRR (105 v. 118 l/8-h period on average, respectively). RR treatment did not differ in ruminal or breath CO2 emissions (P = 0.535).
Irrespective of the RR treatment, a significant effect of source of sampling (ruminal v. breath) on CH4/SF6 ratios was observed (P < 0.01), with breath sampling yielding higher ratios and consequently higher estimated emissions of CH4 (+8.3% on average). Because of respiratory CO2 output, the source of sampling affected both CO2/SF6 and CO2/CH4 ratios (P < 0.001), and breath sampling yielded higher CO2 emission estimates than the ruminal source (P < 0.001).
Discussion
Kinetics of ruminal gas emission estimates
The estimated hourly ruminal CH4 and CO2 production profiles determined in this study are in agreement with previous findings that ruminal fermentation gases evolve rapidly with feeding and that eructation frequency increases with increasing rates of ruminal gas production (Waghorn and Reid, Reference Waghorn and Reid1983; Rémond et al., Reference Rémond, Chaise, Delval and Poncet1993; Moate et al., Reference Moate, Clarke, Davis and Laby1997). In this study, the mean CO2/CH4 ratio in the rumen increased from 2.2 at the pre-feeding stage to 3.6 at the first hour following feeding, with an increase of the rate of production of CO2 by 3.3 times (0.37 v. 1.20 l/min on average) and that of CH4 by 2.4 times (0.16 v. 0.39 l/min on average). These results confirm the rates of increase of gases previously observed in sheep fed twice daily on hay (Rémond et al., Reference Rémond, Chaise, Delval and Poncet1993), and in cattle fed on perennial ryegrass/white clover pastures (Moate et al., Reference Moate, Clarke, Davis and Laby1997). The latter authors reported that, from the pre-feeding to the first hour post-feeding, the rate of entry into the rumen gas headspace of CO2 increased by 3.5 times (0.43 v. 1.45 l/min) and that of CH4 by 2.4 times (0.18 v. 0.41 l/min). The consistency of our results with those of the literature supports the joint utilisation of the SF6 tracer technique and of the ruminal headspace gas sampling to study the kinetics of gas production in the rumen.
SF6 tracer technique and CH4 emission estimates
The 8-h production estimates of CH4 based on ruminal and breath samples were both significantly higher for the HRR than for the LRR treatment. This is in agreement with previous studies on rumen-fistulated steers pen-fed on lucerne silage-based diets (Vlaming et al., Reference Vlaming, Brookes, Hoskin, Pinares-Patiño and Clark2007; Pinares-Patiño et al., Reference Pinares-Patiño, Machmüller, Molano, Smith, Vlaming and Clark2008b), mentioning that there is a positive association between the RR of SF6 and the CH4 emission estimates (both on absolute and per unit of intake basis) based on breath samples. Vlaming et al. (Reference Vlaming, Brookes, Hoskin, Pinares-Patiño and Clark2007) reported an increase in the estimated CH4 yield of 4.3% for each 1 mg/day increase in RR of SF6, irrespective of the level of intake of animals assuming the RR from permeation tubes was linear over the range from 2.88 to 7.34 mg/day. Pinares-Patiño et al. (Reference Pinares-Patiño, Machmüller, Molano, Smith, Vlaming and Clark2008b) confirmed the relationship with permeation tubes releasing four different rates of SF6 (1.91, 3.62, 5.34 and 11.34 mg/day). Both the absolute CH4 emission (g/day) and CH4 yield (g/kg DMI) increased linearly with increasing RR of SF6, each 1 mg/day increase in RR of SF6 accounting for an increase of 6.6% in CH4 emission estimates from breath samples. The same difference in CH4 emission estimates between the two tested RR of SF6 (1.58 v. 3.15 mg/day) was reported in our experiment for the two sources of gas samples (breath v. rumen) and averaged 7.2% for each 1 mg/day increase in RR of SF6.
The calibrated tracer source, the collection of representative breath sample and the subsequent analyses of CH4 and SF6 gases are the three major factors of variation of the SF6 tracer technique (Lassey et al., Reference Lassey, Ulyatt, Martin, Walker and Shelton1997). Because all these components are tightly controlled, in any study, their potential role on the observed association between RR of SF6 and CH4 emission estimates can be ruled out. The calculation of daily CH4 emission estimates is based on the CH4/SF6 ratio of concentrations in breath samples (corrected for background concentrations), and the specific RR of SF6 from a particular permeation tube deployed in the animal. In our study, the differences in CH4/SF6 ratios of concentration in ruminal and breath samples between the RR treatments were much less (1.8) than a two-fold, as expected from the difference in RR between HRR and LRR, whereas the CO2/CH4 ratio of concentration (in ruminal and breath samples) did not differ between HRR and LRR treatments. Thus, the fact that the HRR treatment was associated with higher CH4 production estimates than the LRR treatment suggests that, as the RR of SF6 increased, a greater proportion of the SF6 supposed to be released from its source (i.e. the permeation tube) was not accounted for in the rumen gas headspace and therefore in the breath.
The effect of SF6 RR observed in the CH4/SF6 ratios was similar from the collected breath and ruminal samples. This indicates that SF6 and CH4 are well mixed, with similar behaviour and collection efficiency in the two sampling sources, even though most of the eructated gases (77% to 99%) are inhaled and absorbed into the blood and then excreted with exhalation gases (Dougherty and Cook, Reference Dougherty and Cook1962; Hoernicke et al., Reference Hoernicke, Williams, Waldo and Flatt1965). Thus, it is unlikely that the 9× difference between the molecular weights of SF6 and CH4 would compromise proper mixing and dispersion, and representative sampling. As suggested by Johnson et al. (Reference Johnson, Westberg, Michal and Cossalman2007), because of the forceful eructation process and the turbulent mixing during excretion, the molecular diffusion of gases becomes unimportant, and consequently the SF6 emission would exactly simulate the CH4 emission.
An assumption for the lower SF6 recovery at HRR is that the tracer gas may be released from the rumen via another route than the mouth and nose. The unaccounted fraction of SF6 may be trapped in the rumen, absorbed from the rumen to the blood or bypassed to the lower digestive tract and then subsequently absorbed or excreted with undigested material or flatus. It is known that at body temperatures SF6 has lower solubility than CH4 (Meyer et al., Reference Meyer, Tebbe and Piiper1980); however, solubility of a gas increases as its partial pressure increases. Therefore, despite the minute amounts of SF6 in the rumen, it can be postulated that as RR of SF6 increases a larger proportion of SF6 solubilises in the ruminal liquid phase. Then, this dissolved fraction flows to the lower digestive tract where it is absorbed into the blood or passed out with the faecal material. Studies have reported diffusion of SF6 into the lungs from venous blood (Schimmel et al., Reference Schimmel, Bernard, Anderson, Polissar, Lakshminarayan and Hlastala2004), suggesting that SF6 absorption takes places from the digestive tract. As long as the SF6 is excreted via the breath and not stored in the body, this route of excretion per se could not be responsible for the association between RR of SF6 and the CH4 emission estimates. Detectable concentrations of SF6 in either gas trapped in faeces and in urine of animals dosed with SF6 release sources have been reported, but in minute quantities (Vlaming et al., Reference Vlaming, Brookes, Hoskin, Pinares-Patiño and Clark2007). The possible excretion of SF6 via flatus or in solution or adhering to faecal material cannot be excluded. The relative importance of these alternative pathways of excretion of SF6 remains to be determined.
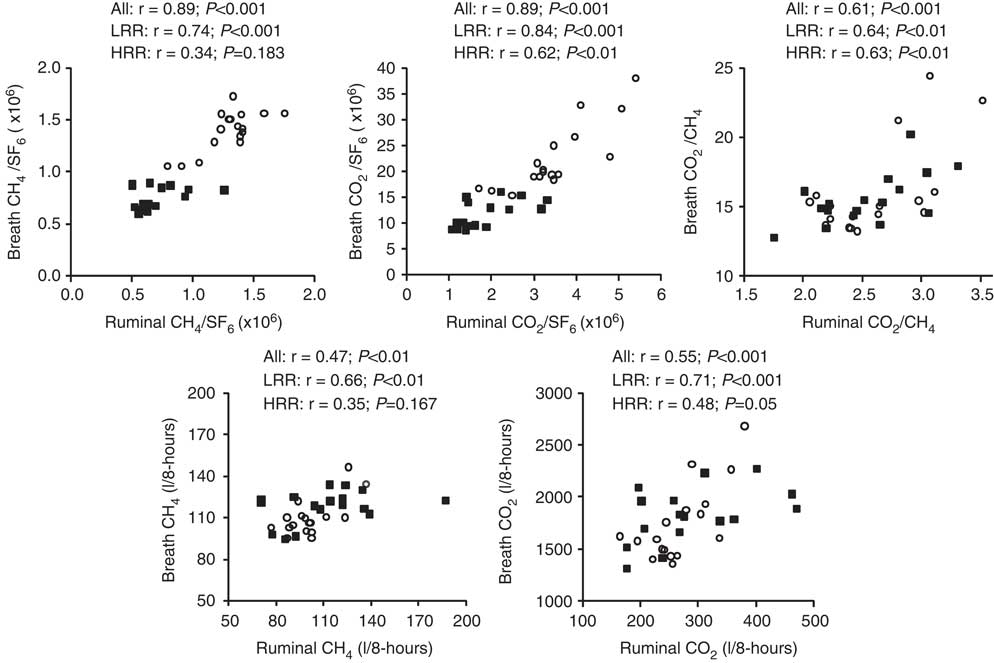
By confirming the relationship between RR of SF6 and CH4 estimates, this study suggests that in order to obtain precision in CH4 measurement, permeation tubes used should have a narrow range in the RR and be balanced between treatments of the same animal experimentation. In the literature, the RR of SF6 from permeation tubes mostly reported vary between 1 and 5 mg/day with an average RR of 3 mg/day, which was represented by the HRR in this study. Given that most of the ruminal CH4 and CO2 are excreted (eructed and exhaled) to the mouth and nostrils where the breath samples were taken, a close correlation between ruminal and breath sources for ratios of concentration of gases and emission estimates could be expected. However, results of this study (Figure 2) indicate that contrary to the good relationships for the LRR treatment, the relationships for the HRR treatment were either not significant or were of lower magnitude. These findings suggest that, in our experimental conditions, the SF6 tracer has better performance at LRR (1.5 mg/day) than at HRR (3.0 mg/day) of tracer. Parallel measurements of CH4 emissions using both respiration chamber and tracer technique and involving a range of RR treatments may yield a final answer on the most optimal RR of SF6.
Relationships between breath and ruminal ratios of gas concentrations and emission estimates of CH4 and CO2 for cows deployed with permeation tubes with low (LRR, o) and high (HRR, ▪) release rates of SF6 tracer. Pearson's correlation coefficients are presented for all data (n = 34) and each level of release rate of SF6 tracer (n = 17 each). Total number of points is 34 instead of 36 due to 2 breath gas samples lost.
In this study, the breath samples yielded systematic 8% to 9% higher CH4 emission estimates than the ruminal samples, suggesting that the breath sources accounted for the hindgut production of CH4, which is mostly exhaled. Studies have reported that CH4 produced in the large intestine accounted for 8% to 13% of total daily CH4 production in sheep fed different diets based on lucerne or grain (Murray et al., Reference Murray, Bryant and Leng1976; Torrent and Johnson, Reference Torrent and Johnson1994), 89% being absorbed into the blood, then released into the lungs and exhaled in the breath (Murray et al., Reference Murray, Bryant and Leng1976). However, it can be suggested that the non-significant differences between tracer and chamber CH4 emission estimates observed in validation studies (e.g. Grainger et al., Reference Grainger, Clarke, McGinn, Auldist, Beauchemin, Hannah MC Waghorn, Clark and Eckard2007; Johnson et al., Reference Johnson, Westberg, Michal and Cossalman2007; Pinares-Patiño et al., Reference Pinares-Patiño, Holmes, Lassey and Ulyatt2008a) may be because of the efficacy of gas mixing in rumen and lungs during the eructation and exhalation processes rather than the strict compliance of the SF6 with the tracer principles.
SF6 tracer technique and CO2 emission estimates
In this study, the effect of RR of SF6 tracer on both ruminal and breath CO2 emission estimates was not significant, contrary to what was observed with CH4. However, the latter observation does not imply that SF6 is a better tracer for CO2 than for CH4. In fact, the tracer principles compliance to trace CO2 seems worst than for CH4. Ruminal CO2 is composed of fermentation CO2, salivary CO2 and urea CO2 (Hoernicke et al., Reference Hoernicke, Williams, Waldo and Flatt1965). CO2 and CH4 are absorbed at different rates in the rumen, the absorption of ruminal CO2 being absolutely and relatively higher than the absorption of CH4. In addition, whereas the ruminal flux of CH4 is one way, there is a large exchange of CO2 between rumen and blood (Veenhuizen et al., Reference Veenhuizen, Russell and Young1988). It has also been reported that increased concentrations of ruminal CO2 following feeding increases the flux of blood urea across the ruminal epithelium (Rémond et al., Reference Rémond, Chaise, Delval and Poncet1993).
Breath CO2 corresponds to both exhaled and eructed CO2 (metabolic + fermentation). In this study, the CO2/CH4 ratio in breath gases of 15.5 was much higher than those (CO2/CH4 = 9 to 12) reported previously for dairy cows and measured using the open-circuit indirect respiration technique (Kinsman et al., Reference Kinsman, Sauer, Jackson and Wolynetz1995; Sauer et al., Reference Sauer, Fellner, Kinsman, Kramer, Jackson, Lee and Chen1998), which suggests an obvious overestimation. Higher estimates of total CO2 emissions in ruminants with the tracer technique (∼+20%) than those obtained using open-circuit calorimetry have already been reported (Boadi et al., Reference Boadi, Wittenberg and Kennedy2002). The overestimation of CO2 productions with the tracer technique may be explained by a difference in the rate of emission between enteric and metabolic CO2, and therefore between the SF6 tracer gas and the metabolic CO2. Our results confirm that SF6 tracer seems inappropriate for CO2 emissions estimation in ruminants.
Conclusion
This study found a positive relationship between RR of SF6 and CH4 production estimates based on rumen headspace gas samples. It also confirmed the positive relationship between RR of SF6 and CH4 emission estimates from breath samples. In our experimental conditions, the performance of the SF6 tracer to estimate CH4 emissions diminished with the highest RR of SF6. Nevertheless, the mechanism by which the relationship occurs is not known, but it seems that this has ruminal origins. We hypothesise that at HRR an increasing proportion of SF6 is washed out to the lower digestive tract and then not accounted for in the breath because of losses in faecal material. Experimental work, involving a bigger range of RR treatments, on transactions of SF6 in the digestive tract, blood and other tissues is required to comprehend the limitations of the SF6 tracer technique for accurate and precise estimation of enteric CH4 emissions.