Body composition assessment is fundamental in both clinical and athletic settings, offering essential insights for diagnosing metabolic disorders, monitoring sarcopenia, evaluating nutritional intervention, and optimising training programmes(Reference Antonio, Ellerbroek and Silver1–Reference Holmes and Racette3). Body composition can be described using a two-compartment model, consisting of fat mass (FM) and fat-free mass (FFM). FFM comprises water, protein and mineral content, whereas lean body mass (LBM) is conceptually similar but additionally includes essential lipids contained within cell membranes(Reference Prado, Gonzalez and Norman4,Reference Tucker, Christopher and Jensen5) . Accurate assessment of these components is challenging due to differences in muscle and FM distribution, impacting both health risks and disease diagnosis(Reference Jensen6). Although whole-body composition analysis provides global estimates of FM and FFM, it does not fully capture regional variations important for metabolic and functional assessment(Reference Tucker, Christopher and Jensen5). Segmental analysis provides detailed information about specific body regions, such as the arms, legs and trunk, offering a more precise assessment than whole-body analysis. This approach is beneficial for diagnosing sarcopenia(Reference Hanna, Jamieson and Lee7), identifying muscle imbalances and assessing visceral fat accumulation associated with metabolic disorders(Reference Bosy-Westphal, Jensen and Braun8). Moreover, it serves as a valuable tool in sports training, injury prevention and rehabilitation by enabling effective monitoring of regional muscle changes(Reference Rossini-Venturini, Abdalla and Fassini9).
Several reliable methods are available for assessing body composition, including dual-energy X-ray absorptiometry (DXA), magnetic resonance imaging and computed tomography(Reference Lemos and Gallagher10). However, these techniques are expensive, time-consuming and often involve radiation exposure, making them less accessible for routine clinical use(Reference Lemos and Gallagher10,Reference Duren, Sherwood and Czerwinski11) . To overcome these limitations, indirect methods such as bioelectrical impedance analysis (BIA) have been developed as practical alternatives. BIA devices provide a noninvasive, portable and cost-effective approach for assessing body composition in both clinical and field settings. These devices operate on the principle that electrical currents pass more easily through tissues rich in water and electrolytes, such as muscle (low impedance). In contrast, they encounter greater resistance in tissues with lower water content, such as fat (high impedance)(Reference Kyle, Bosaeus and De Lorenzo12–Reference Wingo, Barry and Ellis14).
Several studies have compared BIA systems with DXA for assessing body composition. A study found that while the TANITA BC-418 provided acceptable estimates for leg lean mass in children, accuracy for trunk compartments improved only when impedance data were combined with anthropometric predictors(Reference Luque, Escribano and Zaragoza-Jordana15). Another research reported excellent agreement between the InBody 770 and DXA in older adults with type 2 diabetes(Reference Buch, Ben-Yehuda and Rouach16). Similarly, Looney et al. (2024) showed that the same device had near-perfect reliability and strong concordance with DXA after a minor body fat correction(Reference Looney, Schafer and Chapman17).
Together, these findings support the robustness of BIA devices for accurate body composition analysis across populations. However, there is a need to check the validity of a new device as it is introduced to the market. Accordingly, the Anea BIA device, developed by the Anea Iranian company, has not yet been validated in any study for its accuracy in segmental analysis. Therefore, the present study aimed to evaluate the validity of the Anea®, InBody® and Tanita® devices compared with the DXA in assessing segmental body composition among healthy Iranian adults.
Material and methods
Study design and participants
This study included 62 healthy subjects (33 men and 29 women). Inclusion criteria were (a) adults aged 18–55 years old, (b) seemingly healthy, (c) male and female. Participants were excluded if they had (a) a history of bariatric surgery; (b) diabetes; (c) CVD; (d) Parkinson’s disease; (e) heart failure; (f) thyroid dysfunction or malignancy; (g) evident alcohol or drug abuse; (h) pregnancy or lactation; (i) metallic implants or cardiac pacemakers; (j) limb amputation or severe deformity in the measured area; (k) inability to lie supine; (l) signs of oedema; (m) exposure to radiation or administration of radionuclides or gastrointestinal contrast within the previous four weeks or (n) use of medications or dietary regimens affecting body composition.
The sample size was calculated using an intraclass correlation coefficient (ICC) of 0·79, a precision (d) of 0·10, and an alpha(α) of 0·05 based on the research by Irwin et al.(Reference Brown, Cruz and Chandler18). Accordingly, a minimum of 41 participants were required for this study using the following formula:
 $$ {\rm N} = {\left( {{{{z}_{1 - {{\alpha }\over{2}}} \scriptstyle {{\times \sqrt 2 {\rm{\;}}\left( {1 - ICC} \right)}}}}\over{ \scriptstyle d}} \right)^2} + 1$$
Socio-demographic and anthropometric assessments
Socio-demographic data, including age, sex, smoking status, education level, marital status, ethnicity and occupation, were collected using a structured questionnaire. Body weight was measured in light clothing and without shoes using a digital scale (Seca, Hamburg, Germany) to the nearest 0·1 kg. Height was measured using a wall-mounted stadiometer, with participants standing barefoot, and recorded to the nearest 0·5 cm. BMI was calculated as weight (in kilograms) divided by height squared (in metres squared). Waist circumference was measured at the midpoint between the lower rib and the iliac crest, over light clothing, without compressing the skin, and recorded to the nearest 0·5 cm. Hip circumference was measured at the level of the most significant protrusion of the buttocks, in a horizontal plane(Reference Veghari, Salehi and Vaghari19).
Body composition assessment
Body composition was assessed using three BIA devices: InBody® 770 (Seoul, Korea), Anea® BIA (Tehran, Iran) and Tanita® BC-418 (Tokyo, Japan). All measurements were performed on the same day after a 10-hour overnight fast. Participants were instructed to maintain adequate hydration and to empty their bladder and bowels before the assessment. Participants were also instructed to remove any metallic accessories for segmental body composition assessment using BIA. The participants’ height, sex and age were then entered into the device’s software. Participants stood upright with bare feet on the BIA device’s footpads and held the hand electrodes, keeping their arms slightly abducted to avoid contact with the torso. This position was maintained throughout the test. Segmental fat and lean mass were measured using a Hologic DXA system (software version 13.6.0.2, TBAR1904 NHANES BCA calibration, USA). The DXA system was calibrated daily by the same certified technician following the manufacturer’s guidelines. Participants were instructed to remove all jewellery, such as watches, rings, earrings and necklaces, to prevent interference with the DXA scan. Details, including the participant’s date of birth, weight, height and gender, were entered into the system. The scanning process took approximately fifteen minutes, during which participants had to remain motionless and silent. In this study, we used segmental body compositions, including arms fat mass (arms-FM), legs fat mass (legs-FM), trunk fat mass (trunk-FM), arms fat-free mass (arms-FFM), legs fat-free mass (legs-FFM), trunk fat-free mass (trunk-FFM), arms lean body mass (arms-LBM), legs lean body mass (legs-LBM) and trunk lean body mass (trunk-LBM).
Statistical analysis
Statistical analyses were performed using IBM SPSS Statistics version 27 (IBM Corp.). To create a single variable, we added the left and right values together for bilateral segments (legs and arms). Descriptive statistics were calculated for participant characteristics, including frequency distributions, means and sd. Paired sample t tests (or Wilcoxon signed-rank tests for non-normally distributed data) were used to compare the mean segmental measurements obtained from BIA devices and DXA. Pearson’s correlation coefficients (Spearman’s for abnormal data) (r) were used to assess the relations between the measurements assessed using the BIA devices compared with the DXA method. Concordance between DXA and the BIA devices was assessed using Lin’s concordance correlation coefficient (CCC), which decomposes agreement into precision (ρ) and accuracy (C_b) components. Precision corresponds to the correlation coefficient (r).
Accuracy was calculated as C_b = CCC/ρ, as described by Lin(Reference Lawrence and Lin20). CCC values were interpreted using commonly applied criteria (CCC < 0·90, poor; 0·90 ≤ CCC < 0·95, moderate; 0·95 ≤ CCC < 0·99, substantial; and CCC ≥ 0·99, almost perfect agreement), as proposed by McBride(Reference McBride21). Linear regression analysis was performed to calculate R2 and adjust R2; and determine the standard error of the estimate. Bland–Altman’s method assessed agreement between the BIA devices and the DXA method by plotting the differences between the two methods against the average values. The mean percentage error (MPE) was used to assess the agreement between the two methods at the group level. A two-tailed P-value < 0·05 was considered statistically significant.
Results
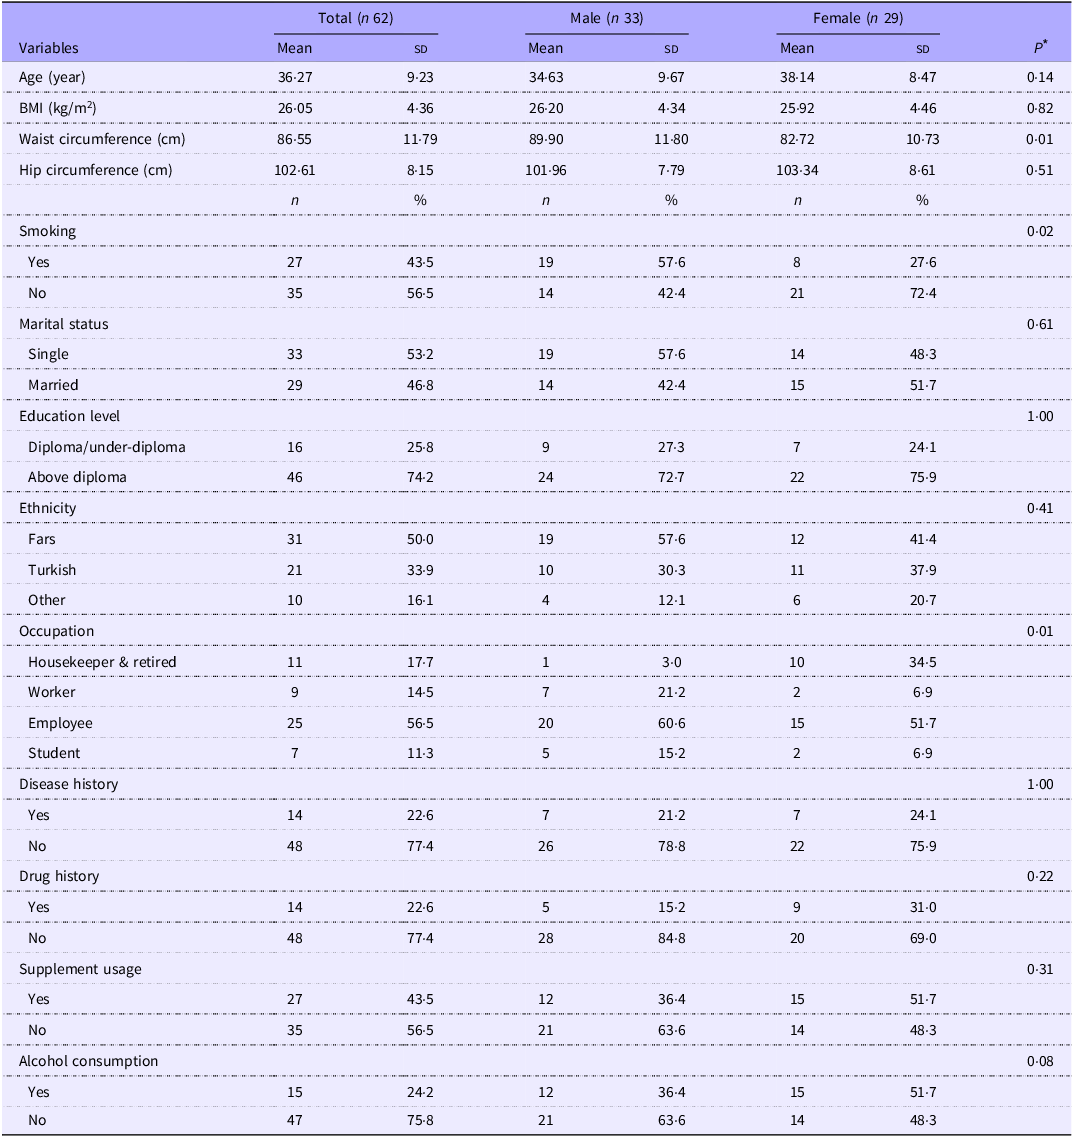
This study included 62 healthy subjects (33 men and 29 women) with a mean age of 36·27 (sd 9·23) years from various districts of Tehran, recruited through convenience sampling, and a mean BMI of 26·05 (sd 4·36) kg/m2. Significant differences were observed in waist circumference (P = 0·01), smoking status (P = 0·02) and occupation (P = 0·01) between men and women (Table 1)(Reference Lawrence and Lin20).
General characteristics of the study participants

Table 1 Long description
The table presents general characteristics of 62 healthy subjects, divided into 33 males and 29 females. It includes variables such as age, BMI, waist circumference, hip circumference, smoking status, marital status, education level, ethnicity, occupation, disease history, drug history, supplement usage, and alcohol consumption. The table shows mean values and standard deviations for continuous variables and counts and percentages for categorical variables. Notable significant differences are observed in waist circumference, smoking status, and occupation between males and females.
Data are presented as mean (sd) or number (%).
* Independent sample t test and χ 2/Fisher’s exact tests were used for comparison of quantitative and qualitative variables between the two groups.
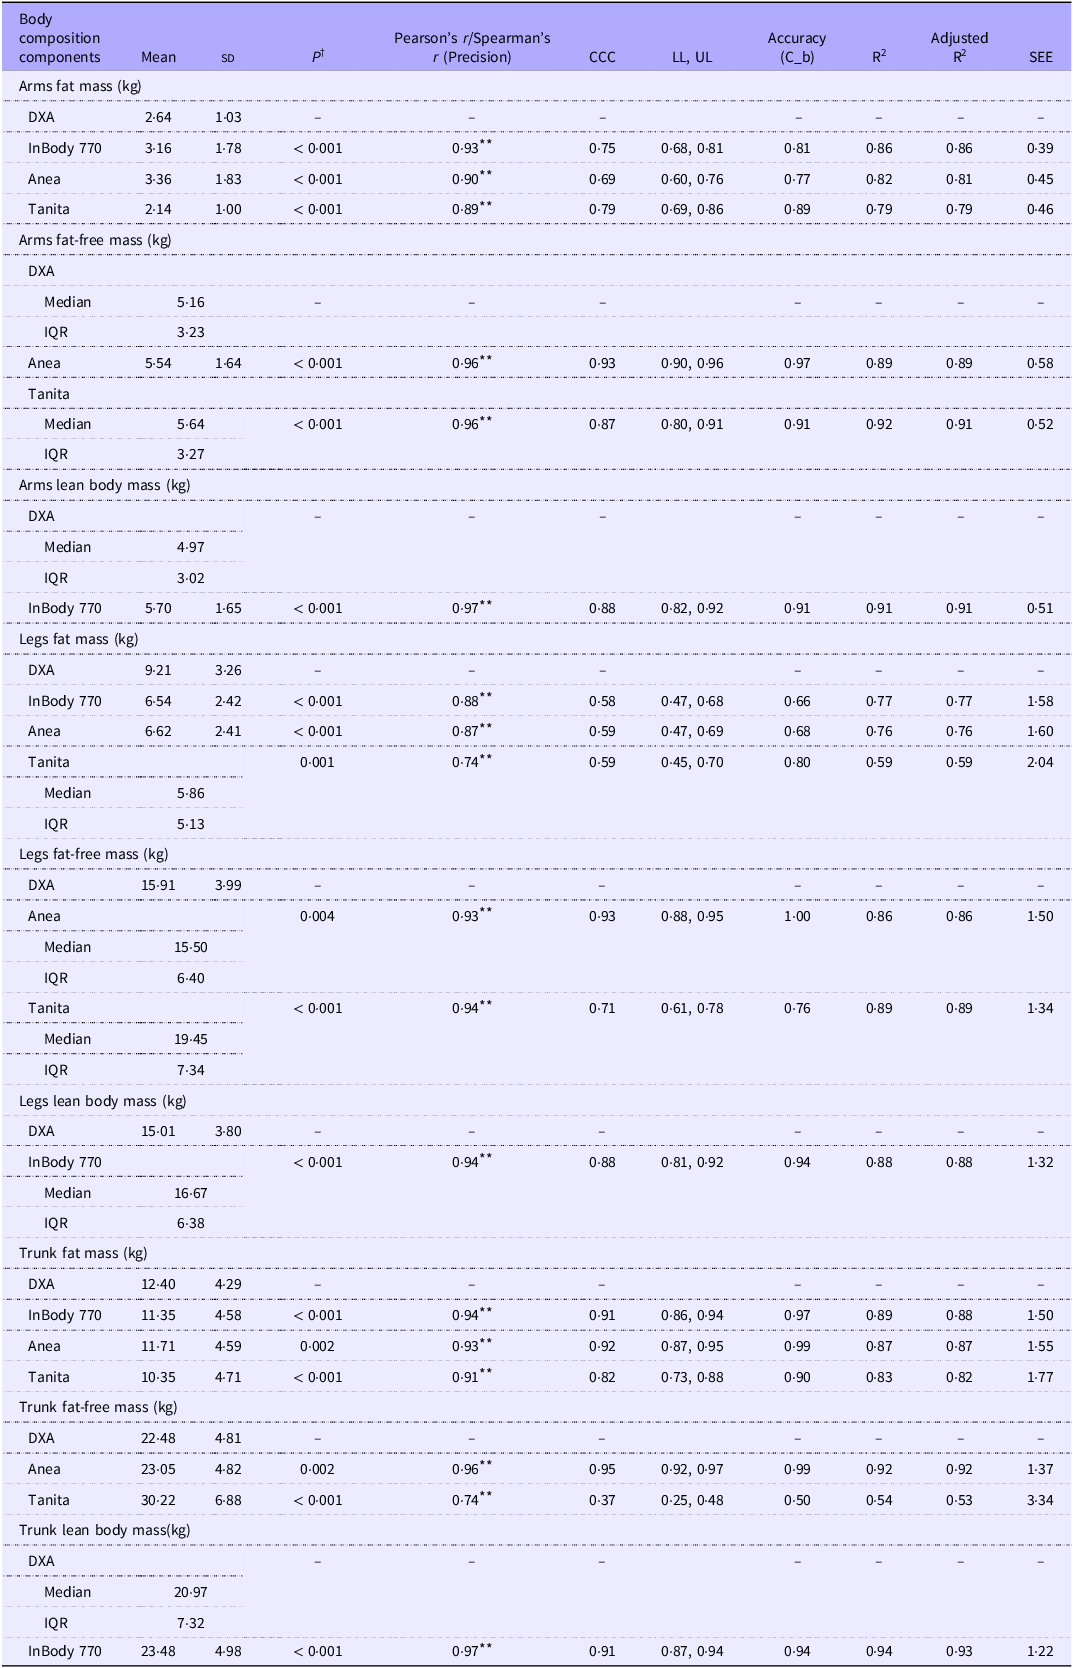
The precision of the BIA devices compared with the DXA method is shown in Table 2. As shown, a significant and strong correlation was observed between segmental body composition assessment using BIA devices and the DXA method (for all, r ≥ 0·74, P < 0·05). However, the levels of agreement for all BIA devices with DXA were poor for most segments (CCC < 0·90), except for the trunk-FM, for which Anea and InBody showed moderate agreement (CCC ≥ 0·90). For FFM and LBM, the agreement levels were different. The Anea device showed moderate agreement for arms-FFM (CCC = 0·93) and legs-FFM (CCC = 0·93) and substantial agreement for trunk-FFM (CCC = 0·95). However, the InBody device showed poor agreement for arms-LBM (CCC = 0·88) and legs-LBM (CCC = 0·88) and only moderate agreement for trunk-LBM (CCC = 0·91). The Tanita device consistently demonstrated poor agreement for all FFM segments (CCCs ≤ 0·87).
Precision of segmental body composition assessment by different devices compared with the DXA in study participants (n 62)

Table 2 Long description
The table compares body composition measurements from different devices against DXA. It has 12 rows and 12 columns. The columns are labeled: Body composition components, Mean, sd, p, Pearson's r (Precision), Spearman's r, CCC, LL, UL, Accuracy (C_b), R^2, Adjusted R^2, SEE. The rows are grouped by different body composition components: Arms fat mass (kg), Arms fat-free mass (kg), Arms lean body mass (kg), Legs fat mass (kg), Legs fat-free mass (kg), Legs lean body mass (kg), Trunk fat mass (kg), Trunk fat-free mass (kg), Trunk lean body mass (kg). Each group contains measurements from DXA, InBody 770, Anea, and Tanita devices. The table includes mean values, standard deviations, p-values, Pearson's and Spearman's correlation coefficients, CCC values, lower and upper limits, accuracy, R-squared values, adjusted R-squared values, and standard error of estimate for each measurement.
Abbreviations: DXA; Dual-energy X-ray absorptiometry, CCC; concordance correlation coefficient, LL; lower limit, UL; upper limit, SEE; standard error of the estimate.
Data are presented as mean (sd) or median (IQR).
R2, adjusted R2 and SEE were estimated using linear regression.
† Paired sample t test or Wilcoxon signed-rank test was used.
** Correlation is significant at the 0·01 level (2-tailed).
Tables 3 and 4 present the precision of segmental body composition assessment by various BIA devices compared with DXA, with stratification by gender and BMI variations. Accordingly, we found that all BIA devices showed poor agreement with DXA for males, except for trunk-FM estimated by Anea (CCC = 0·91). Almost identical results were obtained for females, with only trunk-FM being substantial for InBody (CCC = 0·95) and moderate for Anea (CCC = 0·93). Regarding BMI classifications, a higher level of agreement between all the devices and the DXA method was found in participants with a BMI < 25·0 kg/m2.
Precision of segmental body composition assessment by different devices compared with the DXA by sex categories

Table 3 Long description
The table compares the precision of segmental body composition assessment by different devices against DXA, stratified by sex categories. It includes mean, SD, p-value, Pearson's/Spearman's correlation, CCC, LL, UL, Accuracy (percent), SEE, and Adjusted R-squared values for various body composition metrics such as fat mass, fat-free mass, and lean body mass. The table is divided into sections for males and females, with further subdivisions for different BMI categories. Each row represents a different device and body composition metric, with corresponding values listed across the columns. Notable trends include varying levels of agreement between devices and DXA, with specific metrics and devices showing higher or lower precision.
Abbreviations: DXA; Dual-energy X-ray absorptiometry, CCC; concordance correlation coefficient, LL; lower limit, UL; upper limit, SEE; standard error of the estimate.
R2, adjusted R2 and SEE were estimated using linear regression.
Data are presented as mean (sd) or median (IQR).
* Correlation is significant at the 0·05 level (2-tailed).
** Correlation is significant at the 0·01 level (2-tailed).
† Paired sample t test or Wilcoxon signed-rank test was used.
Precision of segmental body composition assessment by different devices compared with the DXA by BMI categories

Abbreviations: DXA; Dual-energy X-ray absorptiometry, CCC; concordance correlation coefficient, LL; lower limit, UL; upper limit, SEE; standard error of the estimate.
Data are presented as mean (sd) or median (IQR).
R2, adjusted R2 and SEE were estimated using linear regression.
† Paired sample t test or Wilcoxon signed-rank test was used.
** Correlation is significant at the 0·01 level (2-tailed).
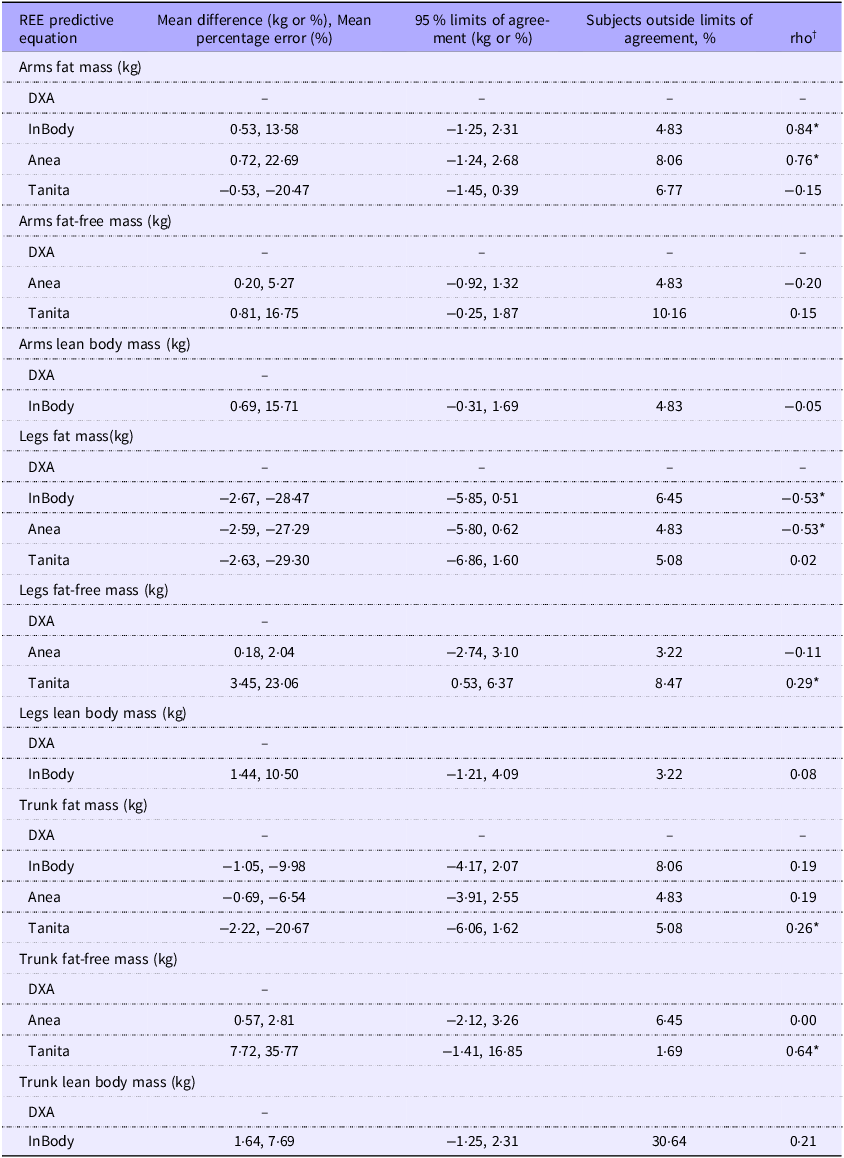
Table 5 presents the MPE and Bland–Altman agreement analysis between the devices and DXA for segmental body composition assessment (also see online Supplementary File 1). As shown, the Anea device overestimated arms-FM (mean percentage error (MPE) = 22·69 %); it also underestimated legs-FM (MPE = −27·29 %) and trunk-FM (MPE = −6·54 %). The device overestimated arms-FFM (MPE = 5·27 %), legs-FFM (MPE = 2·04 %), and trunk-FFM (MPE = 2·81 %). The Tanita device underestimated the arms-FM (MPE = −20·47 %), legs-FM (MPE = −29·30 %), and trunk-FM (MPE = −20·67 %). This device also overestimated arms-FFM (MPE = 16·75 %), legs-FFM (MPE = 23·06 %), and trunk-FFM (MPE = 35·77 %). The InBody device overestimated arms-FM (MPE = 13·58 %), arms-LBM (MPE = 15·71 %), legs-LBM (MPE = 10·50 %), and trunk-LBM (MPE = 7·69 %); as well as underestimated legs-FM (MPE = −28·47 %) and trunk-FM (MPE = −9·98 %). For most comparisons, the percentage of subjects falling outside the limits of agreement was less than 10 % for all examined devices, except for arms-FFM by Tanita (10·16 %) and trunk-LBM by InBody (30·64 %). However, some results showed a significant proportional bias in the agreement between devices and the DXA method (arms-FM: InBody and Anea; legs-FM: InBody and Anea; trunk-FM: Tanita; legs-FFM: Tanita; and trunk-FFM: Tanita, all P < 0·05).
Bland–Altman analysis for agreement between segmental body composition assessments by different devices compared with the DXA in study participants (n 62)

Table 5 Long description
The table compares the mean difference, percentage error, limits of agreement, and percentage of subjects outside limits of agreement for various body composition assessments between different devices and DXA. It has 12 rows and 5 columns. The columns are labeled as REE predictive equation, Mean difference (kg or %), Mean percentage error (%), 95% limits of agreement (kg or %), and Subjects outside limits of agreement, %. The rows are grouped by different body composition assessments: Arms fat mass (kg), Arms fat-free mass (kg), Arms lean body mass (kg), Legs fat mass (kg), Legs fat-free mass (kg), Legs lean body mass (kg), Trunk fat mass (kg), Trunk fat-free mass (kg), and Trunk lean body mass (kg). Each row provides data for different devices: DXA, InBody, Anea, and Tanita. The table includes specific values for mean difference, percentage error, limits of agreement, and percentage of subjects outside limits of agreement for each device and body composition assessment.
Mean difference = value of the difference between body composition assessed by the different devices and body composition assessed by the DXA; Mean percentage error = ((segmental body composition assessed by different devices-segmental body composition assessed by DXA)/segmental body composition assessed by DXA) × 100 (for percent body fat the following formula was used: ((percent body fat by the devices – percent body fat by DXA)/percent body fat by DXA).
† Pearson’s correlation coefficients between the difference and average segmental body composition assessed by the different devices and segmental body composition assessed by the DXA, indicating proportional bias. *Statistically significant (P < 0·05).
Abbreviations: DXA; Dual-energy X-ray absorptiometry.
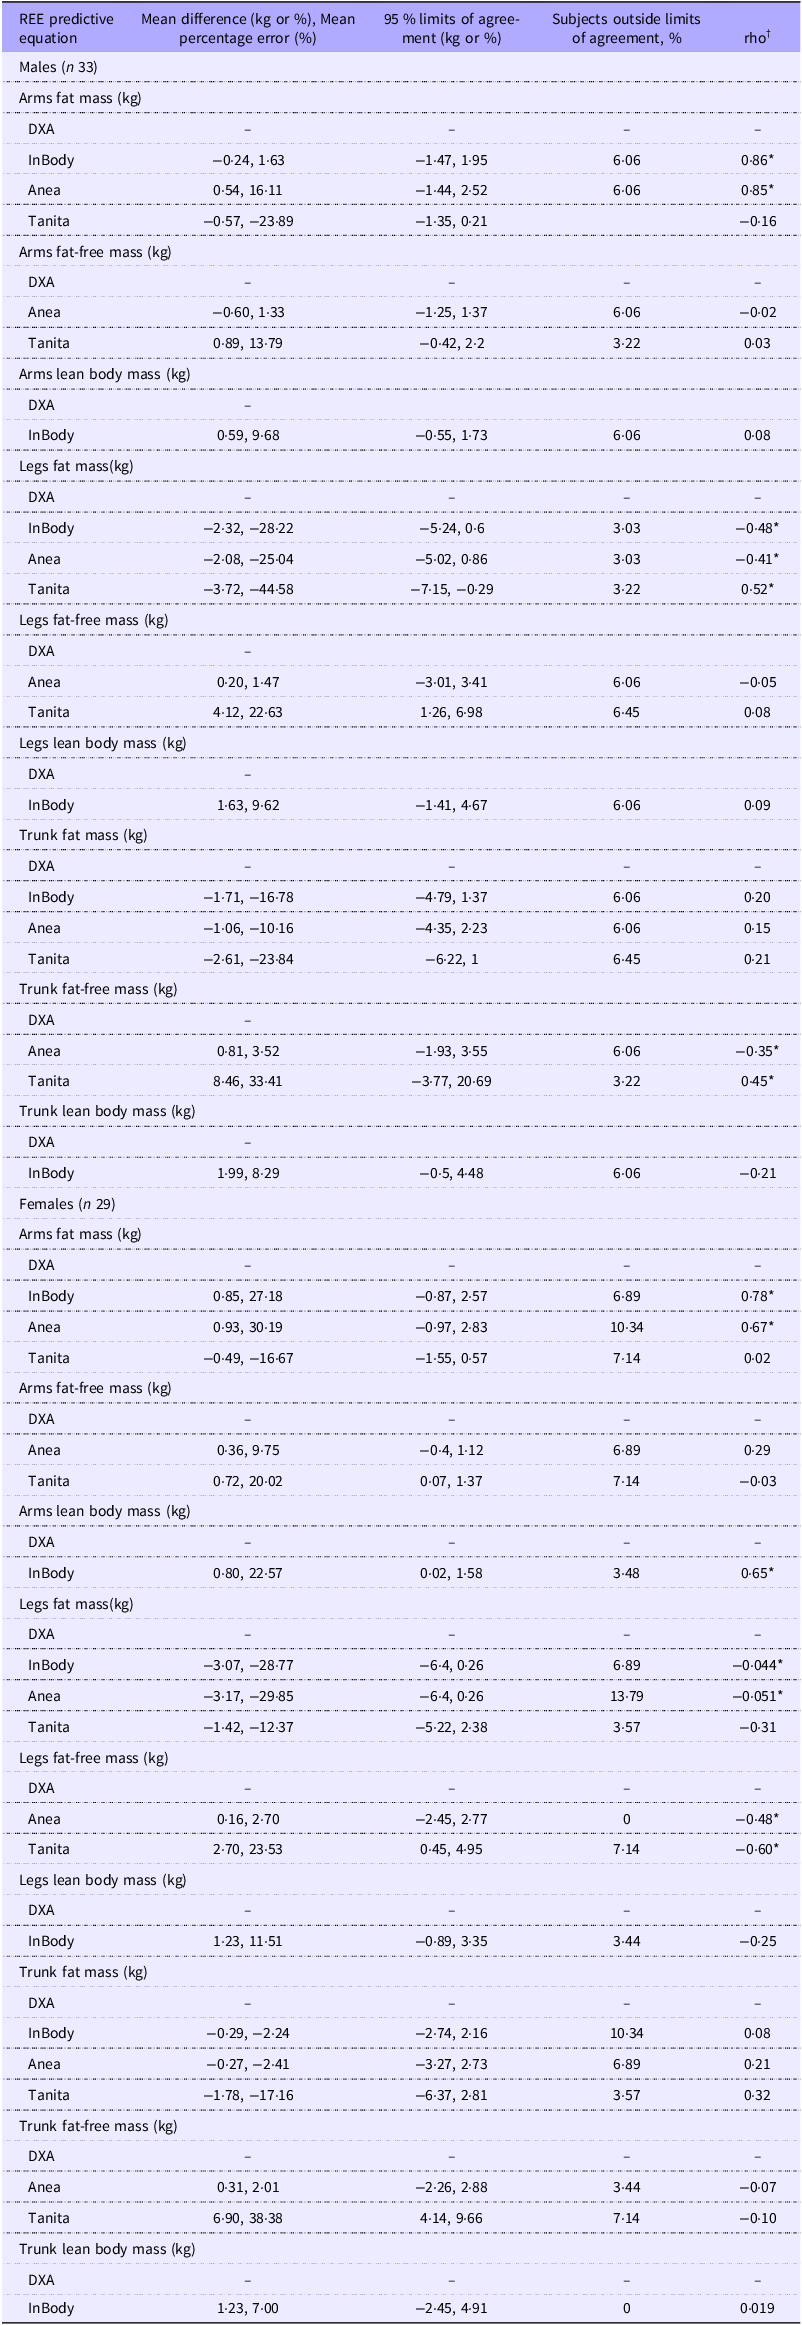
Table 6 presents the MPE and the Bland–Altman agreement analysis comparing the devices with the DXA segmental body composition assessment, taking into account sex differences (also see online Supplementary File 2). The results indicated that the Anea device underestimated legs-FM (greater error in females) and trunk-FM (greater error in males); as well as overestimated arms-FM (greater error in females), arms-FFM (greater error in females), legs-FFM (greater error in females) and trunk-FFM (greater error in males) in both males and females. The Tanita device underestimated arms-FM, legs-FM and trunk-FM (with a greater error in males for all parameters) and overestimated arms-FFM, legs-FFM and trunk-FFM (with a greater error in females for all parameters) in both males and females. The InBody device overestimated arms-FM (greater error in females), arms-LBM (greater error in females), legs-LBM (greater error in females) and trunk-LBM (greater error in males) and underestimated legs-FM (virtually the same in both) and trunk-FM (greater error in males) in both males and females.
Bland–Altman analysis for agreement between body composition assessments by different devices compared with the DXA by sex categories

Table 6 Long description
The table presents the mean percentage error and Bland-Altman agreement analysis comparing the devices with the DXA segmental body composition assessment, taking into account sex differences. It includes data for males and females, with columns for different devices (DXA, Inbody, Area, Tanita) and rows for various body composition measurements (Arms fat mass, Arms lean body mass, Legs fat mass, Legs lean body mass, Trunk fat mass, Trunk lean body mass). Each cell contains the mean difference in kilograms or mean percentage error and the 95 percent limits of agreement in kilograms or percent, along with the percentage of subjects outside the limits of agreement. The table highlights the underestimation and overestimation trends for each device and sex category.
Mean difference = value of the difference between body composition assessed by the different devices and body composition assessed by the DXA; Mean percentage error = ((segmental body composition assessed by different devices-segmental body composition assessed by DXA)/segmental body composition assessed by DXA) × 100 (for percent body fat the following formula was used: ((percent body fat by the devices – percent body fat by DXA)/percent body fat by DXA).
† Pearson’s correlation coefficients between the difference and average segmental body composition assessed by the different devices and segmental body composition assessed by the DXA, indicating proportional bias. *Statistically significant (P < 0·05).
Abbreviations: DXA; Dual-energy X-ray absorptiometry.
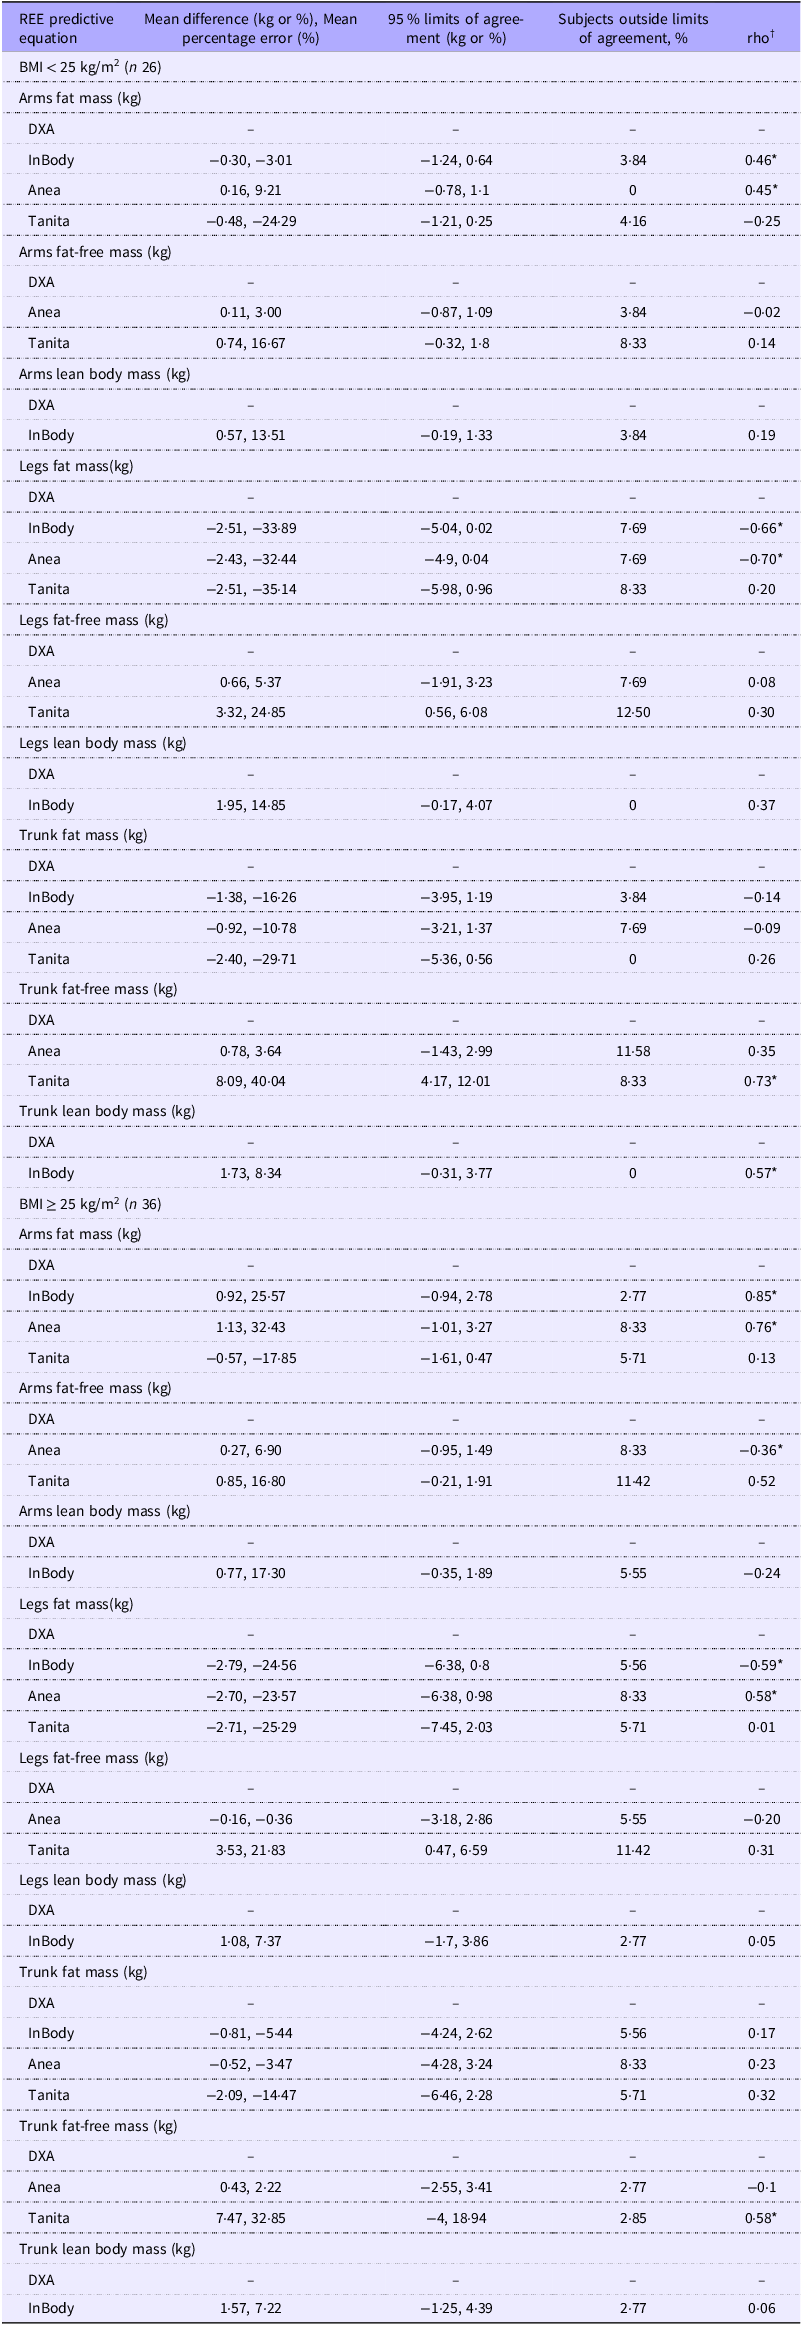
Table 7 presents the results of agreement tests (MPE and Bland–Altman) according to BMI categorisation (BMI < 25·0 kg/m2; and BMI ≥ 25·0 kg/m2) (see also online Supplementary File 3). The results indicated that the Anea device underestimated legs-FM (greater error in BMI < 25·0 kg/m2) and trunk-FM (greater error in BMI < 25·0 kg/m2); as well as overestimated arms-FM (greater error in BMI ≥ 25·0 kg/m2), arms-FFM (greater error in BMI ≥ 25·0 kg/m2), legs-FFM (greater error in BMI < 25·0 kg/m2) and trunk-FFM (greater error in BMI < 25·0 kg/m2) in both BMI categories. The Tanita device underestimated arms-FM, legs-FM and trunk-FM (greater error in BMI < 25·0 kg/m2 for all parameters) and overestimated AFFM (greater error in BMI ≥ 25·0 kg/m2), legs-FFM (greater error in BMI < 25·0 kg/m2) and trunk-FFM (greater error in BMI < 25·0 kg/m2) in both BMI categories. The InBody device overestimated arms-FM in participants with BMI ≥ 25·0 kg/m2, arms-LBM (greater error in BMI ≥ 25·0 kg/m2), legs-LBM (greater error in BMI < 25·0 kg/m2) and trunk-LBM (greater error in BMI < 25·0 kg/m2) and underestimated legs-FM (greater error in BMI < 25·0 kg/m2) and trunk-FM (greater error in BMI < 25·0 kg/m2). For most comparisons, the percentage of subjects falling outside the limits of agreement was less than 10 % for both sex and BMI stratification. However, some results showed a significant proportional bias for the agreement between devices and the DXA method.
Bland–Altman analysis for agreement between body composition assessments by different devices compared with the DXA by BMI categories

Table 7 Long description
The table presents the results of agreement tests (MPE and Bland-Altman) for body composition assessments by different devices compared with DXA, categorized by BMI (< 25 kg/m^2 and 25 kg/m^2). The table has 36 rows and 7 columns. Column headers are: REE predictive equation, Mean difference (kg or percent), 95 percent limits of agreement (kg or percent), and Subjects outside limits of agreement (percent). Row labels include different body composition measurements such as Arms fat mass, Arms lean body mass, Legs fat mass, Legs fat-free mass, Legs lean body mass, Trunk fat mass, and Trunk lean body mass. Each row provides data for different devices: DXA, InBody, Area, and Tanita. The table shows mean differences, 95 percent limits of agreement, and the percentage of subjects outside the limits of agreement for each measurement and device. Notable trends include the underestimation and overestimation of various body composition parameters by different devices in both BMI categories.
Mean difference = value of the difference between body composition assessed by the different devices and body composition assessed by the DXA; Mean percentage error = ((segmental body composition assessed by different devices-segmental body composition assessed by DXA)/segmental body composition assessed by DXA) × 100 (for percent body fat the following formula was used: ((percent body fat by the devices – percent body fat by DXA)/percent body fat by DXA).
† Pearson’s correlation coefficients between the difference and average segmental body composition assessed by the different devices and segmental body composition assessed by the DXA, indicating proportional bias. *Statistically significant (P < 0·05).
Abbreviations: DXA; Dual-energy X-ray absorptiometry.
Discussion
In this study, we compared the segmental body composition results obtained from three BIA devices with those from DXA. Accordingly, our findings indicated a strong correlation between all devices and the DXA method (for all, r ≥ 0·74, P < 0·05). Stratifying our analyses by sex and BMI was crucial, as it revealed performance differences that were obscured in the pooled data, underscoring the importance of considering these variables when interpreting BIA results in clinical practice. Based on commonly used interpretation criteria for Lin’s CCC, the BIA devices demonstrated predominantly poor agreement (CCC < 0·90) with DXA for most segments. The notable exceptions were the moderate-to-substantial agreement for FFM segments by the Anea device and moderate agreement for trunk-FM (Anea and InBody). Agreement for legs-FM was poor across all devices. The devices also showed different errors compared with the DXA, as the Anea overestimated (MPE ≥ 10 %) arms-FM and underestimated (MPE ≥ −10 %) legs-FM. The Tanita device overestimated arms-FFM, legs-FFM and trunk-FFM and underestimated arms-FM, legs-FM and trunk-FM. The InBody device overestimated arms-FM, arms-LBM and legs-LBM and underestimated them. Moreover, our results revealed differences when the data were stratified by sex and BMI, underscoring the importance of considering these factors when utilising BIA devices.
In this study, the multi-frequency (MF) BIA devices (InBody 770 and Anea) demonstrated relatively variable agreement with DXA results. While the Anea device showed moderate or substantial agreement for all FFM segments, the InBody 770 showed poor agreement for limb (arms and legs) LBM assessment (CCC = 0·88 for both). Previous research using the InBody 770 reported significant proportional bias for most measures, whereas legs-LBM and trunk-LBM did not show proportional bias (P > 0·05)(Reference Buch, Ben-Yehuda and Rouach16). In another study, the intraclass correlation coefficient (ICC) values for the InBody720 compared with the DXA method were consistently higher for LBM than for FM across all BMI categories)(Reference Ling, de Craen and Slagboom22). These findings reinforce that MF-BIA devices generally provide more accurate measurements for LBM/FFM than FM(Reference Gába, Kapuš and Cuberek23). Additionally, a study found that InBody 770 overestimated arms-FM (DXA mean = 3·21 (sd 1·58) kg, BIA mean = 5·55 (sd 2·72) kg, P ≤ 0·001) while underestimating LFM and TFM (legs-FM: DXA mean = 8·92 (sd 3·47) kg, BIA mean = 8·54 (sd 2·55) kg, P = 0·043, trunk-FM: DXA mean = 17·48 (sd 5·57) kg, BIA mean = 16·30 (sd 4·88) kg, P ≤ 0·001)(Reference Buch, Ben-Yehuda and Rouach16). Moreover, a study indicated the lowest agreement for legs-FM (CCC = 0·64) and the highest deal for trunk-FM (CCC = 0·94)(Reference Looney, Schafer and Chapman17). Our results also indicated the lowest agreement for legs-FM (CCC for Anea = 0·59, and InBody 770 = 0·58) and the highest deal for trunk-FFM by Anea (CCC = 0·95) and for trunk-FM and trunk-LBM by InBody (CCC = 0·91). Therefore, we can conclude that MF-BIA devices are less accurate in measuring legs-FM.
Our Bland–Altman results support existing evidence of gender-based differences in device performance, with the InBody 770 showing higher FM measurement accuracy in male than female participants(Reference Lahav, Goldstein and Gepner24). Furthermore, a study conducted on female athletes reported that InBody 720 had the lowest correlation coefficient for trunk-LBM (r = 0·82) and the highest for arms-LBM (r = 0·89)(Reference Esco, Snarr and Leatherwood25). However, our findings showed the highest correlation for trunk-LBM and the lowest for legs-FM among the female participants. This discrepancy may stem from differences in the target groups and the type of devices.
Subgroup analyses by sex showed minimal differences, except for legs-FM and arms-LBM. Notably, our BMI-stratified analyses yielded divergent findings from some prior research, contradicting the established notion that BIA devices demonstrate improved accuracy with higher BMI values(Reference Lahav, Goldstein and Gepner24,Reference Hurt, Ebbert and Croghan26,Reference Völgyi, Tylavsky and Lyytikäinen27) . However, our findings align with other research indicating that BIA devices tend to underestimate FM and overestimate FFM or LBM(Reference Antonio, Kenyon and Ellerbroek28,Reference McLester, Nickerson and Kliszczewicz29) .
The single-frequency BIA device used in this study, Tanita BC-418, demonstrated consistently poor agreement (CCC < 0·90) with DXA for all segmental measurements analysed. However, limited evidence exists validating Tanita’s segmental analysis capabilities, warranting additional studies in diverse populations and age groups. Accordingly, similar findings were reported in a survey that was conducted on 7-year-old children (ICC for trunk-LBM = 0·141)(Reference Luque, Escribano and Zaragoza-Jordana15).
Our study has several limitations that must be accepted. First, the study was conducted on a sample of healthy Iranian adults, which raises concerns about the generalisability of the findings to other racial groups. Second, the study was confined to disease- and comorbidity-free volunteers; therefore, caution is warranted when applying the findings to patients with these conditions. Third, our study had a limited sample size, thereby reducing the statistical power of these analyses. We also failed to control for extrinsic variables, including ambient humidity and temperature, which could have influenced the findings of our study. Furthermore, a significant limitation resides with the nature of BIA estimates. Although participants were instructed to maintain regular hydration, we failed to explicitly monitor their hydration status through objective measures such as urine-specific gravity, which is a known confounding factor that could have influenced the findings of our study.
Conclusion
BIA devices can be used in clinical settings for segmental body composition assessment and showed strong correlations with DXA, particularly for lean-related compartments. However, agreement with DXA (CCC) was often poor for several segments, especially for legs-FM. Overall, the multi-frequency devices (Anea and InBody 770) demonstrated higher accuracy than the single-frequency device (Tanita BC-418), with Anea showing the most consistent moderate-to-substantial agreement for FFM segments. Additionally, BIA devices tended to perform better among participants with a BMI < 25·0 kg/m2;.
Supplementary material
For supplementary material/s referred to in this article, please visit https://doi.org/10.1017/S0007114526106412.
Acknowledgements
The authors are grateful to the participants for their kind cooperation.
The study was financially supported by Tehran University of Medical Sciences (grant number: 1402-2-233-67341).
The authors declare no competing interests.
M. A.: formal analysis and article writing; Y. J.: data collection, formal analysis and investigation, and article writing; H. L. A., S. M. A., A. A., F. A-N.: data collection; S. Z. and K. D.: article reviewing and writing and supervision.
The protocol for this study was approved by the Ethics Committee of Tehran University of Medical Sciences, Iran (ethical number: IR.TUMS.NI.REC.1402.019), in accordance with the Declaration of Helsinki. A consent form was obtained from all participants included in the study.