Diabetes mellitus is a chronic metabolic disorder marked by impaired insulin secretion and/or insulin resistance, with type 2 diabetes mellitus accounting for over 90 % of cases. Driven by rapid economic development and urbanisation, the global prevalence of diabetes has been rising steadily. According to the International Diabetes Federation, an estimated 537 million people were living with diabetes in 2021, a number projected to increase to 783 million by 2045(Reference Sun, Saeedi and Karuranga1). Diabetes is a major contributor to both microvascular and macrovascular complications – including retinopathy, nephropathy, neuropathy and CVD(Reference Eid, Sas and Abcouwer2) – which significantly elevate the risk of CVD and all-cause mortality(Reference Raghavan, Vassy and Ho3), imposing a considerable health and economic burden worldwide(Reference Khan, Hashim and King4). Nutritional factors play a pivotal role in diabetes management, with dietary interventions being central to optimising metabolic outcomes and preventing long-term complications.
Choline is an essential nutrient involved in cell membrane integrity, neurotransmitter synthesis, methyl-group metabolism and the regulation of lipid and homocysteine homeostasis(Reference Bekdash5). Although small amounts can be synthesised endogenously via the hepatic phosphatidylethanolamine N-methyltransferase pathway, most choline is obtained through the diet. Rich dietary sources include eggs, red meat, fish, legumes, cruciferous vegetables, whole grains and dairy products(Reference Zeisel and Da6). The National Academy of Medicine recommends adequate intake levels of 550 mg/d for adult men and 425 mg/d for adult women(Reference Bidulescu, Chambless and Siega-Riz7). However, evidence linking dietary choline intake with diabetes risk and outcomes remains inconsistent. Some studies have reported a positive linear association between choline intake and type 2 diabetes mellitus risk(Reference Zhou, Li and Li8,Reference Hosseini-Esfahani, Koochakpoor and Golzarand9) , whereas others have shown inverse associations with choline or its metabolite betaine(Reference Mlodzik-Czyzewska, Szwengiel and Chmurzynska10). Still, several investigations have found no significant relationship between betaine intake and diabetes risk across populations(Reference Hosseini-Esfahani, Koochakpoor and Golzarand9). Furthermore, high choline intake has been associated with increased risk of diabetic retinopathy(Reference Shah, Cheong and Tan11), and elevated plasma choline levels have been identified as an independent risk factor for diabetic kidney disease progression(Reference Saulnier, Liu and Croyal12). Despite these observations, few prospective studies have explored the long-term impact of dietary choline intake on clinical outcomes – particularly mortality – in individuals with diabetes(Reference Karlsson, Winkvist and Strid13–Reference Mazidi, Katsiki and Mikhailidis17). Notably, one US-based study reported a stronger positive association between dietary phosphatidylcholine intake and all-cause and CVD mortality among people with diabetes(Reference Zheng, Li and Rimm18). As an essential nutrient, inadequate choline intake may also be harmful, and an optimal intake range for individuals with diabetes has yet to be defined.
To address these gaps, we investigated the association between dietary choline intake and all-cause, CVD and cancer-related mortality in a nationally representative cohort of individuals with diabetes from the National Health and Nutrition Examination Survey (NHANES) 2007–2018. In addition, we aimed to identify the choline intake range associated with the lowest mortality risk in this population.
Materials and methods
Study population
The NHANES, conducted by the National Center for Health Statistics at the US Centers for Disease Control and Prevention, employs a cross-sectional, multistage probability sampling design to collect health and nutrition data from the non-institutionalised civilian population of the USA. Conducted continuously in 2-year cycles, NHANES provides publicly accessible datasets (https://www.cdc.gov/nchs/nhanes/index.html). The survey protocol is approved by the National Center for Health Statistics Research Ethics Review Board, and all participants provide written informed consent. This study was exempted from ethical review by the Institutional Review Board of Nanjing First Hospital, as it used de-identified, publicly available data.
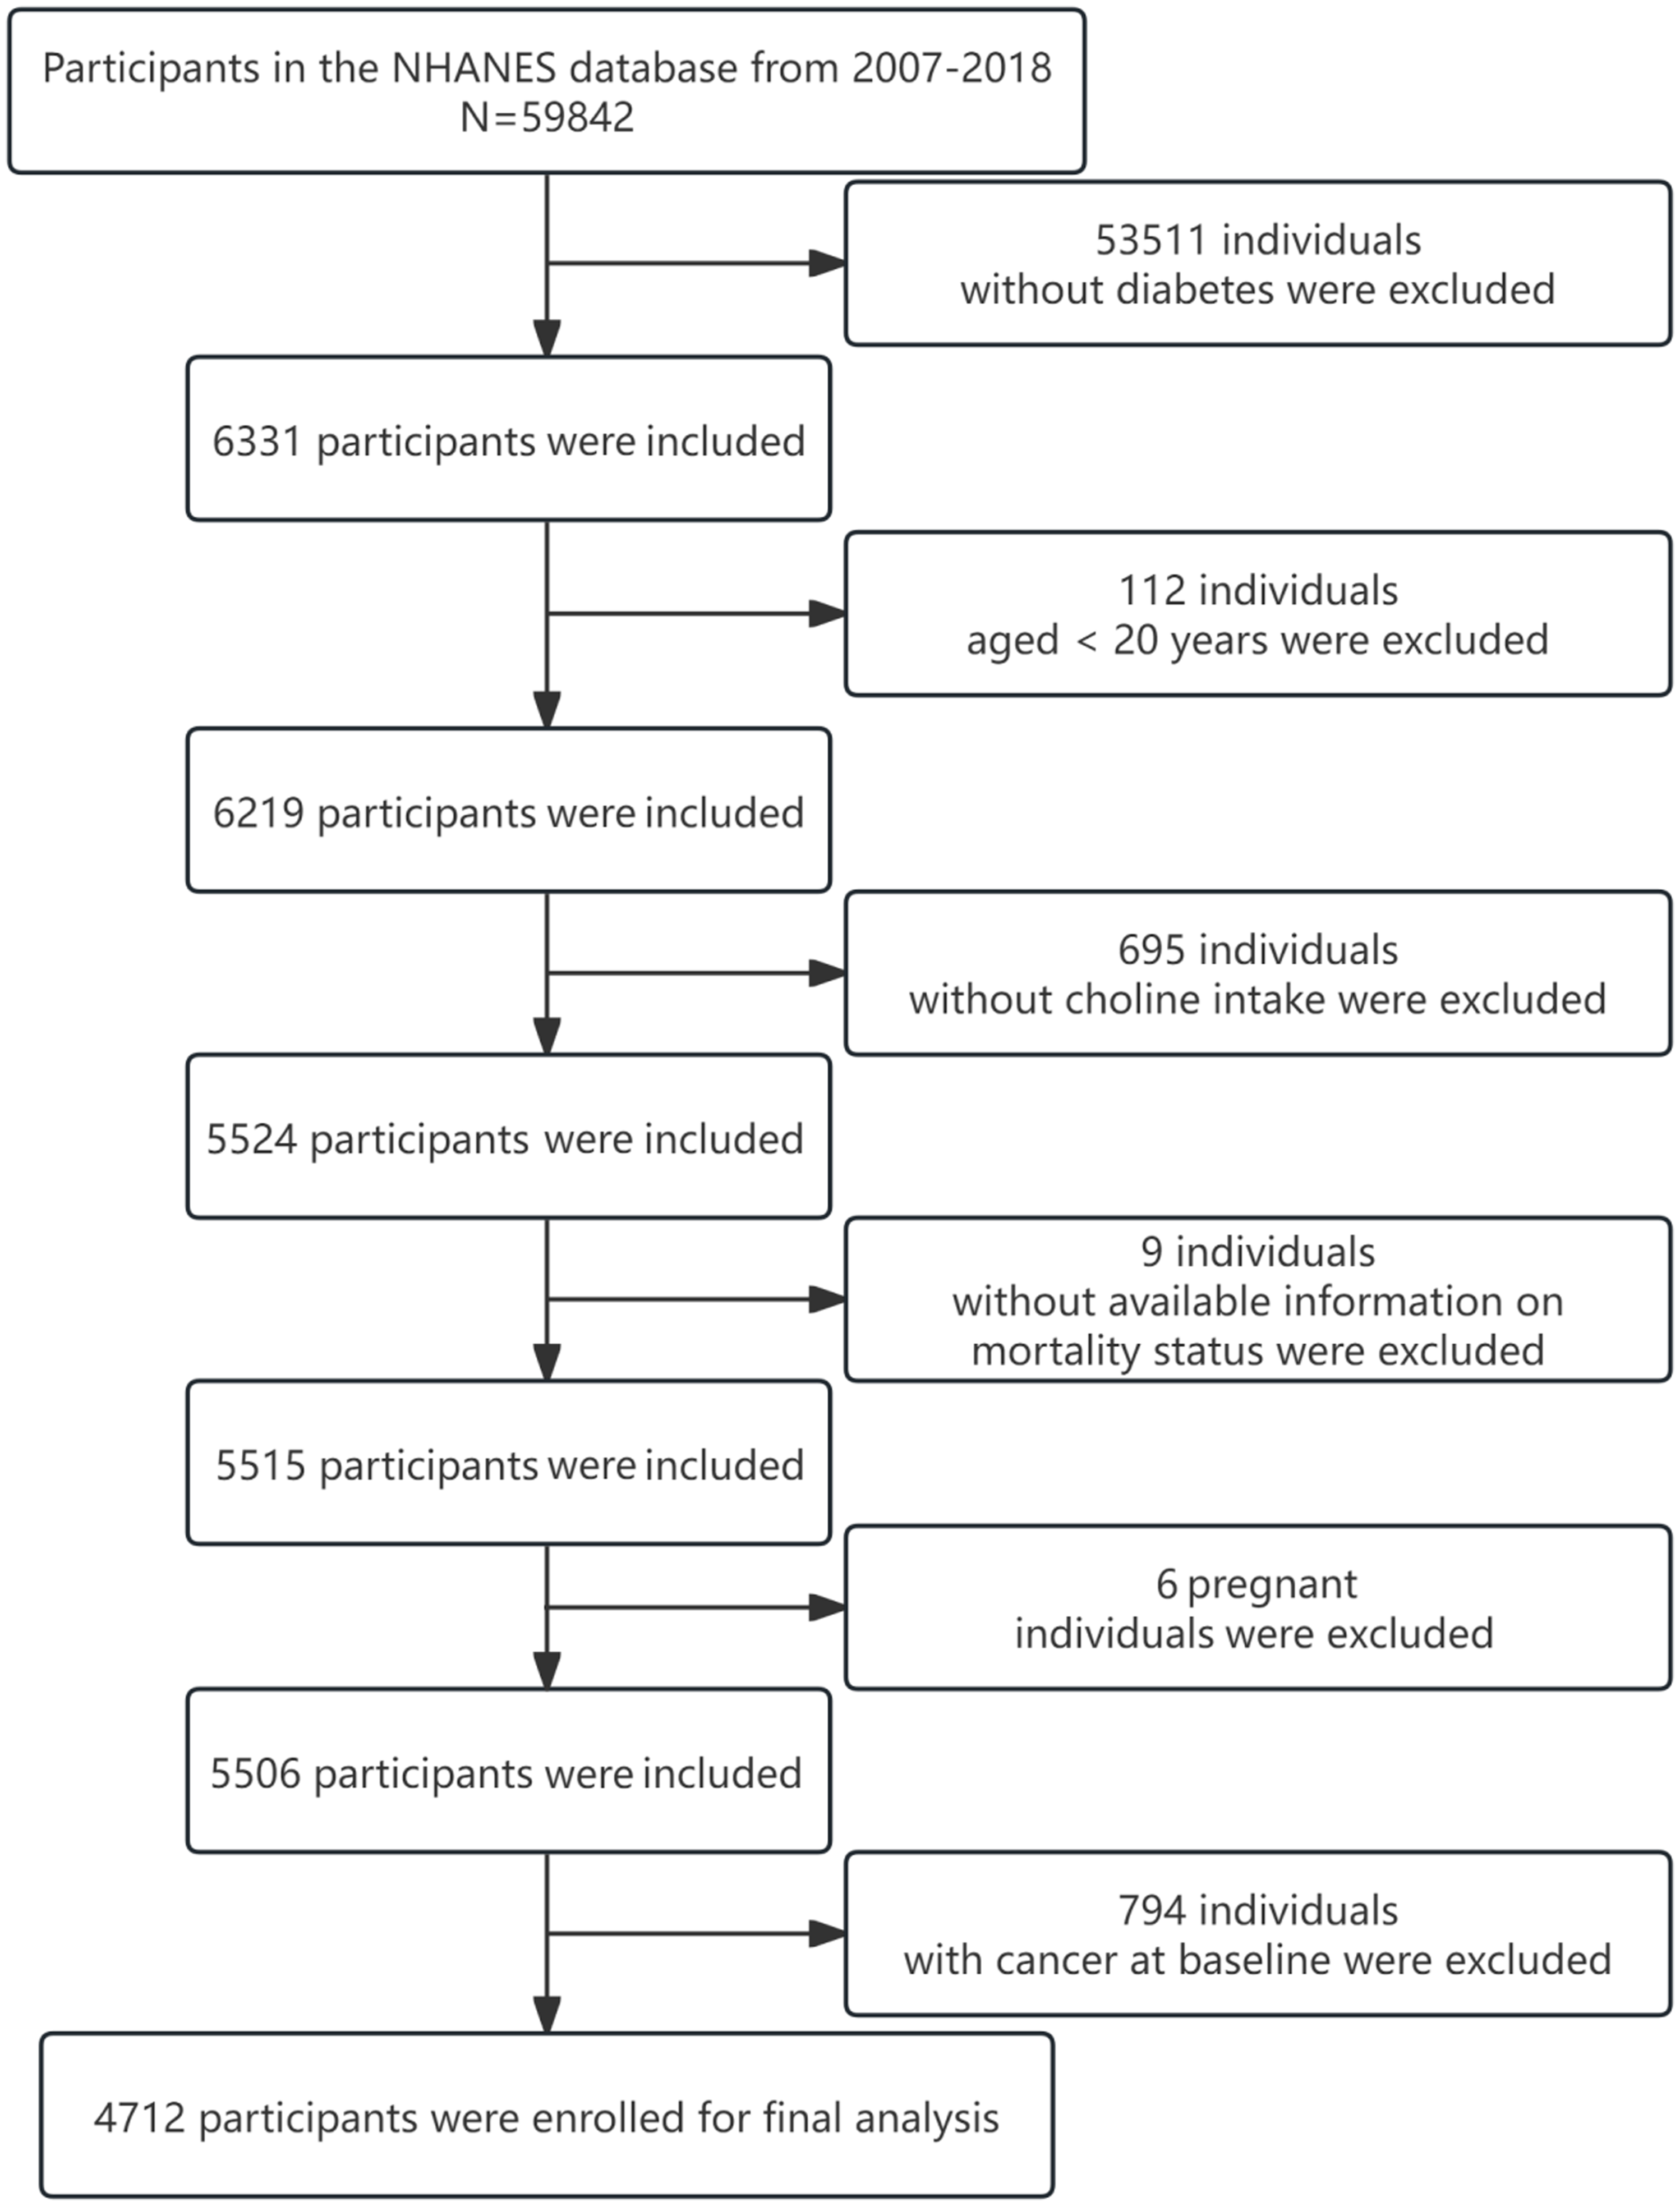
For the present analysis, six NHANES cycles from 2007 to 2018 were included, encompassing a total of 59 842 participants. Diabetes was defined in accordance with American Diabetes Association criteria as self-reported physician diagnosis, use of insulin or oral hypoglycaemic agents, fasting blood glucose ≥ 126 mg/dl or HbA1c ≥ 6·5 %(Reference Zou, Zhou and Zhu19). We excluded participants who were younger than 20 years, pregnant, missing dietary choline intake or follow-up data or who had a history of cancer at baseline. After applying these exclusion criteria, 4712 participants remained for the final analysis (Fig. 1).
Flow diagram of the screening and enrolment of study participants.

Measurement of dietary intake
Dietary intake data and supplement use were assessed by trained interviewers using two non-consecutive 24-h dietary recalls: the first conducted in person at a Mobile Examination Center and the second via telephone 3–10 d later. Dietary choline intake was calculated as the average of the two recalls; if only one recall was available, that value was used. Supplemental choline intake was estimated using the same approach. Total choline intake was defined as the sum of dietary and supplemental choline intake. Intakes of other nutrients, including fibre, vitamin B6, vitamin B12 and folate, were calculated similarly. Participants were categorised into quartiles (Q1–Q4) according to total choline intake, with Q1 serving as the reference group.
Ascertainment of mortality
As NHANES does not directly collect mortality data, this study utilised linked mortality records from the National Death Index, matched using a probabilistic algorithm and updated through 31 December 2019. Three endpoints were analysed: all-cause mortality, cardiovascular mortality and cancer mortality. Causes of death were classified according to the 10th Revision of the International Classification of Diseases. All-cause mortality included deaths from any cause. Cardiovascular mortality was defined as death due to heart disease (International Classification of Diseases-10 codes I00-I09, I11, I13, I20-I51) or cerebrovascular disease (I60-I69). Cancer mortality was defined as death due to any malignant neoplasm (C00-C97).
Other covariates
Covariates were selected based on clinical relevance and prior literature. Age was stratified into two groups: ≤ 59 years and ≥ 60 years. Race/ethnicity was categorised as Mexican American, other Hispanic, non-Hispanic White, non-Hispanic Black or other. Marital status was grouped as never married, married/cohabiting or previously married. Socioeconomic status was assessed using the poverty:income ratio, classified as low (≤ 1·3), middle (1·3–3·5) or high (> 3·5). Educational attainment was defined as less than high school, high school or equivalent and college or higher. Smoking status was categorised as never (< 100 cigarettes in lifetime), former (≥ 100 cigarettes but quit) or current (≥ 100 cigarettes and still smoking). Alcohol intake and total energy intake were estimated as the average of two 24-h dietary recalls, or the first recall alone if the second was unavailable. BMI (kg/m2) was grouped as normal (< 25), overweight (25–30) or obese (> 30). Physical activity levels were defined as inactive (none), insufficiently active (vigorous activity 1–3 d/week or moderate activity 1–5 d/week) and active (vigorous ≥ 3 d/week or moderate ≥ 5 d/week). Hypertension was defined by one or more of the following: self-reported diagnosis, antihypertensive medication use or mean blood pressure ≥ 140/90 mmHg(Reference Tan, Liu and Liu20). Dyslipidaemia was defined as any of the following: total cholesterol ≥ 200 mg/dl, TAG ≥ 150 mg/dl, HDL-cholesterol < 40 mg/dl in men or < 50 mg/dl in women or LDL-cholesterol ≥ 130 mg/dl. CVD was identified through self-reported history of congestive heart failure, CHD, myocardial infarction or stroke. Chronic obstructive pulmonary disease was defined as a self-reported physician diagnosis of chronic bronchitis or emphysema. Estimated glomerular filtration rate (eGFR) was calculated using the CKD-EPI equation(Reference Levey, Stevens and Schmid21). Glycemic control was evaluated via HbA1c, stratified as < 7 % or ≥ 7 %. Diabetes duration was categorised as ≤ 3 years, 3–10 years or > 10 years, based on self-reported diagnosis. Treatment regimen was classified as oral medication alone, insulin alone, combination therapy or no treatment.
Statistical analysis
All analyses accounted for the complex, multistage probability sampling design of NHANES by incorporating sample weights, primary sampling units and pseudo-strata, unless otherwise specified. Continuous variables were summarised as means (sd), and categorical variables were reported as unweighted frequencies with weighted percentages. Between-group comparisons were conducted using the Rao–Scott χ 2 test for categorical variables, one-way ANOVA for normally distributed continuous variables and the Kruskal–Wallis H test for non-normally distributed continuous variables.
Kaplan-Meier curves were used to estimate survival distributions across quartiles of total choline intake, with group differences assessed using the log-rank test. Associations between total choline intake and all-cause, cardiovascular and cancer-specific mortality were evaluated using multivariable Cox proportional hazards models with survey weights applied. Hazard ratios (HR) and 95 % CI were reported. Four models were constructed: model 1 was unadjusted; model 2 adjusted for age, sex, race/ethnicity, marital status, education and poverty:income ratio; model 3 further adjusted for alcohol consumption, smoking status, physical activity, caloric intake, fibre intake, vitamin B6 intake, vitamin B12 intake, folate intake and BMI and model 4 additionally included diabetes duration, glycaemic control (HbA1c), diabetes treatment type (none, oral medication, insulin or combination), eGFR, hypertension, dyslipidaemia and history of CVD or chronic obstructive pulmonary disease. Missing covariate data were handled using multiple imputation.
To assess the dose-response relationship between total choline intake and both all-cause and cause-specific mortality in people with diabetes, a fully adjusted restricted cubic spline model with four knots (at the 5th, 35th, 65th and 95th percentiles) was utilised. Nonlinearity was evaluated using the likelihood ratio test. If a non-linear relationship was detected, a two-segment Cox proportional hazards model was applied to each side of the inflection point to investigate the association between total choline intake and mortality risk. Additionally, threshold analysis was employed to identify the critical point of dietary choline intake associated with mortality risk. This study conducted stratified analyses using a fully adjusted model in the strata of gender (male or female), age (≤ 60 years or > 60 years), smoking status (never smoked, former smoker or current smoker), presence of obesity, hypertension or lipid metabolism disorder, duration of diabetes (≤ 3 years, 3–10 years or > 10 years), HbA1c levels (< 7 % or ≥ 7 %) and medication use (none, oral medication, insulin or both oral medication and insulin). The significance of interactions was assessed by calculating the P-value for the interaction terms between choline intake quartiles and the stratified variables.
Sensitivity analyses were conducted to test the robustness of findings by excluding participants who (i) died within the first 2 years of follow-up, (ii) had CVD at baseline or (iii) reported extreme choline intake levels (beyond ± 3 sd from the mean). All analyses were conducted using R software (v4·2·1), employing the ‘survey’ package to incorporate complex survey design features. Two-sided P-values < 0·05 were considered statistically significant.
Results
Baseline characteristics
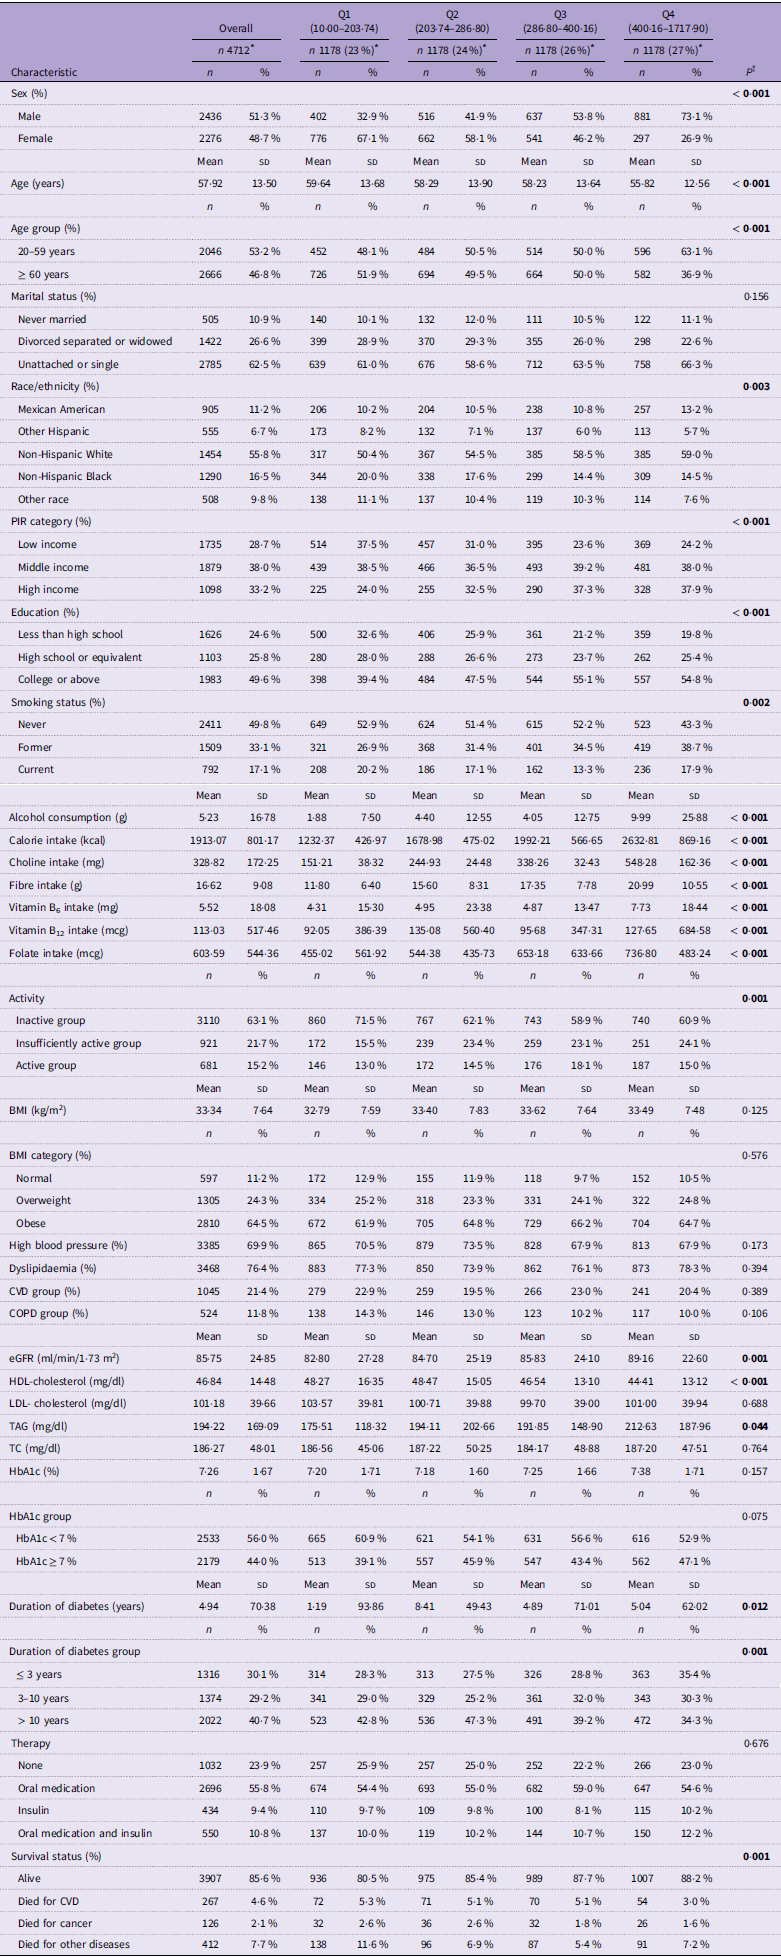
Table 1 summarises the baseline characteristics of 4712 adults (aged ≥ 20 years) with diabetes from the 2007–2018 NHANES cycles, stratified by quartiles of total choline intake: Q1 (10·00–203·74 mg/d), Q2 (203·74–286·80 mg/d), Q3 (286·80–400·16 mg/d) and Q4 (400·16–1717·90 mg/d). The overall mean age was 57·9 ± 13·5 years, and 51·3 % of participants were male. Individuals in the higher quartiles of choline intake were more likely to be younger (aged 20–59), male and of middle-income status, with higher educational attainment. They were also more frequently former or current smokers, reported higher alcohol and caloric intake and engaged in insufficient physical activity. Biochemically, these participants exhibited higher eGFR, elevated TAG levels and lower HDL-cholesterol levels. Additionally, they tended to have a shorter duration of diabetes. Over a median follow-up of 6·42 years, 805 deaths were recorded, including 267 from CVD, 126 from cancer and 412 from other causes.
Baseline characteristics of participants in the National Health and Nutrition Examination Survey 2007–2018

PIR, poverty:income ratio; COPD, chronic obstructive pulmonary disease; eGFR, estimated glomerular filtration rate; TC, total cholesterol.
* n (unweighted) (%); mean (sd).
† Rao–Scott χ 2 test for categorical variables, one-way ANOVA for normally distributed continuous variables, Kruskal–Wallis H test for skewed continuous variables.
Association between total choline intake and mortality
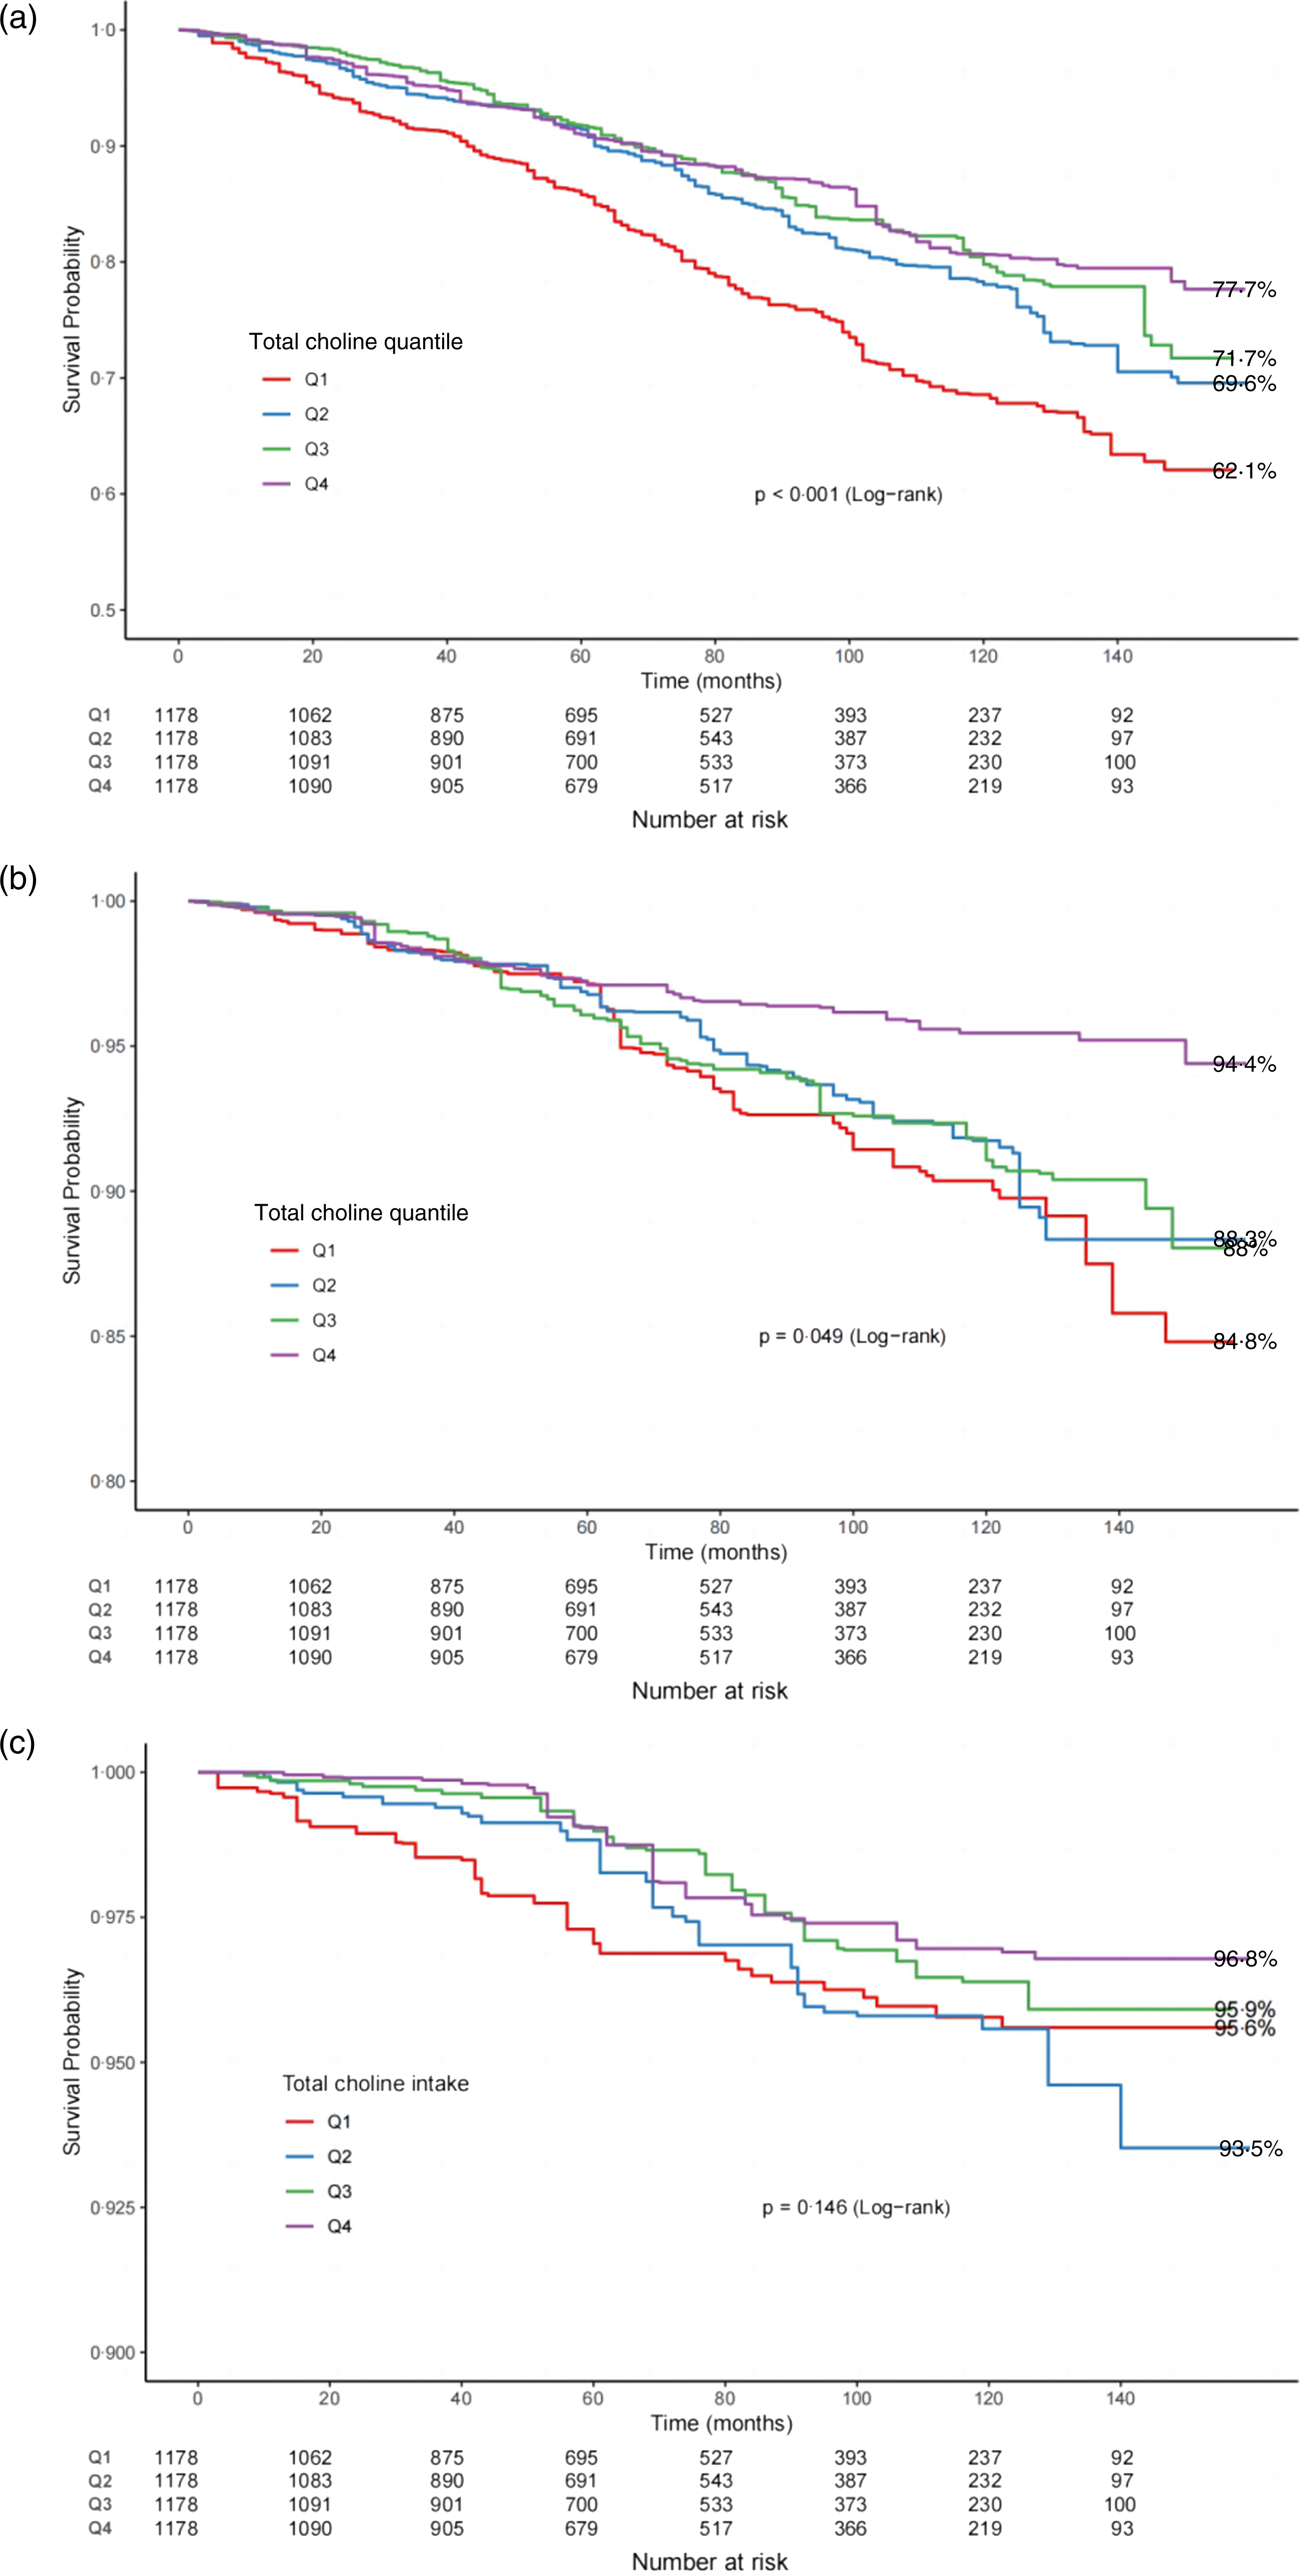
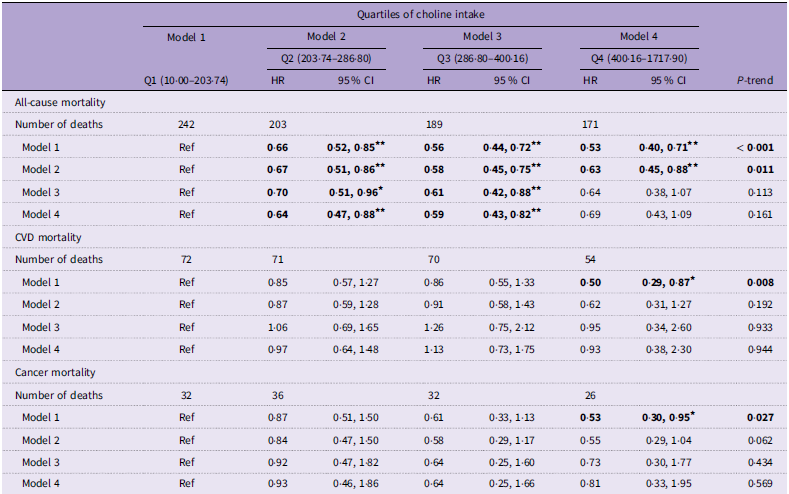
Participants were stratified into quartiles based on total choline intake (Q1–Q4). Kaplan–Meier survival curves revealed significant differences in all-cause and CVD mortality across quartiles (log-rank P < 0·05), with higher choline intake associated with lower mortality risk. No significant trend was observed for cancer-related mortality (log-rank P > 0·05) (Fig. 2). Given that Kaplan–Meier curves do not account for potential confounders, multivariable Cox proportional hazards models were employed to provide adjusted estimates. In the unadjusted model (model 1), total choline intake was inversely associated with all-cause mortality. Compared with the lowest quartile (Q1), the HR and 95 % CI for Q2–Q4 were 0·66 (0·52, 0·85), 0·56 (0·44, 0·72) and 0·53 (0·40, 0·71), respectively (P-trend < 0·001). This inverse association persisted after adjusting for sociodemographic factors in model 2 (P-trend = 0·013). In model 3, which additionally adjusted for lifestyle factors, dietary intake and BMI, only Q2 and Q3 remained statistically significant, with HR (95 % CI) of 0·70 (0·51, 0·96) and 0·61 (0·42, 0·88), respectively (P-trend = 0·113). These findings remained consistent in the fully adjusted model 4 (P-trend = 0·161). While unadjusted analyses also indicated reduced CVD and cancer-specific mortality risks in the highest choline intake groups – with HR (95 % CI) of 0·50 (0·29, 0·87) and 0·53 (0·30, 0·95), respectively (P-trend = 0·008 and 0·027) – these associations were attenuated and lost statistical significance after full adjustment for potential confounders (all P > 0·05) (Table 2).
The Kaplan–Meier survival curves for all-cause mortality (a), cardiovascular disease mortality (b) and cancer mortality (c) risks according to choline intake in people with diabetes.

Associations of total choline intake with all-cause, CVD and cancer mortality in patients with diabetes from the National Health and Nutrition Examination Survey 2007–2018 cohort

HR, hazard ratio; PIR, poverty:income ratio.
* P < 0·05, ** P < 0·01.
Model 1: unadjusted.
Model 2: adjusted for gender, age, ethnicity, marital status, education level and PIR.
Model 3: further adjusted for alcohol consumption, smoking status, physical activities, calorie intake, fibre intake, vitamin B6 intake, vitamin B12 intake, folate intake, BMI and covariates in model 2.
Model 4: adjusted for hypertension, dyslipidaemia, CVD, chronic obstructive pulmonary disease, estimated glomerular filtration rate, diabetes duration, HbA1c and therapy for diabetes based on model 3.
Bold values indicate statistical significance (P < 0·05).
The detection of non-linear relationships
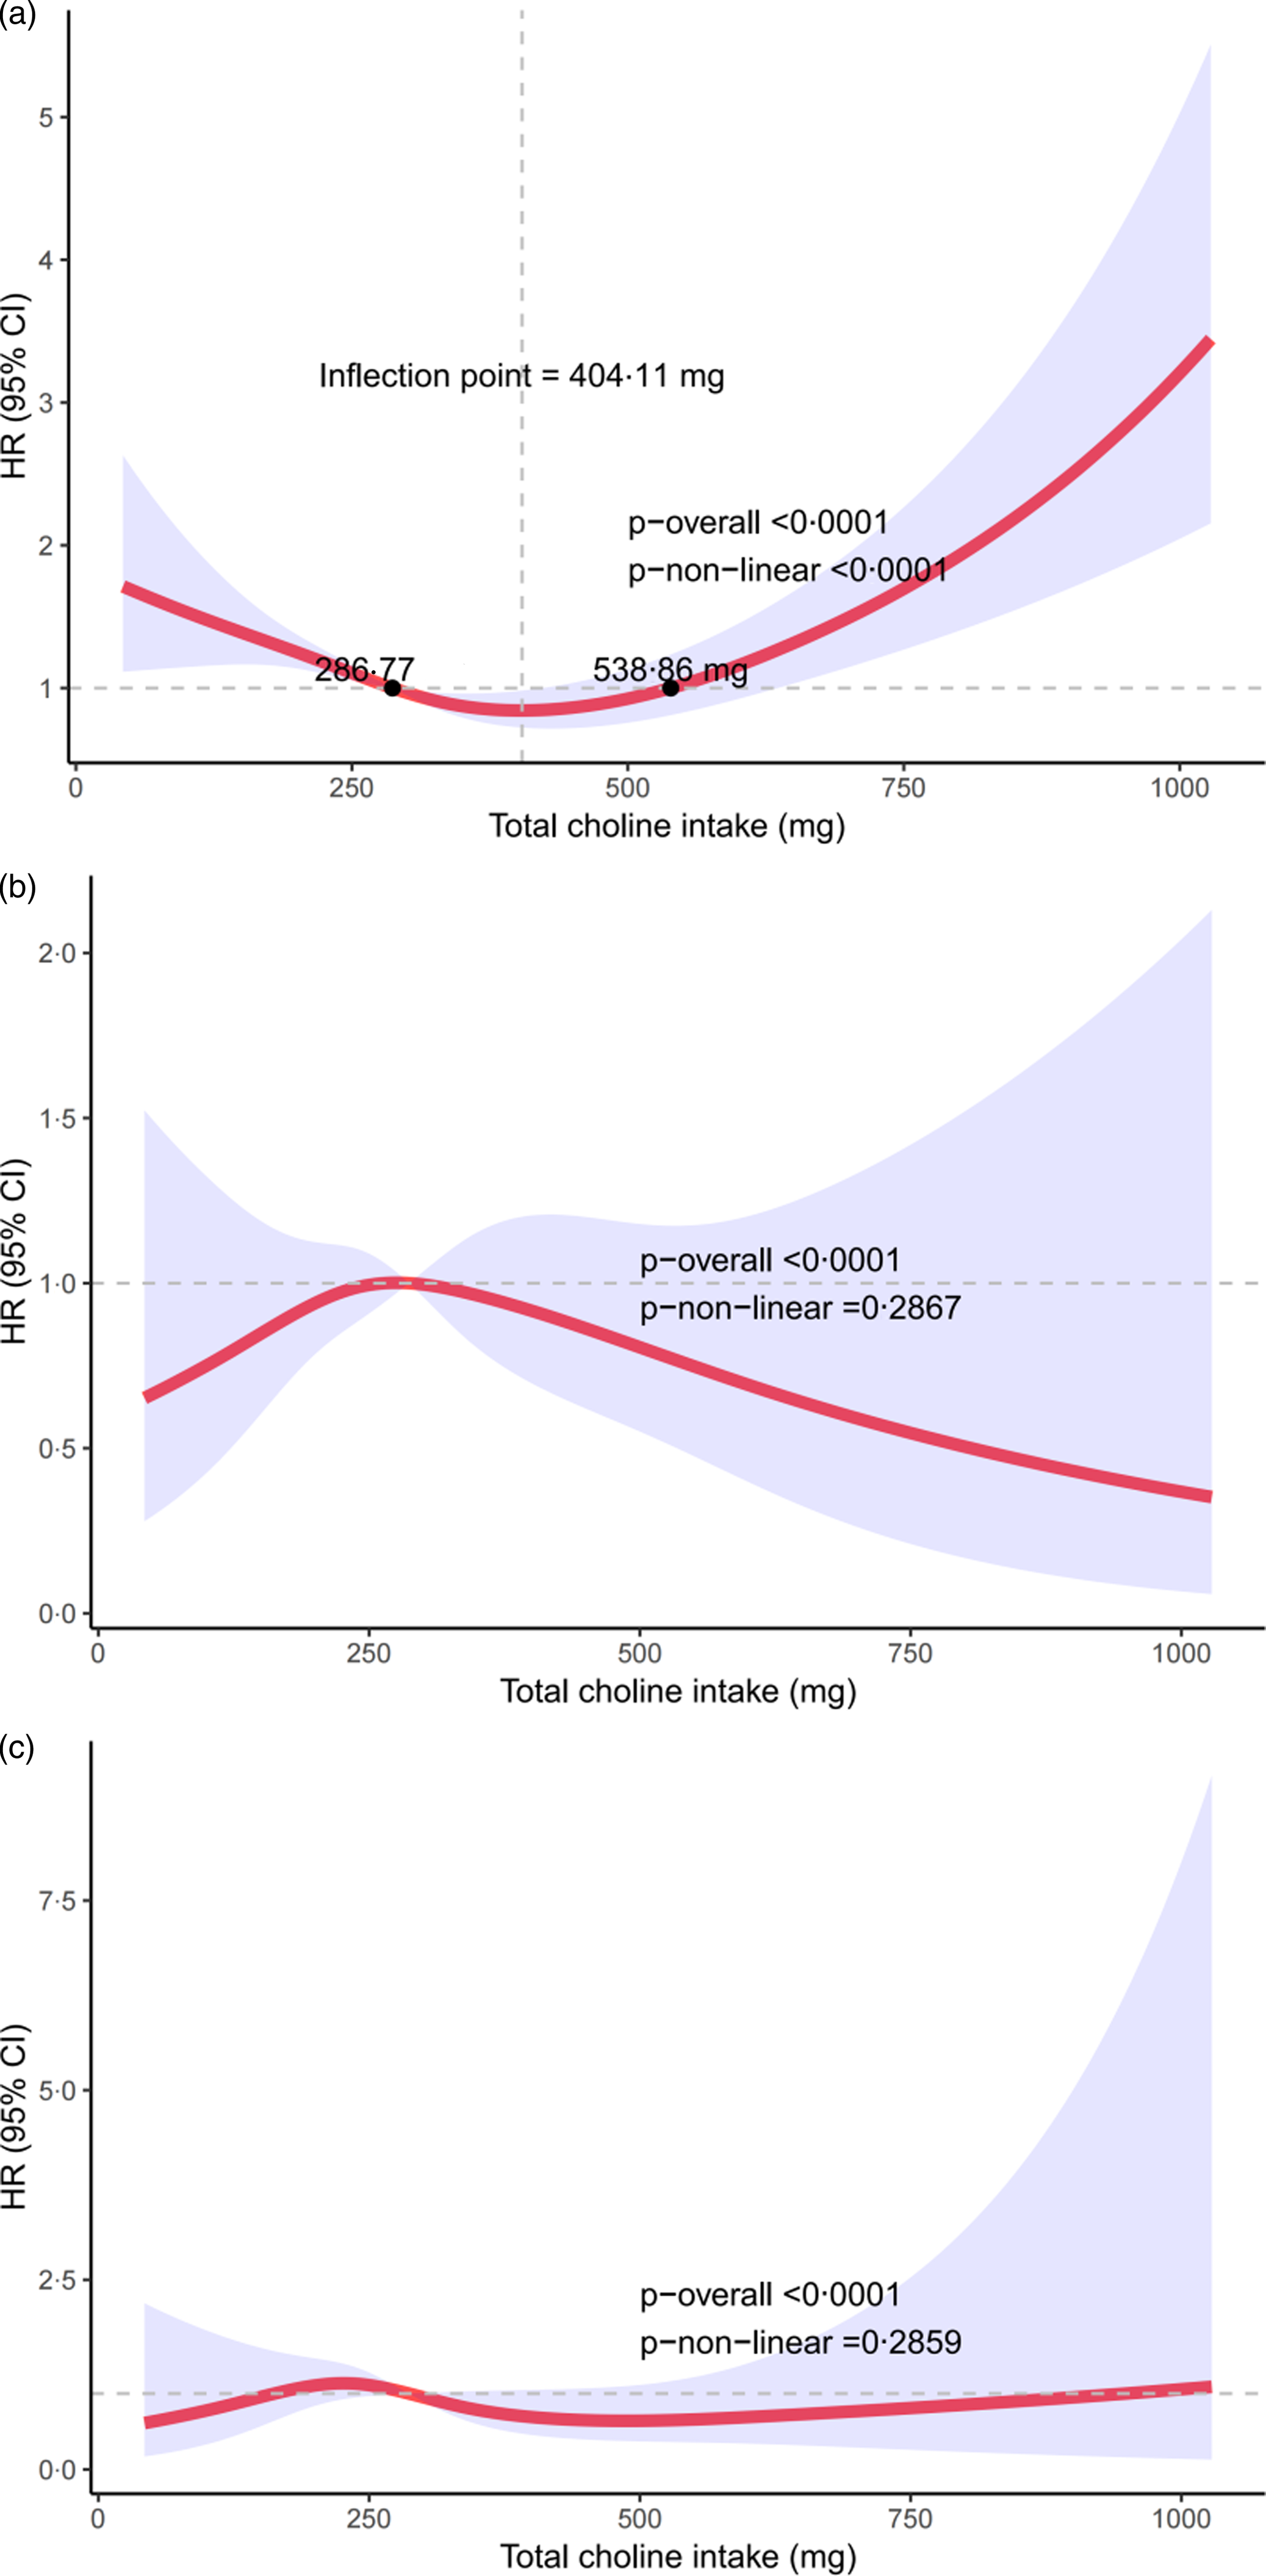
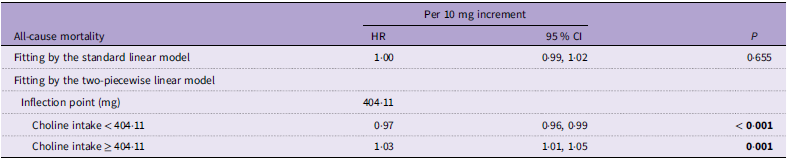
Multivariable Cox regression suggested a potential non-linear relationship between total choline intake and all-cause mortality among individuals with diabetes. To further explore this association, a restricted cubic spline analysis based on the fully adjusted model 4 was performed. The results revealed a U-shaped association between total choline intake and all-cause mortality, with an inflection point at 404·11 mg/d (P-overall < 0·0001; P-non-linearity < 0·0001) (Fig. 3(a)). Below this threshold, each 10 mg/d increase in choline intake was associated with a 3 % reduction in mortality risk (HR 0·97, 95 % CI 0·96, 0·99). Conversely, intake above 404·11 mg/d was associated with a 3 % increase in risk per 10 mg increment (HR 1·03, 95 % CI 1·01, 1·05) (Table 3). Threshold analysis further identified a relatively safe intake range of 286·77, 538·86 mg/d, within which the adjusted HR for all-cause mortality approximated 1·0. Intake levels falling below or exceeding this range were associated with a significantly elevated risk, suggesting a narrow window for optimal choline intake among individuals with diabetes (Fig. 3(a)). In contrast, restricted cubic spline analyses showed no evidence of a non-linear association between choline intake and CVD or cancer-specific mortality after full adjustment (P-overall < 0·0001; P-non-linearity > 0·05) (Fig. 3(b) and (c)).
The associations between choline intake and all-cause mortality (a), CVD mortality (b) and cancer mortality (c) in people with diabetes.

Threshold effect analysis of choline intake on the risk of all-cause mortality in people with diabetes

HR, hazard ratio.
Bold values indicate statistical significance (P < 0·05).
Stratified and sensitivity analyses
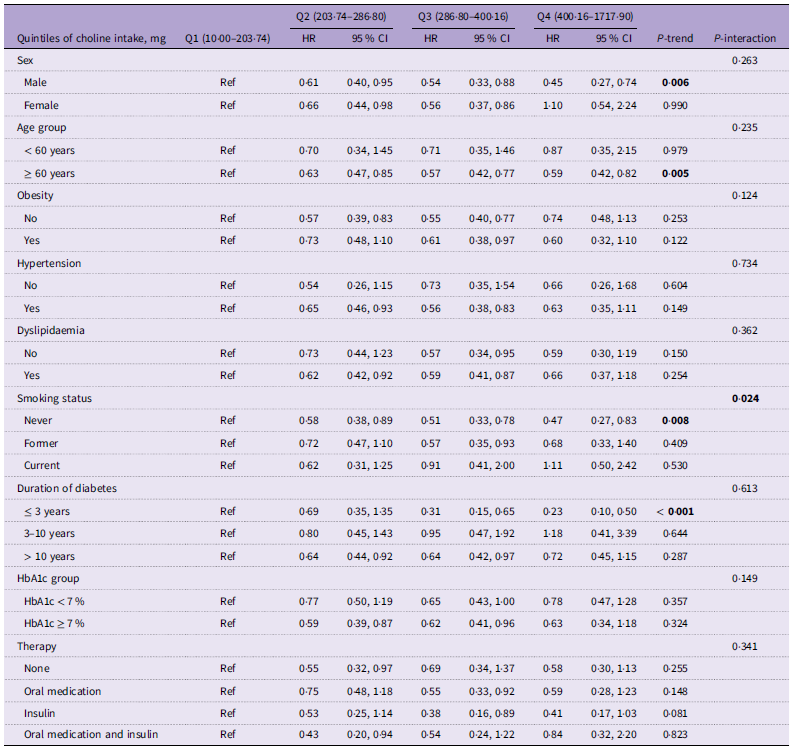
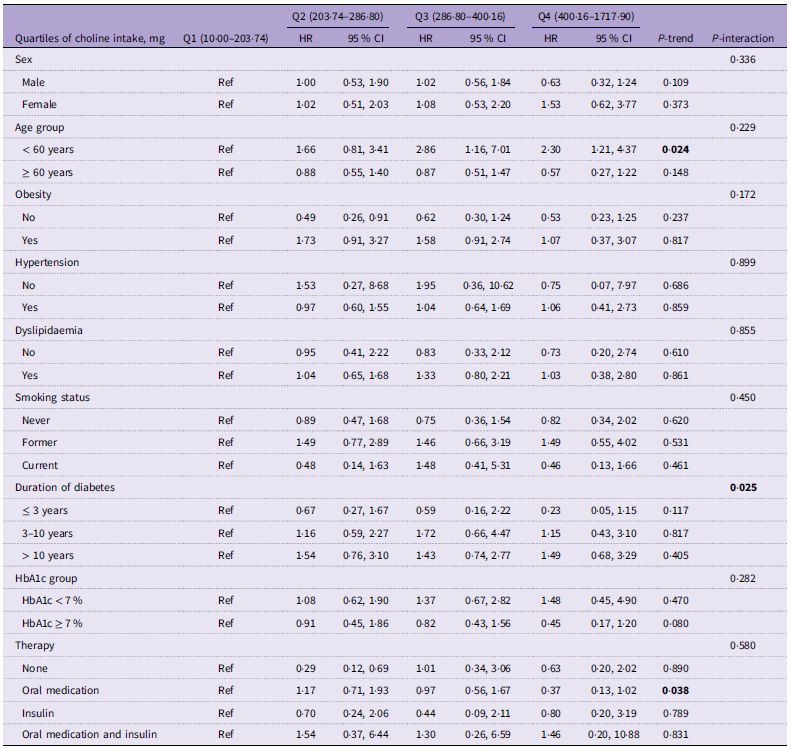
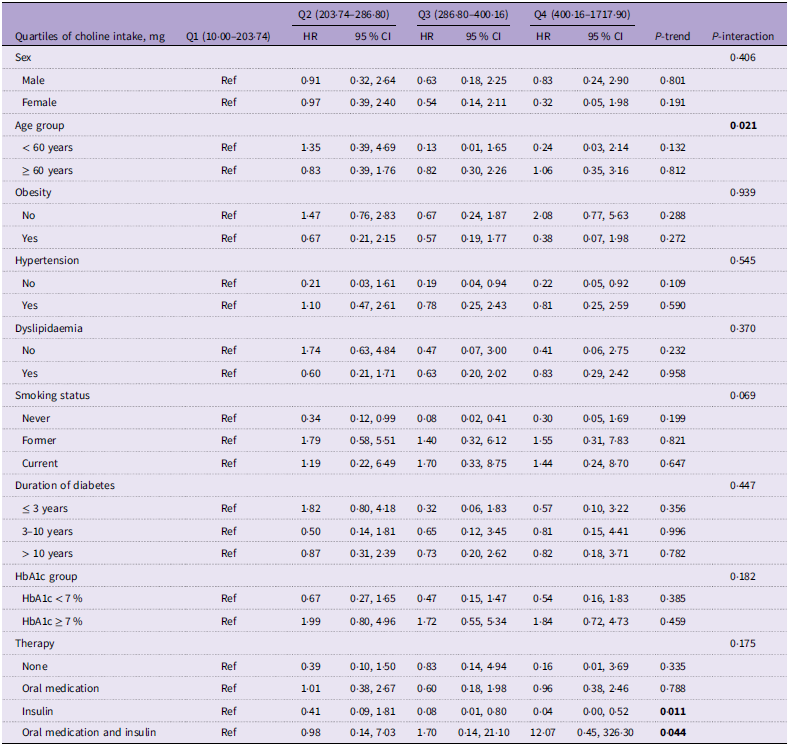
Following adjustment for all covariates in the fully adjusted model – excluding those used for stratification – stratified analyses revealed that the inverse association between total choline intake and all-cause mortality remained largely consistent across most subgroups (Table 4). A statistically significant interaction was observed between choline intake and smoking status (P-interaction < 0·05). Among individuals with diabetes who never smoked, higher choline intake was significantly associated with reduced all-cause mortality, with HR (95 % CI) for Q2 to Q4 v. Q1 of 0·58 (0·38, 0·89), 0·51 (0·33, 0·78), and 0·47 (0·27, 0·83), respectively (P-trend = 0·008). For former smokers, a protective association was observed primarily in Q3 (HR 0·57, 95 % CI 0·35, 0·93), while no significant trend was noted across quartiles (P-trend = 0·409). In contrast, among current smokers, no association between choline intake and all-cause mortality was observed, with HR (95 % CI) of 0·62 (0·31, 1·25), 0·91 (0·41, 2·00) and 1·11 (0·50, 2·42) for Q2 to Q4, respectively (P-trend = 0·530). For CVD mortality, a significant interaction was observed between choline intake and diabetes duration (Table 5), while for cancer mortality, a significant interaction emerged only with age (Table 6). However, these interactions did not materially alter the direction or strength of the associations, and no other stratified variables showed significant interaction effects.
Stratified analyses of the associations between choline intake and all-cause mortality among people with diabetes

HR, hazard ratio.
Adjusted for: gender, age, ethnicity, marital status, education level, poverty:income ratio, alcohol consumption, smoking status, physical activities, calorie intake, fibre intake, vitamin B6 intake, vitamin B12 intake, folate intake, BMI, hypertension, dyslipidaemia, CVD, chronic obstructive pulmonary disease, estimated glomerular filtration rate, diabetes duration, HbA1c and therapy for diabetes.
Bold values indicate statistical significance (P < 0·05).
Stratified analyses of the associations between choline intake and CVD mortality among people with diabetes

HR, hazard ratio.
Adjusted for: gender, age, ethnicity, marital status, education level, poverty:income ratio, alcohol consumption, smoking status, physical activities, calorie intake, fibre intake, vitamin B6 intake, vitamin B12 intake, folate intake, BMI, hypertension, dyslipidaemia, CVD, chronic obstructive pulmonary disease, estimated glomerular filtration rate, diabetes duration, HbA1c and therapy for diabetes.
Bold values indicate statistical significance (P < 0·05).
Stratified analyses of the associations between choline intake and cancer mortality among people with diabetes

HR, hazard ratio.
Adjusted for: gender, age, ethnicity, marital status, education level, poverty:income ratio, alcohol consumption, smoking status, physical activities, calorie intake, fibre intake, vitamin B6 intake, vitamin B12 intake, folate intake, BMI, hypertension, dyslipidaemia, CVD, chronic obstructive pulmonary disease, estimated glomerular filtration rate, diabetes duration, HbA1c and therapy for diabetes.
Bold values indicate statistical significance (P < 0·05).
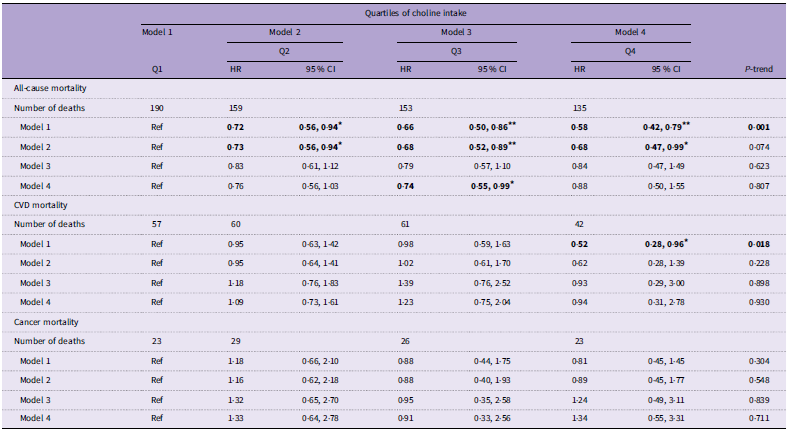
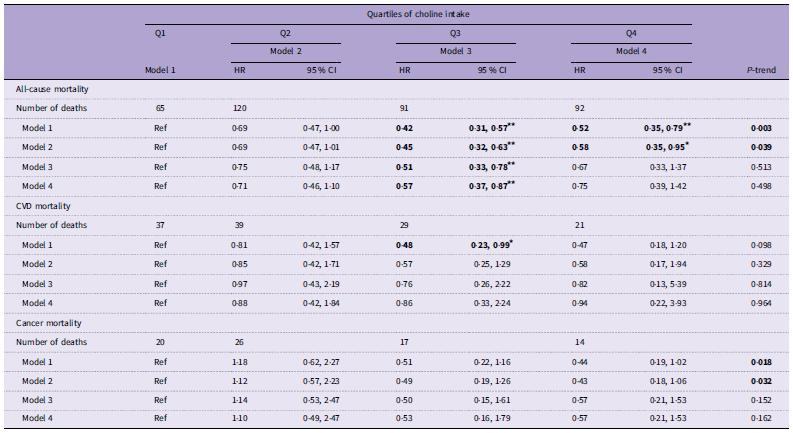
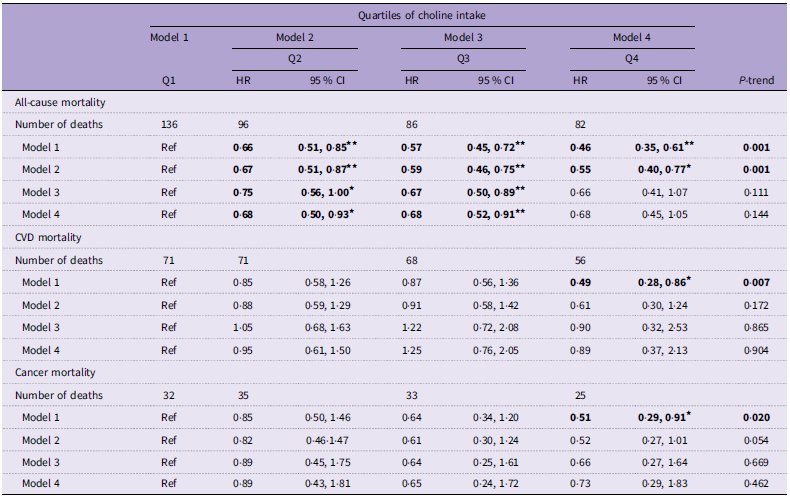
Sensitivity analyses supported the robustness of the findings. The inverse association between total choline intake and all-cause mortality persisted after excluding participants who died within the first 2 years of follow-up (Table 7). No significant associations were detected for CVD or cancer mortality in these sensitivity models. Additional exclusion of participants with baseline CVD or extreme choline intake values (defined as > mean ± 3 sd) also did not materially alter the results (Tables 8 and 9).
Association between dietary choline intake and all-cause mortality, CVD mortality and cancer mortality by excluding deaths during 2 years of follow-up (n 4544)

HR, hazard ratio.
*P < 0·05, **P < 0·01.
Model 1: unadjusted.
Model 2: adjusted for gender, age, ethnicity, marital status, education level and poverty:income ratio.
Model 3: further adjusted for alcohol consumption, smoking status, physical activities, calorie intake, fibre intake, vitamin B6 intake, vitamin B12 intake, folate intake, BMI and covariates in model 2.
Model 4: adjusted for hypertension, dyslipidaemia, CVD, chronic obstructive pulmonary disease, estimated glomerular filtration rate, diabetes duration, HbA1c and therapy for diabetes based on model 3.
Bold values indicate statistical significance (P < 0·05).
Association between dietary choline intake and all-cause mortality, CVD mortality and cancer mortality by excluding participants with CVD at baseline (n 3667)

HR, hazard ratio.
* P < 0·05, ** P < 0·01.
Model 1: unadjusted.
Model 2: adjusted for gender, age, ethnicity, marital status, education level and poverty:income ratio.
Model 3: further adjusted for alcohol consumption, smoking status, physical activities, calorie intake, fibre intake, vitamin B6 intake, vitamin B12 intake, folate intake, BMI and covariates in model 2.
Model 4: adjusted for hypertension, dyslipidaemia, chronic obstructive pulmonary disease, estimated glomerular filtration rate, diabetes duration, HbA1c and therapy for diabetes based on model 3.
Bold values indicate statistical significance (P < 0·05).
Association between dietary choline intake and all-cause mortality, CVD mortality and cancer mortality by excluding extreme choline intake (n 4651)

HR, hazard ratio.
*P < 0·05, **P < 0·01.
Model 1: unadjusted.
Model 2: adjusted for gender, age, ethnicity, marital status, education level and poverty:income ratio.
Model 3: further adjusted for alcohol consumption, smoking status, physical activities, calorie intake, fibre intake, vitamin B6 intake, vitamin B12 intake, folate intake, BMI and covariates in model 2.
Model 4: adjusted for hypertension, dyslipidaemia, chronic obstructive pulmonary disease, estimated glomerular filtration rate, diabetes duration, HbA1c and therapy for diabetes based on model 3.
Bold values indicate statistical significance (P < 0·05).
Discussion
This study is the first to specifically investigate the association between total choline intake and both all-cause and cause-specific mortality among individuals with diabetes. Our findings reveal a significant U-shaped, non-linear relationship between choline intake and all-cause mortality, with an inflection point at 404·11 mg/d. This suggests that both insufficient and excessive choline intake are associated with elevated mortality risk in this population. After adjustment for a comprehensive set of covariates, no significant associations were observed between choline intake and either CVD or cancer mortality. Stratified and sensitivity analyses further supported the robustness of these findings.
Previous studies in the general population have reported heterogeneous results regarding the association between dietary choline and mortality. Of these, only Peng et al. (Reference Jieru, Zhang and Cai16) reported a non-linear relationship similar to that observed in our study. Several factors may account for the inconsistencies across studies, including differences in geographic regions, racial and ethnic backgrounds, dietary patterns, sample sizes, analytical methods and the selection and adjustment of confounders. Additionally, the distinct metabolic profiles and comorbidities in people with diabetes may influence the relationship between choline intake and mortality, thereby limiting the generalisability of findings from the general population to this subgroup. Notably, although the US National Academy of Medicine recommends an adequate intake of 550 mg/d for men and 425 mg/d for women to prevent choline deficiency, our threshold analysis suggests that for people with diabetes, a daily intake between 286·77 and 538·86 mg is associated with the lowest risk of all-cause mortality. Intake levels outside this range were linked to significantly higher mortality risks. These results suggest that current dietary recommendations based on the general population may not be optimal for individuals with diabetes, highlighting the need for tailored nutritional guidance.
Several biological mechanisms may explain the observed associations. Choline is a precursor for a range of metabolites, including acetylcholine, phosphatidylcholine, betaine, trimethylamine and glycerophosphocholine(Reference Zeisel and Da6). Phosphatidylcholine plays a critical role in lipid metabolism and transport, and insufficient choline intake may contribute to lipid dysregulation, which is strongly associated with increased mortality risk(Reference Tso, Kendrick and Balint22–Reference Nordestgaard24). Additionally, betaine – derived from choline – is essential for homocysteine remethylation via the betaine-homocysteine methyltransferase pathway(Reference Hajer, van der Graaf and Olijhoek25). Inadequate choline intake may thus result in elevated homocysteine levels, which have been implicated in CVD, cancer and increased mortality risk(Reference Azzini, Ruggeri and Polito26–Reference Vollset, Refsum and Tverdal28). Furthermore, low choline intake has been linked to elevated inflammatory markers such as C-reactive protein, IL-6 and TNF-alpha, indicating enhanced systemic inflammation that may exacerbate disease progression and mortality risk(Reference Detopoulou, Panagiotakos and Antonopoulou29,Reference Zhang, Fan and Xu30) . However, excessive choline intake can also have detrimental effects. It has been associated with increased inflammation and oxidative stress, as detailed below. Dietary choline is metabolised by gut microbiota into trimethylamine, which is subsequently converted in the liver to trimethylamine-N-oxide(Reference Wang, Klipfell and Bennett31). Elevated levels of trimethylamine-N-oxide, resulting from excessive choline intake, have been linked to a heightened risk of CVD and mortality(Reference Li, Lu and Yuan32,Reference Wang, Li and Wang33) . Furthermore, excessive choline intake can disrupt the balance of gut microbiota, leading to the production of abnormal metabolic byproducts that may induce inflammation and contribute to various health complications(Reference Li, Wu and Cao34). Interestingly, this study found no association between total choline intake and CVD or cancer mortality in people with diabetes. This finding may be attributed to the relatively low number of CVD and cancer-related deaths in the study.
Importantly, we identified a significant interaction between choline intake and smoking status. Among individuals with diabetes who never smoked, higher choline intake was associated with a markedly reduced risk of all-cause mortality. This inverse association was less pronounced and statistically non-significant among former smokers and entirely absent in current smokers. Smoking is known to impair liver function and alter gut microbiota composition, potentially disrupting choline metabolism and mitigating its protective effects(Reference El-Zayadi35–Reference van der Vaart, Postma and Timens37). The oxidative stress and chronic inflammation triggered by smoking may weaken or nullify the protective role of choline in both former and current smokers. Additionally, variations in baseline characteristics, comorbidities and lifestyle factors across smoking statuses may influence the relationship between choline intake and all-cause mortality. In current smokers, the small sample size may have resulted in insufficient statistical power, also possibly explaining the lack of significant associations observed. Regarding cardiovascular mortality, a significant interaction was observed between the duration of diabetes and choline intake. Similarly, for cancer mortality, an interaction was noted between age and choline intake. Despite these interactions, the associations between total choline intake and both cardiovascular and cancer mortality remained non-significant within each subgroup. This phenomenon may be attributed to insufficient statistical power, the complexity of the interaction, non-linear relationships or other unadjusted confounding factors.
However, this study has several limitations. First, choline intake was assessed using two 24-h dietary recalls, which may introduce recall bias and affect the results. Second, data on choline intake and covariates were collected only at baseline, whereas these factors may have varied during the follow-up period, potentially weakening the observed associations between choline intake and mortality risk. Additionally, despite adjusting for a broad range of potential confounders, residual confounding from unknown factors cannot be entirely excluded. Lastly, this study’s observational nature precludes the establishment of causal relationships, underscoring the need for future interventional studies to elucidate these associations further.
Conclusions
This study identified a U-shaped non-linear relationship between dietary choline intake and all-cause mortality risk in people with diabetes, with an inflection point at 404·11 mg/d. Choline intake within the range of 286·77–538·86 mg/d is associated with a reduced risk of all-cause mortality. These findings provide new scientific evidence to inform dietary recommendations for people with diabetes and underscore the need for a more nuanced approach to nutrient management in future diabetes care.
Acknowledgements
The authors would like to thank the NHANES participants and the staff members for their contribution to data collection and for making the data publicly available.
This research did not receive any specific grant from funding agencies in the public, commercial or not-for-profit sectors.
M. Y.: Conceptualisation, Formal analysis, Methodology, Visualisation, Writing – original draft. Y. H.: Conceptualisation, Methodology, Writing – original draft. Y. X.: Methodology, Visualisation. Z. Z.: Methodology, Visualisation. L. Y.: Writing – review & editing. Q. L.: Conceptualisation, Methodology, Writing – review & editing.
The authors declare that they have no competing interests.