1 Introduction
Cross-flow past a cylindrical object has been attracting many researchers’ attention for decades (Braza, Chassaing & Minh Reference Braza, Chassaing and Minh1986; Saiki & Biringen Reference Saiki and Biringen1996; Park, Kwon & Choi Reference Park, Kwon and Choi1998; Sohankar, Norberg & Davidson Reference Sohankar, Norberg and Davidson1998; Kim, Yang & Senda Reference Kim, Yang and Senda2004; Sharma & Eswaran Reference Sharma and Eswaran2004; De & Dalal Reference De and Dalal2006; Yoon, Yang & Choi Reference Yoon, Yang and Choi2010), not only due to its academic significance, but also due to its industrial applications, such as heat exchangers, bridge piers, skyscrapers and subsea production systems, to name a few. The cross-flow induces pressure and friction distributions on the object surface, consequently resulting in a net force exerted on the object. Since intense fluctuation of pressure force originated from the flow-induced force may cause severe acoustic noise or structural damage, understanding of flow instabilities associated with cross-flow past a cylindrical object has been a persistent issue in the fluid-mechanics community in order to control the flow properly (Williamson Reference Williamson1988, Reference Williamson1996; Zhang et al. Reference Zhang, Fey, Noack, Konig and Eckelmann1995; Barkley & Henderson Reference Barkley and Henderson1996; Robichaux, Balachandar & Vanka Reference Robichaux, Balachandar and Vanka1999; Blackburn & Lopez Reference Blackburn and Lopez2003; Sheard, Thompson & Hourigan Reference Sheard, Thompson and Hourigan2003). In particular, circular or square cylinders have been intensively considered because of their simple geometry. Williamson (Reference Williamson1988, Reference Williamson1996) experimentally studied the secondary instability leading to three-dimensionality of a circular-cylinder wake, reporting the characteristics of modes A and B. Barkley & Henderson (Reference Barkley and Henderson1996) performed three-dimensional (3D) Floquet stability analysis of the wake of a circular cylinder, and obtained the criticalities of Reynolds number (Re) and spanwise wavelength of the 3D modes, consistent with those of Williamson (Reference Williamson1988, Reference Williamson1996). Persillon & Braza (Reference Persillon and Braza1998) carried out direct numerical simulation (DNS) of the flow past a circular cylinder in the Re range of 100–300, and found that the frequency discontinuity region is associated with a discontinuity in the total kinetic energy distribution in the near wake. Robichaux et al. (Reference Robichaux, Balachandar and Vanka1999) performed Floquet stability analysis of the wake of a square cylinder, and found 3D modes A and B with temporal and spatial characteristics similar to those in the circular-cylinder case. Furthermore, they reported the existence of a subharmonic mode, but later it was found to be of quasi-periodic nature and termed mode QP by Blackburn & Lopez (Reference Blackburn and Lopez2003).
Three-dimensional instability has also been studied for various cylindrical flow configurations other than circular or square cylinders. Zhang et al. (Reference Zhang, Fey, Noack, Konig and Eckelmann1995) found mode C that has different characteristic features from those of A or B by using a thin wire in the wake of a circular cylinder. Sheard et al. (Reference Sheard, Thompson and Hourigan2003) and Sheard, Fitzgerald & Ryan (Reference Sheard, Fitzgerald and Ryan2009) reported that mode C of subharmonic nature occurs in bluff-ring wakes or in the flow past an asymmetric cylinder such as an inclined square cylinder. Their results on the latter were subsequently verified in a different way by Yoon et al. (Reference Yoon, Yang and Choi2010) and Yoon, Yang & Choi (Reference Yoon, Yang and Choi2012), who used the one-dimensional (1D) power-type method to compute the Floquet multiplier of maximum magnitude. Blackburn & Sheard (Reference Blackburn and Sheard2010) showed that mode C turns to QP through recovering symmetry by using the locus of the Floquet multiplier, bridging the gap between C and QP. Recently, Floquet stability analysis was performed for a wide variety of wakes including the wakes of two tandem square cylinders (Choi, Jang & Yang Reference Choi, Jang and Yang2012), two side-by-side square cylinders (Choi & Yang Reference Choi and Yang2013), an inclined flat plate (Yang et al. Reference Yang, Pettersen, Andersson and Narasimhamurthy2013), a rectangular cylinder ranging from a normal flat plate to a square cylinder (Choi & Yang Reference Choi and Yang2014), and an elliptical cylinder (Leontini, Jacono & Thompson Reference Leontini, Jacono and Thompson2014), contributing to the existing pool of knowledge on the 3D instability.
The present numerical study aims at elucidating the effect of rounding the sharp edges of a square cylinder on the flow instabilities in the laminar regime. The key parameters are the Reynolds number (Re) and the edge-radius ratio (
 $r/d$
). Here, rounding the sharp edges was done by inscribing a quarter circle of radius
 $r$
in each edge of a square cylinder of height
 $d$
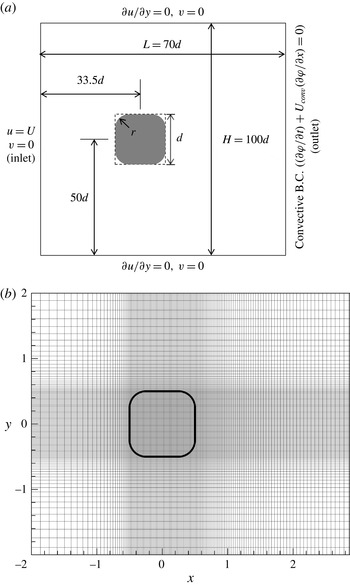
(figure 1
a), resulting in rounded cylinders ranging from a square cylinder (
 $r/d=0$
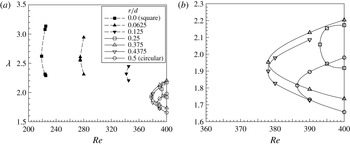
) to a circular cylinder (
 $r/d=0.5$
). Nine cases of
 $r/d$
were considered in total with an increment of 0.0625. The rounded cylinders were implemented in a Cartesian grid system by using an immersed boundary method (Yang & Balaras Reference Yang and Balaras2006). The laminar regime allows us to take a close look at the change of flow topology depending on
 $r/d$
. Consequently, how the criticalities of the primary (Hopf bifurcation) and the secondary (3D) instabilities are affected by rounding can be identified, revealing the essential clues to controlling cross-flow past a cylindrical object for engineering purposes. We study the
 $r/d$
dependence of the criticalities of the primary and secondary instabilities by using the Stuart–Landau (SL) equation and Floquet stability analysis, respectively. The present results bridge the two most popular cylindrical flow configurations, namely, flow past a square cylinder and flow past a circular cylinder, by clarifying the missing instability connection between the two.
Flow configuration and grid system for two-dimensional (2D) base flow: (a) schematic of the computational domain and the imposed boundary conditions; (b) magnified view of the grid system in the vicinity of a rounded cylinder.

2 Formulation and numerical methods
The governing equations for incompressible flow, modified for the immersed boundary method, are as follows:
 $$\begin{eqnarray}\displaystyle & \boldsymbol{{\rm\nabla}}\boldsymbol{\cdot }\boldsymbol{u}=0, & \displaystyle\end{eqnarray}$$
 $$\begin{eqnarray}\displaystyle & \displaystyle \frac{\partial \boldsymbol{u}}{\partial t}+\boldsymbol{{\rm\nabla}}\boldsymbol{\cdot }\left(\boldsymbol{u}\boldsymbol{u}\right)=-\boldsymbol{{\rm\nabla}}\boldsymbol{p}+\frac{1}{Re}{\rm\nabla}^{2}\boldsymbol{u}+\boldsymbol{f}, & \displaystyle\end{eqnarray}$$
where
 $\boldsymbol{u}$
,
 $\boldsymbol{p}$
and
 $\boldsymbol{f}$
represent the velocity vector, with its streamwise (
 $u$
), normal (
 $v$
) and spanwise (
 $w$
) components, the pressure and the momentum forcing, respectively. All the physical variables were non-dimensionalized by the inlet uniform velocity
 $(U)$
and
 $d$
. The Reynolds number is also based on
 $U$
and
 $d$
. The governing equations were discretized by a finite-volume method on a non-uniform staggered Cartesian grid system (figure 1
b). Spatial discretization is second-order accurate. A hybrid scheme was used for time advancement; nonlinear terms were explicitly advanced by a third-order Runge–Kutta scheme, and the diffusion terms were implicitly advanced by the Crank–Nicolson method (Yang Reference Yang2000). A fractional step method (Kim & Moin Reference Kim and Moin1985; Yang Reference Yang2000) was employed to decouple the continuity and momentum equations. The Poisson equation that resulted from the second stage of the fractional step method was solved by a V-cycle multigrid method (Briggs, Henson & McCormick Reference Briggs, Henson and McCormick2000). The immersed boundary method with marker particles (Yang & Balaras Reference Yang and Balaras2006) was adopted for implementation of the various cylinder cross-sections in a Cartesian grid system.
Two-dimensional (2D) base flow was computed with the following boundary conditions (figure 1
a). The no-slip condition was imposed on the cylinder surface. A Dirichlet boundary condition
 $(u=U,v=0)$
was used at the inlet boundary of the computational domain, while a convective boundary condition (Kim et al.
Reference Kim, Yang and Senda2004) was employed at the outlet (
 $\partial {\it\varphi}/\partial t+U_{conv}\partial {\it\varphi}/\partial x=0$
, where
 $U_{conv}$
is the mean streamwise velocity at the outlet and
 ${\it\varphi}$
is any physical variable convected out through the outlet). A slip boundary condition
 $(\partial u/\partial y=0,v=0)$
was imposed at the other boundaries. The entire computational domain was defined with
 $-33.5d\leqslant x\leqslant 36.5d$
and
 $-50d\leqslant y\leqslant 50d$
. Here, the origin of the coordinate system is located at the centre of the cylinder. It is important to set up the right size of the computational domain. In particular, if the transverse size is too small, the flow is unrealistically accelerated due to the blockage effect, resulting in reduced transverse distance of the shed vortices, and increased drag and shedding frequency. Therefore, a parametric study with various transverse lengths was carried out, and
 $H/d=100$
was adopted, above which the force coefficients and the shedding frequency do not change up to four significant digits. The numerical resolution was determined by a grid refinement study to ensure grid independence. The number of cells used was
 $800\times 448$
in
 $x$
and
 $y$
directions, respectively. For the cylinder,
 $128\times 128$
cells were allocated. The square cylinder (
 $r/d=0$
) and the circular cylinder (
 $r/d=0.5$
) are the two extreme cases.
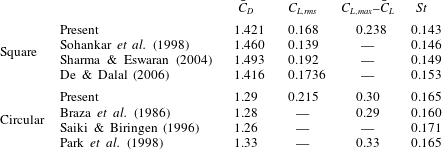
To validate our code and numerical methodology, mean force coefficients and the Strouhal number of vortex shedding for flow past a square cylinder and for flow past a circular cylinder at
 $Re=100$
were computed, respectively, and then compared with the results of other authors for the square (Sohankar et al.
Reference Sohankar, Norberg and Davidson1998; Sharma & Eswaran Reference Sharma and Eswaran2004; De & Dalal Reference De and Dalal2006) and the circular (Braza et al.
Reference Braza, Chassaing and Minh1986; Saiki & Biringen Reference Saiki and Biringen1996; Park et al.
Reference Park, Kwon and Choi1998) cases. In table 1 are presented the reference data of mean drag coefficient (
 $\bar{C}_{D}$
) based on the dynamic pressure, root mean square (r.m.s.) of lift coefficient fluctuation (
 $C_{L,rms}$
), maximum magnitude of lift coefficient fluctuation (
 $C_{L,max}-\bar{C}_{L}$
) and Strouhal number (St) of vortex shedding currently available in the literature together with the present results. Our results are in good agreement with those of other authors, verifying that the numerical scheme and resolution used in the current simulation are adequate and reliable.
Comparison of the present results with those of other authors for the flow past a square cylinder and for the flow past a circular cylinder, at
 $Re=100$
.

3 Results
3.1 Primary instability
When Re is very low, the flow is 2D, steady and symmetric with respect to the centreline (
 $y=0$
). As Re increases above a certain value, termed the ‘critical Reynolds number’, Hopf bifurcation sets in; the 2D steady flow bifurcates to a 2D time-periodic flow. The critical Reynolds number (
 $Re_{c1}$
) of this primary instability can be obtained by using the linear growth rate (
 ${\it\sigma}_{r}$
) in the SL equation (Stuart Reference Stuart1971; Schumm, Berger & Monkewitz Reference Schumm, Berger and Monkewitz1994). Near
 $Re_{c1}$
, the growth rate in the SL equation can be linearized as follows (Schumm et al.
Reference Schumm, Berger and Monkewitz1994):
 $$\begin{eqnarray}\displaystyle {\it\sigma}_{r}=K(Re-Re_{c1}), & & \displaystyle\end{eqnarray}$$
where
 $K$
is a positive constant. According to the experiment of Schumm et al. (Reference Schumm, Berger and Monkewitz1994), equation (3.1) is valid in the range of
 $-10\leqslant Re-Re_{c1}\leqslant 20$
. Like Park (Reference Park1994) and Sohankar et al. (Reference Sohankar, Norberg and Davidson1998), we chose instantaneous peak values of the lift coefficient
 $C_{L}$
as the characteristic amplitude. From its time history,
 ${\it\sigma}_{r}$
was obtained by computing the slope of the linear portion of the curve. Since
 ${\it\sigma}_{r}=0$
at
 $Re=Re_{c1}$
, the critical Reynolds number
 $Re_{c1}$
can be obtained by finding Re for which
 ${\it\sigma}_{r}$
turns out to be zero.
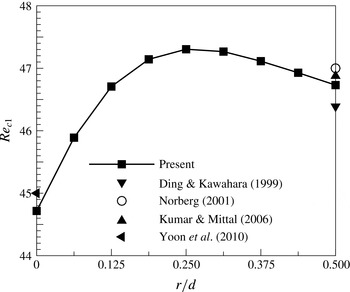
Rounding the sharp edges of a square cylinder induces topological change in the flow pattern, subsequently altering the criticality of the primary instability. Figure 2 presents
 $Re_{c1}$
of the nine selected edge-radius ratios (
 $r/d$
). The first and the last cases correspond to the well-known flow past a square cylinder and flow past a circular cylinder, respectively. The present results for the two cases are in good agreement with data from other authors (Ding & Kawahara Reference Ding and Kawahara1999; Norberg Reference Norberg2001; Kumar & Mittal Reference Kumar and Mittal2006; Yoon et al.
Reference Yoon, Yang and Choi2010) currently available in the literature. Since
 $Re_{c1}$
of the circular-cylinder case is higher than that of the square-cylinder case, one may conjecture that rounding stabilizes the flow, therefore,
 $Re_{c1}$
monotonically increases with increasing
 $r/d$
. However, that is not the case. The critical Reynolds number reaches the maximum at
 $r/d=0.25$
, indicating that the flow is most stable (i.e.
 $Re_{c1}$
is highest) when the square cylinder is partially rounded with
 $r/d=0.25$
.
Critical Reynolds number of the primary instability plotted against
 $r/d$
.

3.2 Nonlinear characteristics of the primary instability
To determine the nonlinear characteristics of the primary instability (i.e. Hopf bifurcation), the following Landau model proposed by Landau & Lifshitz (Reference Landau and Lifshitz1976) as a series expansion, was used:
 $$\begin{eqnarray}\displaystyle \frac{\text{d}A}{\text{d}t}=({\it\sigma}+\text{i}{\it\omega})A-l(1+\text{i}c)\left|A\right|^{2}A+\cdots \,. & & \displaystyle\end{eqnarray}$$
Here,
 $A(t)$
represents the ‘complex’ amplitude of the perturbation mode. The constant
 ${\it\sigma}$
is the linear growth rate of the perturbation, and
 ${\it\omega}$
represents the angular oscillation frequency during the linear growth of the perturbation. The Landau constant is denoted by
 $c$
. The sign of
 $l$
determines the type of transition. A positive value of
 $l$
implies a supercritical (non-hysteretic) transition, while a negative value indicates a subcritical (hysteretic) one (Sheard, Thompson & Hourigan Reference Sheard, Thompson and Hourigan2004). In the current investigation, the instantaneous peak value of
 $C_{L}$
was taken as the amplitude of the perturbation mode (
 $|A|$
). The sign of
 $l$
is determined practically by the behaviour of
 $\text{d}\ln |A|/\text{d}t$
near
 $|A|^{2}\approx 0$
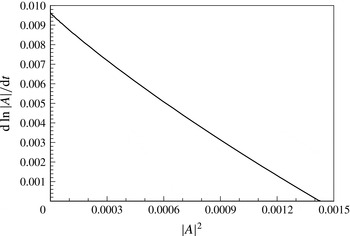
. Figure 3 presents the trajectory in a (
 $\text{d}\ln |A|/\text{d}t$
,
 $|A|^{2}$
) plane, parametrized by the time in the flow evolving from the initial symmetric base flow, computed for
 $r/d=0.25$
and
 $Re=50$
. The vertical-axis intercept gives the linear growth rate (
 ${\it\sigma}$
), and the slope at
 $|A|^{2}=0~(-l)$
determines the nonlinear bifurcation characteristics. A negative slope corresponds to a supercritical bifurcation, whereas a positive slope denotes a subcritical bifurcation (Sheard et al.
Reference Sheard, Thompson and Hourigan2004). The current transition turned out to be a supercritical bifurcation (figure 3). The evolving flow finally reaches the periodic base flow, i.e.
 $\text{d}\ln |A|/\text{d}t=0$
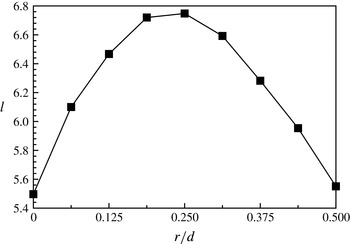
. The variation of
 $l$
with
 $r/d$
is shown in figure 4, consistent with the prediction of the linear stability analysis (figure 2).
The derivative of the amplitude logarithm plotted against the square of the amplitude, for
 $r/d=0.25$
and
 $Re=50$
.

Variation of
 $l$
with
 $r/d$
, at
 $Re=50$
.

3.3 Change of flow topology
Above
 $Re_{c1}$
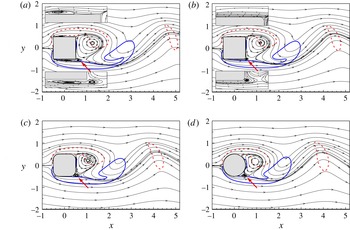
, the flow becomes unsteady with periodic vortex shedding. Figure 5 presents instantaneous streamlines at
 $Re=160$
, taken at the instant when
 $C_{L}$
is maximum, for the selected cases of
 $r/d$
, revealing the effect of rounding on the flow topology. For the square-cylinder case (
 $r/d=0$
, figure 5
a), the flow separates at the leading edges, and then alternatingly reattaches on the top and bottom faces, forming small recirculating regions consistent with Sharma & Eswaran (Reference Sharma and Eswaran2004). With rounding, however, flow separation occurs at the trailing edges; thus there are no recirculating regions on the top and bottom faces (figure 5
b–d). The shift of the separation points towards the trailing edges seems to be related to size reduction of the vortices shed from the rounded cylinders. In fact, it can be seen in figure 5(b–d) that the shed vortex becomes smaller with increasing
 $r/d$
. Vortices are alternatingly created in the immediate vicinity of the trailing rounded edges (indicated by the arrows in figure 5), travel along the rounded surface and the rear face, and then shed off as the next vortex is formed.
Instantaneous streamlines and vorticity contours (solid
 $+2$
, dashed
 $-2$
) of time-periodic flow at the instant of the maximum lift force, at
 $Re=160$
: (a)
 $r/d=0$
, (b)
 $r/d=0.0625$
, (c)
 $r/d=0.25$
, (d)
 $r/d=0.5$
.

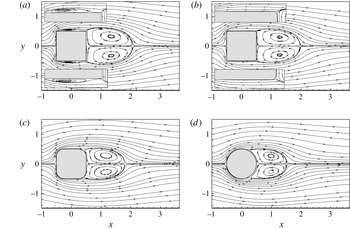
Streamlines of the mean flow are presented in figure 6 for the same cases as in figure 5. A drastic change in the mean-flow topology is also noticed between
 $r/d=0$
and
 $r/d=0.0625$
. In the flow past a square cylinder (
 $r/d=0$
), there exist secondary vortices on the upper and lower faces of the cylinder (figure 6
a). However, a small rounding (
 $r/d=0.0625$
) completely eliminates them (figure 6
b); this was also seen in the instantaneous snapshots (figure 5
b). Further rounding reduces not only the size of the instantaneous shed vortices (figure 5) but also the mean recirculating region (figure 6). All these changes in flow topology lead to the drastic changes in the secondary (3D) instability depending on
 $r/d$
as seen in the following section.
Streamlines of the mean flow, at
 $Re=160$
: (a)
 $r/d=0$
, (b)
 $r/d=0.0625$
, (c)
 $r/d=0.25$
, (d)
 $r/d=0.5$
.

3.4 Secondary instability
3.4.1 Floquet stability analysis
The time-periodic 2D flow could be unstable to 3D disturbances at a higher Re, consequently becoming 3D. This instability is termed the secondary (or 3D) instability. The onset of the secondary instability leading to 3D flow can be detected by Floquet stability analysis in which an instantaneous velocity field of the flow past a rounded cylinder is decomposed into the 2D base flow with a period
 $T$
(
 $\boldsymbol{U}(x,y,t)=\boldsymbol{U}(x,y,t+T)$
) and a 3D perturbation-velocity field (
 $\boldsymbol{u}^{\prime }(x,y,z,t)$
) as follows:
 $$\begin{eqnarray}\displaystyle \boldsymbol{u}(x,y,z,t)=\boldsymbol{U}(x,y,t)+\boldsymbol{u}^{\prime }(x,y,z,t). & & \displaystyle\end{eqnarray}$$
Substituting (3.3) into the continuity and Navier–Stokes equations (2.1) and (2.2), and then linearizing them, one can obtain the following governing equations for the perturbation velocity field:
 $$\begin{eqnarray}\displaystyle & \boldsymbol{{\rm\nabla}}\boldsymbol{\cdot }\boldsymbol{u}^{\prime }=0, & \displaystyle\end{eqnarray}$$
 $$\begin{eqnarray}\displaystyle & \displaystyle \frac{\partial \boldsymbol{u}^{\prime }}{\partial t}=-\boldsymbol{{\rm\nabla}}\boldsymbol{\cdot }\left(\boldsymbol{u}^{\prime }\boldsymbol{U}+\boldsymbol{U}\boldsymbol{u}^{\prime }\right)-\boldsymbol{{\rm\nabla}}p^{\prime }+\frac{1}{Re}{\rm\nabla}^{2}\boldsymbol{u}^{\prime }+\boldsymbol{f}^{\prime }. & \displaystyle\end{eqnarray}$$
Here, the additional term (
 $\boldsymbol{f}^{\prime }$
) for the immersed boundary method is also included. At the inlet, a Dirichlet boundary condition
 $(\boldsymbol{u}^{\prime }=0)$
was imposed, while the convective and slip boundary conditions were used at the exit and at the lateral boundaries, respectively.
By defining the operator
 $L$
so that
 $L(\boldsymbol{u}^{\prime })$
is the right-hand side of the linearized equation, (3.5) can be written symbolically as
 $\partial \boldsymbol{u}^{\prime }/\partial t=L(\boldsymbol{u}^{\prime })$
. The general solution of this equation can be expressed as a sum of Floquet modes,
 $\tilde{\boldsymbol{u}}(x,y,z,t)\exp ({\it\gamma}t)$
, where
 ${\it\gamma}~(\equiv {\it\sigma}+\text{i}{\it\omega})$
is the Floquet exponent, and each Floquet eigenfunction
 $\tilde{\boldsymbol{u}}$
is a time-periodic function. To extract the periodic characteristics of the perturbation, a normalized Floquet mode
 $(\breve{\boldsymbol{u}})$
is defined as
 $\breve{\boldsymbol{u}}=\tilde{\boldsymbol{u}}\exp (\text{i}{\it\omega}t)$
. Instability of the base flow
 $\boldsymbol{U}$
is determined by the Floquet multipliers,
 ${\it\mu}\equiv \exp ({\it\gamma}T)$
;
 $|{\it\mu}|>1$
indicates an exponentially growing perturbation. The Floquet multipliers can be obtained from the eigenvalues of
 $L$
;
 $\tilde{\boldsymbol{u}}$
represents the corresponding eigenfunctions. Since velocity and pressure fluctuations are assumed to be homogeneous in the spanwise direction, they can be expressed by an inverse Fourier transform in
 $z$
as follows:
 $$\begin{eqnarray}\displaystyle \left[\begin{array}{@{}c@{}}\boldsymbol{u}^{\prime }\\ p^{\prime }\end{array}\right](x,y,z,t)=\int _{-\infty }^{\infty }\left[\begin{array}{@{}c@{}}\hat{\boldsymbol{u}}\\ \hat{p}\end{array}\right](x,y,{\it\beta},t)\,\text{e}^{\text{i}{\it\beta}z}\,\text{d}{\it\beta}, & & \displaystyle\end{eqnarray}$$
where
 ${\it\beta}=2{\rm\pi}/{\it\lambda}$
represents the spanwise wavenumber and
 ${\it\lambda}$
is the corresponding spanwise wavelength of a disturbance, non-dimensionalized by
 $d$
. Since (3.4) and (3.5) are linear, modes with different
 $|{\it\beta}|$
can be decoupled. The governing equations for each disturbance wave are similar to (3.4) and (3.5) except for the replacement of the gradient operator
 $\boldsymbol{{\rm\nabla}}$
with
 $\boldsymbol{{\rm\nabla}}_{{\it\beta}}=(\partial /\partial x,\partial /\partial y,\text{i}{\it\beta})$
. Recently, a 1D power-type method was applied by Sheard et al. (Reference Sheard, Thompson and Hourigan2003) to estimate the maximum magnitude of the Floquet multipliers by computing the following ratio:
 $$\begin{eqnarray}\displaystyle |{\it\mu}|_{max}\approx N(t+T)/N(t), & & \displaystyle\end{eqnarray}$$
where
 $N(t)$
is the
 $L_{2}$
-norm of the perturbation-velocity field at an instant of time. This method was verified by Blackburn & Lopez (Reference Blackburn and Lopez2003). In this study we used the power-type method in conjunction with an immersed boundary method (Yoon et al.
Reference Yoon, Yang and Choi2010) to calculate the Floquet instability of the periodic wake past a rounded cylinder. For convenience, the term ‘Floquet multiplier’ implies the one that has the maximum magnitude among the Floquet multipliers from now on, and the subscript max is dropped. The governing equations for each
 ${\it\beta}$
were temporally and spatially discretized in the same way as for the base flow.
The 2D time-periodic base flows were first computed with
 $800\times 448$
grid cells in the
 $x$
and
 $y$
directions, respectively. In particular,
 $128\times 128$
grid cells were allocated for the rounded cylinder to capture the small-scale structures in the vicinity of the cylinder. Thirty-two instantaneous snapshots were saved over one period (
 $T$
) of the base flow. They were fed to the linearized perturbation equations for each
 ${\it\beta}$
, being Fourier-interpolated at each time step. For the Floquet stability analysis, the numerical resolution of
 $608\times 288$
in the
 $x$
and
 $y$
directions, respectively, was used. To accurately find the critical values of Re and
 ${\it\beta}$
, computations were carried out with the small increments of 5 and 0.05 for Re and
 ${\it\beta}$
, respectively. Random noise of very small amplitude (less than
 $10^{-5}$
% of the inlet velocity of the base flow) was used as the initial perturbation-velocity field.
The critical Reynolds number (
 $Re_{c2}$
) of a 3D instability mode is determined by the Re value at which
 $|{\it\mu}|=1$
. The unstable modes manifest themselves in the order of A, B and QP with increasing Re. In the cases of circular (
 $r/d=0.5$
) or square (
 $r/d=0$
) cylinders, the characteristics of A, B and QP are well known from previous studies in the literature (Williamson Reference Williamson1988, Reference Williamson1996; Zhang et al.
Reference Zhang, Fey, Noack, Konig and Eckelmann1995; Barkley & Henderson Reference Barkley and Henderson1996; Robichaux et al.
Reference Robichaux, Balachandar and Vanka1999; Blackburn & Lopez Reference Blackburn and Lopez2003; Sheard et al.
Reference Sheard, Fitzgerald and Ryan2009; Blackburn & Sheard Reference Blackburn and Sheard2010; Yoon et al.
Reference Yoon, Yang and Choi2012; Choi & Yang Reference Choi and Yang2014). Mode A reveals the odd reflection–translation (RT) symmetry, and mode B exhibits the even RT symmetry, mathematically expressed as
 $$\begin{eqnarray}\displaystyle & \text{odd RT symmetry: }\breve{{\it\omega}}_{x}(x,y,t)=-\breve{{\it\omega}}_{x}(x,-y,t+T/2)~\text{(mode A)}, & \displaystyle\end{eqnarray}$$
 $$\begin{eqnarray}\displaystyle & \text{even RT symmetry: }\breve{{\it\omega}}_{x}(x,y,t)=\breve{{\it\omega}}_{x}(x,-y,t+T/2)~\text{(mode B)}. & \displaystyle\end{eqnarray}$$
Here,
 $T$
and
 $\breve{{\it\omega}}_{x}$
represent the time period of the base flow and streamwise vorticity of the normalized Floquet mode, respectively. Mode A persists even far downstream, while that is not the case for mode B. It should also be noted that the spanwise wavelength of mode A is approximately five times larger than that of mode B (Barkley & Henderson Reference Barkley and Henderson1996; Williamson Reference Williamson1996; Robichaux et al.
Reference Robichaux, Balachandar and Vanka1999).
Marques, Lopez & Blackburn (Reference Marques, Lopez and Blackburn2004) reported that flow with spatio-temporal
 $Z_{2}\times O(2)$
symmetry, like the flow past a single square cylinder, exhibits three unstable 3D modes, namely two synchronous modes (
 ${\it\omega}=0$
) and one quasi-periodic mode (QP) (Barkley & Henderson Reference Barkley and Henderson1996; Blackburn & Lopez Reference Blackburn and Lopez2003; Blackburn & Sheard Reference Blackburn and Sheard2010; Yoon et al.
Reference Yoon, Yang and Choi2010; Sheard Reference Sheard2011). In mode QP the streamwise vorticity of the normalized Floquet mode (
 $\breve{{\it\omega}}_{x}$
) is repeated in magnitude with an approximate time period of
 $T$
, whereas its sign is alternating. This temporal feature of QP seems to be similar to that of mode C, in that mode C has the time period of
 $2T$
. However, a close examination reveals that the periodicity of the normalized Floquet QP mode is not exactly identical to twice the time period of the base flow, implying a quasi-periodic feature of QP. Floquet multipliers of QP obtained from the eigenvalues of the operator L turn out to be complex numbers (Blackburn & Lopez Reference Blackburn and Lopez2003; Blackburn & Sheard Reference Blackburn and Sheard2010; Sheard Reference Sheard2011), while those of A, B and C are pure real. One can refer to Blackburn & Lopez (Reference Blackburn and Lopez2003) and Sheard (Reference Sheard2011) to see the behaviour of
 ${\it\mu}$
on a complex plane with increasing Re, and to find a detailed description on the relation between QP and C. The critical spanwise wavelength of mode QP is approximately an average of those of A and B (Blackburn & Lopez Reference Blackburn and Lopez2003; Blackburn, Marques & Lopez Reference Blackburn, Marques and Lopez2005; Sheard et al.
Reference Sheard, Fitzgerald and Ryan2009; Sheard Reference Sheard2011).
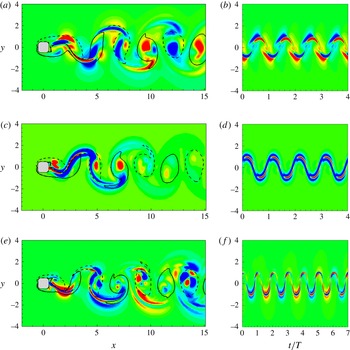
Streamwise-vorticity contours for a rounded cylinder,
 $r/D=0.25$
: (a,b) mode A,
 $Re=200$
,
 ${\it\beta}=1.4$
; (c,d) mode B,
 $Re=262$
,
 ${\it\beta}=7.0$
; (e,f) mode QP,
 $Re=395$
,
 ${\it\beta}=3.1$
; (a,c,e) instantaneous contours of the Floquet mode; (b,d,f) temporal accumulation on the line
 $x=2.5$
. The red and blue regions represent negative and positive streamwise vorticity, respectively. Solid and dashed lines represent positive and negative values of spanwise vorticity of the base flow, respectively (lines,
 ${\it\omega}_{z}=\pm 0.1$
).

In figure 7 streamwise-vorticity contours of the three distinct instability modes in the flow past a rounded cylinder with
 $r/d=0.25$
are presented near the criticality. The red and blue regions represent negative and positive streamwise vorticity, respectively. In figure 7(a,c,e), the solid and dashed lines denote positive and negative spanwise vorticity of the corresponding base flow, respectively, whereas temporal accumulation of the streamwise vorticity contours on the line
 $x=2.5$
is shown in figure 7(b,d,f). It is seen in figure 7 that the topological change of the base flow due to rounding the edges does not affect the main characteristics of A, B and QP, including the RT symmetry of each mode, the fast downstream decay of mode B, the quasi-periodicity of mode QP (Barkley & Henderson Reference Barkley and Henderson1996; Robichaux et al.
Reference Robichaux, Balachandar and Vanka1999; Sheard et al.
Reference Sheard, Fitzgerald and Ryan2009) and the strong localization of the core of modes A and B in the near wake (Giannetti, Camarri & Luchini Reference Giannetti, Camarri and Luchini2010). The present Floquet stability analysis does not reveal any other instability mode, confirming the affirmation of Marques et al. (Reference Marques, Lopez and Blackburn2004).
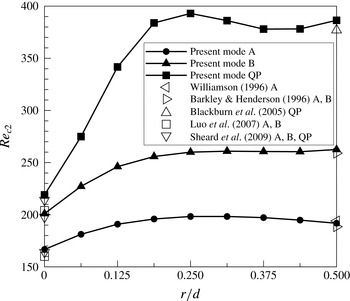
Variation of critical Reynolds number with
 $r/d$
for flow past a rounded cylinder.

3.4.2 Criticalities of 3D instability modes
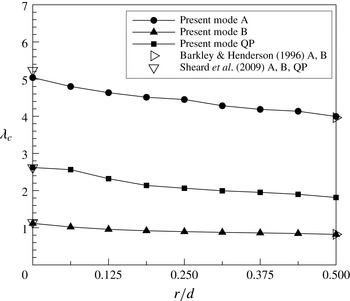
Figure 8 presents the critical Reynolds number (
 $Re_{c2}$
) of each 3D instability mode depending upon
 $r/d$
, and the corresponding critical spanwise wavelength (
 ${\it\lambda}_{c}$
) is shown in figure 9. The present Floquet results on
 $Re_{c2}$
and
 ${\it\lambda}_{c}$
are compared with other authors’ data for the circular and square cylinders (Barkley & Henderson Reference Barkley and Henderson1996; Williamson Reference Williamson1996; Blackburn et al.
Reference Blackburn, Marques and Lopez2005; Luo, Tong & Khoo Reference Luo, Tong and Khoo2007; Sheard et al.
Reference Sheard, Fitzgerald and Ryan2009), being in good agreement with them. It is seen in figure 8 that the emergence of mode A is most delayed (i.e.
 $Re_{c2,A}$
is maximum) when
 $r/d=0.25$
. Nevertheless,
 $Re_{c2,A}~(=198.3)$
at
 $r/d=0.25$
is slightly lower than
 $Re_{c2,B}$
(
 $=201.0$
) at
 $r/d=0$
. Recalling that
 $Re_{c1}$
is also maximum at the same value of
 $r/d$
(figure 2), and that mode A is the 3D instability mode that first emerges with increasing Re, one can say that a moderate rounding (
 $r/d=0.25$
) most efficiently stabilizes the flow. This is quite unexpected and surprising because full rounding (
 $r/d=0.5$
, circular cylinder) is not the most efficient one. Unlike mode A, the critical Reynolds number of the next emerging 3D mode B (
 $Re_{c2,B}$
) initially increases with increasing
 $r/d$
, but decreases very slightly between
 $r/d=0.3125$
and
 $r/d=0.4375$
, and then increases again to reach the maximum at
 $r/d=0.5$
(figure 8). This trend is more noticeable for mode QP that emerges at a higher Re than the other two modes (figure 8). A moderate rounding (
 $r/d=0.25$
) is also most effective for mode QP. It should also be noted that even a slight rounding (
 $r/d=0.125$
) of a square cylinder effectively increases
 $Re_{c2}$
of the three 3D instability modes (figure 8), delaying their emergence. Unlike
 $Re_{c2}$
, the critical spanwise wavelength monotonically decreases with increasing
 $r/d$
for all the three modes (figure 9), connecting the two extreme cases (square and circular) almost linearly.
Variation of critical spanwise wavelength with
 $r/d$
for flow past a rounded cylinder.

3.4.3 Neutral stability curves
The neutral stability curves of each mode are presented for some selected values of
 $r/d$
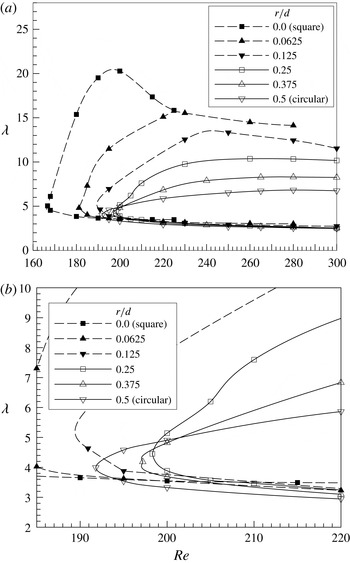
in figures 10–12. It is seen in figure 10 that rounding increases
 $Re_{c2,A}$
, and significantly reduces the unstable range of spanwise wavelength of mode A. This reveals the effectiveness of rounding the cylinder edges in stabilizing the flow past a square cylinder because mode A that emerges first with ascending Re is suppressed to a large extent by rounding. The lower branches of the neutral stability curves are almost flat, and hardly affected by rounding, meaning that the shortest unstable wavelength for mode A is weakly dependent upon Re and
 $r/d$
. The critical Reynolds number (
 $Re_{c2,A}$
) reaches the maximum value at
 $r/d=0.25$
(figure 10
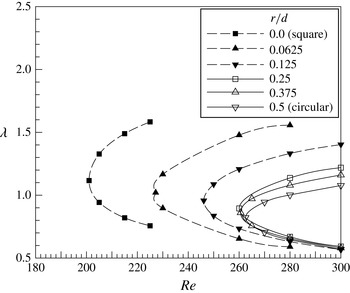
b) as also seen in figure 8. In the case of mode B (figure 11), the neutral stability curve shifts to the right with increasing
 $r/d$
up to
 $r/d=0.25$
. Beyond that value,
 $r/d$
does not seem to significantly affect the criticality of mode B. Mode QP emerges at a rather higher Re than the other two modes, and is most sensitive to rounding. In figure 12(a) one can notice a rapid increase of
 $Re_{c2,QP}$
again up to
 $r/d=0.25$
as
 $r/d$
increases. Further rounding (
 $r/d=0.375$
, 0.4375) destabilizes the flow (i.e
 $Re_{c2,QP}$
decreases, figure 12
b), and then stabilizes the flow again at
 $r/d=0.5$
, as seen in figures 8 and 12(b). From figures 10–12, it is concluded that small rounding (
 $0\leqslant r/d\leqslant 0.25$
) has more impact on the criticality of the 3D modes (A, B, QP) than large rounding (
 $0.25<r/d\leqslant 0.5$
), which can be explained by the topological change induced by the small rounding as mentioned in § 3.3. The small rounding suppresses the flow separation originally at the upstream edges of the square cylinder (figure 5
a), and delays separation towards the downstream rounded edges (figure 5
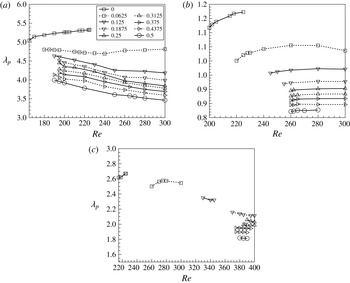
b,c). Further rounding, however, does not yield a drastic change in flow topology, resulting in less influence on the criticality of the 3D modes. Evolution of the dominant spanwise wavelength (
 ${\it\lambda}_{p}$
) corresponding to the largest
 $|{\it\mu}|$
is plotted against Re for each mode and for each
 $r/d$
in figure 13. It is seen that
 ${\it\lambda}_{p}$
decreases with increasing
 $r/d$
in all cases. In particular, a significant decrease of
 ${\it\lambda}_{p}$
is noticed between
 $r/d=0$
and
 $r/d=0.0625$
, implying that a very small rounding definitely affects the dominant spanwise wavelength of each instability mode.
Neutral stability curves of mode A: (a) entire range of Re investigated, (b) magnified view.

Neutral stability curves of mode B.

Neutral stability curves of mode QP: (a) entire range of
 $Re$
investigated, (b) magnified view.

Evolution of the dominant spanwise wavelength (
 ${\it\lambda}_{p}$
) corresponding to the largest
 $|{\it\mu}|$
: (a) mode A, (b) mode B, (c) mode QP.

4 Conclusion
The stability characteristics of flow past a rounded cylinder, ranging from a square cylinder to a circular cylinder, have been numerically investigated. Nine cases of distinct rounding have been considered in total. The primary instability manifests itself in the form of Hopf bifurcation, and its criticality was computed by using the Stuart–Landau equation. It was found that rounding the sharp edges of a square cylinder stabilizes the flow, but the most stable case (i.e. the maximum
 $Re_{c1}$
) was obtained not with
 $r/d=0.5$
(circular) but with
 $r/d=0.25$
. The secondary instability manifests itself in the form of 3D modes (A, B, QP), and the criticality of each mode was computed by using Floquet stability analysis. For a given
 $r/d$
, the 3D modes emerge in the order of A, B and QP with increasing Re. Rounding the edges does not alter the main characteristics of the individual 3D mode, but significantly affects its criticality due to the topological change caused by rounding. It was found that rounding the sharp edges of a square cylinder also stabilizes the time-periodic 2D flow. Like the primary instability, modes A and QP are most stable (i.e. the maximum
 $Re_{c2}$
) with
 $r/d=0.25$
, whereas
 $r/d=0.5$
(circular) is the most stable case for mode B. The neutral stability curves reveal that rounding the sharp edges of a square cylinder drastically affects the criticality of mode A in terms of not only
 $Re_{c2}$
but also the unstable range of spanwise wavelength. From our findings that mode A is the 3D mode that emerges first in the ascending-Re protocol, and that both
 $Re_{c1}$
and
 $Re_{c2,A}$
are maximum at
 $r/d=0.25$
, it is concluded that rounding the sharp edges of a square cylinder with
 $r/d=0.25$
yields the most efficient stabilization of the flow.
Acknowledgement
This work was supported by the National Research Foundation of Korea (NRF) grant funded by the Korea government (MSIP) (no. 2015R1A2A2A01002981).