1 Introduction
The low coverage of the social security systems in Latin America is a motive for concern. Coverage is low in many countries both among the elderly and the working population. The proportion of the elderly who are receiving pensions is a direct indicator of the effectiveness of the systems to provide income security in old age, but the proportion of the active population that is contributing is also important as it conditions the access to and the amount of future pensions. Like in other developing regions, large segments of the active population do not contribute to the pension system in Latin America (Gill et al., Reference Gill, Packard and Yermo2003; Auerbach et al., Reference Auerbach, Genoni and Pagés2005; Rofman and Lucchetti, Reference Rofman and Lucchetti2006).
While low participation of workers in the pension system is always a problem, the exact nature, causes and policy implications of the phenomenon are likely to be different depending on whether participation in social security is a permanent or a temporary status for each worker. Low aggregate coverage might arise because the population is segmented, with some workers contributing and other workers not contributing, or because many workers contribute only part of their working career. In the first scenario, those who are contributing are expected to receive a pension. In the second scenario instead, there might be a considerable number of workers who would not be well protected despite being registered as contributors. Therefore, it is not only the average rate of contributors in the population what matters, but also the turnover.
Furthermore, turnover is having an increasing impact on the access to pensions as the social security administrations are increasing their capacity to control the fulfillment of the vesting period conditions. Not long ago, there were almost no records of individual contributions. Therefore, it was not possible to check whether workers had accumulated the required years of contributions. Benefits were hence granted on a very informal basis, often appealing to the testimony of witnesses. Albeit difficult to prove, there are many informal tales suggesting that connections in the social security institutions and in the political system were helpful. This state of affairs is gradually changing in several countries in the region as the social security systems started building work history records as part of the reforms that took place in the 1980s and 1990s. These are mostly good news, but there is also a risk that many workers end up with a very low pension or no pension at all. Aware of this risk, several governments in Latin America are currently considering options to reduce the number of periods of contribution required to access a pension. In the case of Chile, for example, the reform that was passed in January 2008 eliminates the condition that workers had 20 years of contribution to access the minimum pension guarantee. Colombia is also considering a reform that would reduce the vesting period (the so-called Beneficio Economico Periodico or periodic economic benefit). Options to soften this requirement are also in the agenda of the social security authorities of Uruguay.
Some social security institutions have recently delivered samples of the work history records and some other institutions will probably follow them in the near future. These rich and large panel datasets can be used for assessing the proportion of workers who could reach the required periods of contributions at the retirement age, but the available histories are still partial, usually about 10–15 years long. In this paper, we present a methodology to assess the access to pensions building life-time work histories from incomplete histories and present results for the case of Uruguay. The paper aims to answer several questions. How many workers will not comply with the years of contributions required to access a pension at ordinary retirement ages? Which are the most vulnerable groups? What factors condition the probability that a worker accumulates the required years of contribution at the usual retirement ages?
We use survival analysis to model the transitions between contributing and not contributing. Survival analysis allows us to adopt more flexible assumptions than those adopted in previous studies that used work history records in Latin America (Bertranou and Sanchez, Reference Bertranou and Sánchez2003; Lagomarsino and Lanzilotta, Reference Lagomarsino and Lanzilotta2004; Berstein et al., Reference Berstein, Larraín and Pino2005, Reference Berstein, Larraín and Pino2006; Bucheli et al., Reference Bucheli, Ferreira-Coimbra, Forteza and Rossi2005, Reference Bucheli, Forteza and Rossi2006; Bravo et al., Reference Bravo, Behrman, Mitchell and Todd2006). We then use the transition rates to simulate the complete work histories of hypothetical workers using Monte Carlo simulations.
We applied our methodology to a database of the work history records of the largest social security institution of Uruguay, the Banco de Prevision Social (BPS). We found that, unless there is a significant change in the patterns of contribution in the future, a vast majority of the contributors to this institution will not comply with the required years of contribution. Our results show that the situation will be particularly severe among low-income workers working in the private sector. Notice that these gloom projections seem to be at odds with the comparatively high coverage of the old-age pension program. This apparent contradiction may be due to the lack of enforcement of pension eligibility conditions and not to a past fulfillment of contribution requirements.
In the next section, we present a brief summary of some related literature. We describe the Uruguayan pension system in Section 3 and provide the data in Section 4. In Section 5, we present the methodologies for the estimation of the hazard rates and the simulation of the work histories. The main results are reported in Section 6 and Section 7 concludes.
2 Previous Studies
2.1 Analytical framework
Most of the literature focusing on informality tries to model how workers are sorted between formal and informal sectors. For example, Galiani and Weinschelbaum (Reference Galiani and Weinschelbaum2006) present a model in which workers differ in their amount of human capital. Because of fixed costs of formalization, only workers with human capital above a threshold will afford formalization. The model thus predicts that low-income workers will be in the informal sector and high-income workers will be in the formal sector. Although this result is roughly consistent with findings, this model does not explain why workers switch their contribution status or the proportion of time they spend in each status. Thus, literature that focus on labor flows rather than on stocks is much more appropriate to the type of analysis we are interested in.
In its theoretical vein, the flow approach to labor markets models the behavior of workers and firms as rational dynamic optimization agents. Labor market frictions are modeled using a matching function, i.e. the number of hires depends on vacancies and unemployment. The model also determines endogenously the equilibrium rate of job creation and destruction and the wage (Mortensen and Pissarides, Reference Mortensen and Pissarides1994, among others).
Albrecth et al. (Reference Albrecht, Navarro and Vroman2008) have recently proposed an extension of Mortensen and Pissarides' model that accounts for informality, that is, a sector composed by firms that do not pay payroll taxes. Unemployed can move to either the informal or the formal sector. The rates at which they receive job offers in the informal sector are exogenous; also the rate at which informal-sector workers lose jobs is exogenous. In turn, the rate at which the unemployed find jobs in the formal sector and the rates at which formal-sector workers lose jobs are endogenous. A formal-sector employer creates a vacancy when its expected value is at least as large as its cost. In turn, the vacancy is filled when a worker looking for a job finds the vacancy and the employer and the worker think the match is at least as beneficial as their outside opportunities. The gains the employer and the worker get from the match positively depend on its productivity. A formal-sector employment ends when a negative idiosyncratic productivity shock determines that the worker and the employer no longer find the association sufficiently appealing relative to their outside opportunities.
Key to this model is the assumption that workers have different productivities in the formal sector, while productivity in the informal sector is the same for everybody. Because of these different productivities, some workers will find unappealing a job offer that other workers would take. The authors show that in equilibrium there are two cutoff productivity points such that workers less productive than the lower cutoff point never take a formal job, workers more productive than the higher cutoff point never take an informal job and workers in the middle take either a formal or an informal job, depending on which opportunity comes first. Therefore, workers sort themselves into the formal and informal sectors depending on their formal-sector productivity.
Thanks to their intrinsic dynamic nature, the labor matching models account for the switches in labor status that workers usually show across their working life. The version proposed by Albrecht et al. (Reference Albrecht, Navarro and Vroman2008) also makes some very specific predictions about the proportion of time each worker will spend in the formal sector: (i) low income workers will never show up; (ii) other workers will spend varying proportions of their time in the formal sector; and (iii) the higher the workers' formal sector income, the higher the proportion of time they are employed in the sector.
2.2 Empirical studies
The issue of social security coverage has attracted considerable attention in Latin America in recent years. While in the 1990s, the focus was centered on financial sustainability, an increasing concern has been growing in recent years about coverage. Gill et al. (Reference Gill, Packard and Yermo2003) emphasize that low coverage is one of the main factors that undermine the capacity of the pension systems in Latin America to protect the elderly against the risk of poverty in old age. Latin American pension systems are mostly contributory and hence failure to contribute in the active phase leaves many citizens without access to pensions. This is not only a Latin American problem though, as most developing countries face the same issue. This concern and the increasingly widespread view that contributory schemes are ill suited to solve the coverage issue in low- and middle-income countries have led the World Bank to add a non-contributory zero-pillar to its traditional multi-pillar model for pensions (Holzmann and Hinz, Reference Holzmann and Hinz2005).
A considerable effort has been devoted to measurement of coverage of social security in Latin America. Rofman and Lucchetti (Reference Rofman and Lucchetti2006) present extensive computations of coverage among the active and passive populations based on household surveys. They show that labor force participation in social security is very heterogeneous across the region, ranging from about 60% in Costa Rica to only 10% in Bolivia. In all the countries the participation of the active population in the pension system is lower among the less-educated, low-income workers, the self-employed and salaried workers employed in small firms. Therefore, coverage of workers is not only low on average, but it is particularly low among the most vulnerable groups. Coverage of the elderly also shows much diversity across the region. The percentage of the citizens aged 65 and above who are receiving pensions ranges from less than 20% in Guatemala to more than 80% in Brazil.
Social Security coverage of the labor force in Latin America is similar to other regions of the world with similar income per capita. Palacios and Pallares-Miralles (Reference Palacios and Pallares-Miralles2000) show that a loglinear regression of the labor force participation on GDP per capita explains more than 70% of the variation in labor force participation across the world. Drawing an expected labor force participation line based on this regression leaves Latin American countries not too far from the line. In other words, observed coverage of social security among the labor force in Latin America is not generally different from expected coverage given GDP per capita. This is not to say that coverage of the labor force is not an issue in the region, but that it is not a peculiarity of Latin America.
There are no clear signs of improvement in social security coverage of the active population in Latin America in recent years. Packard et al. (Reference Packard, Shinkai and Fuentes2003), for example, analyze the evolution of coverage between 1990 and 1999 in 13 countries and find no clear general patterns: coverage rises in some countries, and decreases in others. Rofman and Lucchetti (Reference Rofman and Lucchetti2006) report a fall in coverage between the mid 1990s and early 2000s in 9 countries, and an increase in 3 countries out of 15 countries analyzed. They also show that in some countries – notably in Argentina – coverage is decreasing in some particularly vulnerable segments of the population.
There are two main explanations of low coverage of social security. One, in the tradition of the dualistic labor market model of Harris and Todaro (Reference Harris and Todaro1970), asserts that some workers are excluded from formal labor markets, due to the presence of several rigidities like minimum wages, high hiring/firing costs and costs of registration. In this view, uncovered workers have lower wages than covered workers without receiving any compensation so they would willingly formalize if they could do so. The other explanation is based on the idea that workers and firms make a cost–benefit analysis and decide whether to contribute or to exit (Hirschman, Reference Hirschman1970). In the context of limited capacity of the states to enforce law, the argument goes, workers and firms can transit from one sector to the other, depending on incentives. Therefore, in this view, agents in the informal sector are not worse off than identical agents in the formal sector. These explanations could be complementary rather than competitive, according to Perry et al. (Reference Perry, Maloney, Arias, Fajnzylber, Mason and Saavedra-Chanduvi2007). Indeed, most recent empirical studies have found that both exit and exclusion are present in varying degrees.
The most widely used data source to analyze coverage in Latin America is the household survey. Analysts have long been using these data to compute coverage of the labor force as the proportion of the active population that contributes to the social security system. Several researchers have used qualitative dependent-variable models to estimate the probability that workers contribute and to analyze what factors impact this probability (Barrientos, Reference Barrientos1996, Reference Barrientos1998; Holzmann et al., Reference Holzmann, Packard and Cuesta2000; Packard, Reference Packard2001; Barr and Packard, Reference Barr and Packard2003; Auerbach et al., Reference Auerbach, Genoni and Pagés2005; Li and Olivera, Reference Li and Olivera2005; Bustamante and Paola, Reference Bustamante and Paola2006; Packard et al., Reference Packard, McCarthy, Quintanilla and Yermo2006, among others). The household surveys are rich data sources, but they only provide cross-section information at the individual level, so these surveys are not suited to the type of questions we aim to answer.
In recent years, taking advantage of recently available longitudinal datasets, analysts have not only been able to compute the proportion of workers who are contributing – something that can be done with the household surveys –, but also the proportion of time that each worker is contributing, the so called density of contributions (De Biase and Grushka, Reference De Biase and Grushka2003; Farall et al., Reference Farall, Aisenberg, Bourquin, Caviglia, Dabusti, Mychaszula, Pena, Sanmiguel and Zagaglia2003; Zioli Fernandes, Reference Zioli Fernandes2003, among others). Most of these studies are based on administrative records of social security, which are increasingly available in the region. In the case of Chile, administrative records have been combined with information from a social protection survey to produce a richer dataset (Arenas de Mesa et al., Reference Arenas de Mesa, Behrman and Bravo2004; Bravo et al., Reference Bravo, Behrman, Mitchell and Todd2006).
Some studies used limited dependent-variable regression models to analyze determinants of the probability of contributing (Bertranou and Sánchez, Reference Bertranou and Sánchez2003; Lagomarsino and Lanzilotta, Reference Lagomarsino and Lanzilotta2004; Berstein et al., Reference Berstein, Larraín and Pino2005). Berstein et al. (Reference Berstein, Larraín and Pino2005) is the most direct antecedent to the present study, as they – like us – aimed at projection work histories to determine proportions of contributors who would be entitled to pension benefits at retirement age.
The strategy to model the probability of contributing used in this paper is more general than previous attempts we could identify in the literature. The first studies on this subject that we could find assumed that the probability of contributing is independent of previous status (Bertranou and Sánchez, Reference Bertranou and Sánchez2003; Lagomarsino and Lanzilotta, Reference Lagomarsino and Lanzilotta2004; Berstein et al., Reference Berstein, Larraín and Pino2005; Bucheli et al., Reference Bucheli, Ferreira-Coimbra, Forteza and Rossi2005), which is a strong assumption as Bucheli et al. (Reference Bucheli, Ferreira-Coimbra, Forteza and Rossi2005) explicitly acknowledge. The assumption of independence is not only strong, but it can also be tested and so there is no need to just assume it. In a recent study, we extended the framework adopted in the papers mentioned above, allowing the probabilities of contributing to depend on the previous period status (Bucheli et al., Reference Bucheli, Forteza and Rossi2006). But we still maintained the not very appealing assumption that the probabilities of switching between contributing and not contributing do not depend on duration in the state. This hypothesis was formally tested and systematically rejected in the framework proposed in this paper.
3 The Social Security System in Uruguay
In Uruguay, the first old-age, survival and disability insurance (OASDI) programs were set up in the 19th century. Since then similar programs have spread and become almost universal in the 1950s, incorporating new programs to cover against other risks. In 1967, a public institution called BPS was created with the purpose to be in charge of the social security system. Since then, BPS administers four large retirement programs that covered public servants, private workers (with some exceptions), rural workers and domestic workers. In addition, some categories of workers have their own special pension schemes: bank employees, notaries, self-employed university graduates, armed forces personnel and police force personnel. By 2001, the number of contributors to the BPS represented 89% of the total number of contributors to all social security institutions in the country (Ferreira-Coimbra and Forteza, Reference Ferreira-Coimbra and Forteza2004).
Before the social security reform initiated in 1996, the Uruguayan retirement system relied on a pay-as-you-go (PAYG) system financed through payroll contributions paid by employers and employees. Contribution was also mandatory for self-employed workers who were subject to minimum declared earnings. The 1996 reform modified the BPS retirement programs introducing individual savings accounts, administered by enterprises, to complement the PAYG system.
As a general rule, workers whose earnings are below a threshold are exclusively affiliated to the PAYG pillar. However, they can opt to deposit half of their personal contributions into individual savings accounts. Workers whose earnings are over this threshold must contribute to both pillars. For the amount below the threshold they contribute to the PAYG public system and from there up to a certain maximum, also established by law, they must contribute to individual accounts. There is no mandatory contribution for earnings over the established maximum. Employers' contributions go exclusively to the PAYG pillar.
The reform introduced other modifications. The minimum retirement age was fixed at 60 for men and women, which meant an increase of 5 years for the latter. Also, the minimum number of years of contribution required to access an ordinary pension was raised from 30 to 35. Workers can receive a contributory pension with only 15 years of contribution, but this benefit is smaller than the ordinary pension and eligibility is restricted to individuals who are 70 years or older. Workers with hazardous occupations and other special categories have special bonus on their count of years of contribution.
The replacement rate was also modified, making it more sensitive to both retirement age and years of contributions, in order to induce longer working-lives. Nowadays there are no gender differences and it ranges from 50 to 82.5%, depending on the years of contribution and the retirement age. The average wage used in the benefit formula was modified to include a longer period of contributions. In addition, there is an extra bonus for low-income workers who choose to contribute to individual savings accounts.
It is worth noticing that contributors are also entitled to unemployment insurance, disability pension, sickness and maternity subsidies, family allowances and health care. In all these programs, benefits are conditioned on compliance with eligibility requirements and as a general rule, the self-employed receive less benefits.
This system is financed by employers and employees payroll contributions and general taxes. In the 1996 reform, employee contributions were set to 18% of their monthly earnings, while employers' contributions were set at 17.5% of their total payroll. In the following years, the government introduced several exemptions to employers' contributions and in 2007, in the context of a tax reform, some of these exemptions were lifted and the general employers' contribution rate to social security was reduced to 12.5%. Self-employed contributions are based on a minimum declared monthly income.
Not contributing to the social security system eases evasion of other labor costs. The most important are the compulsory insurance to cover work injury risk and a progressive tax on wages that until 2006 ranged from 2 to 6%.
Workers who do not contribute may access means-tested benefits: an assistance pension for persons older than 70 years old – less generous than the contributory pension –, family allowances and free health care in the public system.
It is difficult to assess the costs and benefits of the not contributing. Anyway, it is worth noting that one of the aims of the 1996 reform was to provide incentives for workers to contribute, strengthening the link between contributions and pensions. But the most widely quoted disincentive to contribute to BPS has been the lack of an effective control of the number of years of contribution. Insomuch as the administrative records do not exist or are very incomplete, the BPS has had to accept the testimony of witnesses as proof of contributions.
4 The Data
We use a random sample of the work history records of the BPS, collected in December 2004 by the Labor History Unit of the BPS (ATYR-BPS). Workers in the sample are between 18 and 70 years old and contributed for at least one month between April 1996 and December 2004. The sample has 68,997 individuals.
The records are organized in four databases. One file gives personal information on individuals: date of birth, sex and country of birth. Another file contains information about the job of each person, particularly the ending and beginning of contribution spells. A third file reports monthly information on wages and some characteristics of the job. Finally, there is a database reporting information about benefits that allowed us to know the date of retirement.
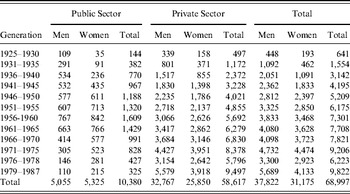
Table 1 shows the number of individuals in the database by cohort, gender and private/public condition. There are 37,822 men (55%) and 31,175 women (45%). We consider as public worker everyone who had worked in the public sector for at least half of the total time he or she had contributed. According to this criterion, we identify 58,617 (85%) private and 10,380 (15%) public workers in the database. While public sector contributors are evenly distributed between sexes (51% are women), private sector contributors are predominantly men (44% are women).
Number of individuals in the database

Source: Authors' computations using a sample of the work history database of the BPS.
The average density of contributions is 60%. Lagomarsino and Lanzilotta (Reference Lagomarsino and Lanzilotta2004) report a significantly higher figure, of around 75%, between January 1997 and December 2003. Different sampling procedures can explain these results. While we take the sample at the end of the observation period, they do it at the beginning. Our sampling procedure gives all individuals who made at least one contribution in the observation period equal probability of being picked. With their procedure, workers with low density of contributions are less likely to be in the sample.
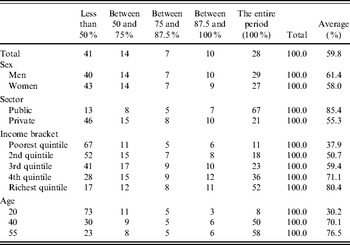
The distribution of the density of contributions has two modes and is strongly asymmetric, characteristics also pointed out by Lagomarsino and Lanzilotta (Reference Lagomarsino and Lanzilotta2004). A similar pattern has been reported in Argentina (Bertranou and Sánchez, Reference Bertranou and Sánchez2003; Farall et al., Reference Farall, Aisenberg, Bourquin, Caviglia, Dabusti, Mychaszula, Pena, Sanmiguel and Zagaglia2003) and Chile (Bravo et al., Reference Bravo, Behrman, Mitchell and Todd2006). In our sample, 28% of the workers contributed 100% of the period. This was the most frequent density of contributions in the database. Besides, over 40% do not register contributions for at least half of the potential months of contribution (Table 2).
Distribution of the population in the database according to the proportion of time in which the individuals contributed. Several groups of workers

Note: Each bracket includes the minimum of the interval.
Source: Authors' computations using a sample of the work history database of the BPS.
Men present higher densities of contribution than women. Indeed, on average men contributed 61.4% of the time and women did it 58.0%.
As expected, public sector workers have significantly higher densities of contribution than private sector workers. While more than two-thirds of public employees contributed during the whole period, only 21% of private employees did that much. Moreover, a significantly smaller proportion of public than of private workers contributed less than half of the time. There is however a considerable number of individuals classified as public employees who present low densities of contribution. This unexpected result responds to the classification criterion and to the high participation in the public sector of activities with special bonuses, i.e. activities that compute more than one year of contribution per every year of actual contribution, as teachers.
Additionally, we grouped the individuals in the sample in quintiles of the earnings distribution. In order to avoid the circular reasoning of finding low densities for workers whose low average income is due to few periods of contribution, we calculated the average earnings over periods in which individuals reported strictly positive earnings. Then, we grouped five-year generations workers by sex and calculated the quintiles of the earnings distribution for each group. The average density of contribution consistently rises with the quintile of these distributions: it is almost 38% for the poorest quintile and more than 80% for the richest quintile.
There are also significant differences according to individuals' age. At 20, the density of contribution is about 30% on average and it continuously increases with age, exceeding 75% when workers are in their fifties. However, there is an important dispersion for individuals of the same age.
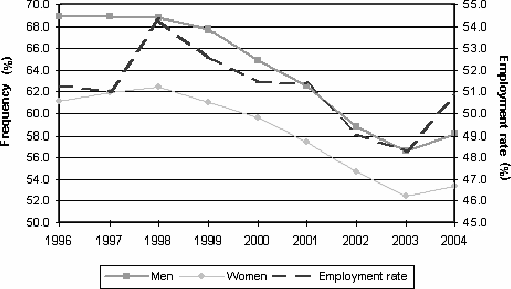
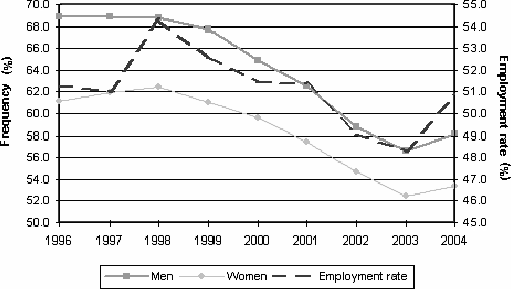
The business cycle seems to have had a significant impact on the density of contribution. The Uruguayan economy began a recession in 1999 which was followed by the most severe economic crisis in the country's history. The recovery began slowly in 2003, and 2004 was already a year of significant growth. This evolution is reflected in the unemployment and employment rates observed between 1996 and 2004. In this period of significant macroeconomic volatility, the density of contribution mirrored the rate of employment (Figure 1).
Density of contribution and rate of employment
Finally, it is worth emphasizing that our data are not a representative sample of the Uruguayan labor force. Rather they represent the universe of workers registered with the BPS as in December 2004, including both workers who were actively contributing and workers who were not contributing but were registered because they had at least once contributed before that date. Thus, the database is appropriate for estimating the proportion of the working population registered with the BPS who might not be eligible for benefits at the retirement age. We estimate that about 68% of the Uruguayan non-retired population between 18 and 54 years old were registered with the BPS in December 2004.Footnote 1 Some workers who are not registered with the BPS are covered by other pension programs, but they represented only 2% of total population in this age range in 2004. Therefore, as much as 30% of this population group was out of the social security system. Men were registered with the BPS in higher proportions than women (75 and 60%, respectively, same age range). In turn, the proportion of the population registered with the BPS is much smaller among young people: only 41% of women and 43% of men aged between 18 and 24 were registered according to our estimations in 2004.
5 Methodology
We want to estimate the proportion of workers who would reach the number of periods of contribution required to access a pension at the normal retirement ages and to identify the most vulnerable groups, using a dataset of incomplete work histories. To address this issue, we propose a two-stage methodology. In the first stage, we split the sample into sixteen groups and for each one we estimate the rates of transition (or hazard rates) between contributing and not contributing. In the second stage, we use the predicted hazard rates to simulate the lifetime work histories and compute the distribution functions of the counting of periods of contribution at different ages.
5.1 First stage: estimating the hazard rates
Consider a worker who may be in any of the two possible states: contributing and not contributing to social security. Let h c(t, X t) be the probability that a worker who does contribute to social security during month t stops contributing in t+1 and let h n(t, X t) be the probability that a worker who does not contribute during month t starts contributing in t+1. These probabilities are the (discrete time) transition rates or hazard rates of leaving the state of contributing and leaving the state of not contributing, respectively. The hazard rates may depend on several variables represented by X t.
In order to identify the hazard functions, different alternative assumptions are usually made in the literature. The most common one is that the hazard rate can be decomposed in two multiplicative terms, one that summarizes the impact of duration in the state, the so-called baseline hazard, and a term that summarizes the impact of the covariates X t. This model has been called proportional hazard because the hazard rates of two individuals who differ only in time-invariant covariates maintain a constant ratio, which is in turn proportional to the absolute difference in the covariates.
In a discrete time framework, the proportional hazard assumption leads to the following specification (Jenkins, Reference Jenkins2005, p. 41–42):

where γt summarizes the baseline hazard. This model is known as the cloglog model, because a complementary log–log transformation of the hazard is a linear function of the baseline hazard and the covariates:

An alternative identifying assumption that is often used in discrete time models is that the odds ratios are proportional to the absolute difference in the covariates. This assumption leads to the logistic hazard model:

where αt summarizes the relative odds of making a transition when X=0.
We estimate separate models for 16 groups of workers. For each sex, we split the sample of workers in the private sector in five groups according to the income quintile. In the case of public servants, we split the sample of each sex into three: a group includes the first three quintiles and the other two contain the fourth and fifth quintile, respectively.Footnote 2
The vector of covariates X t includes the age, the duration in the state and the monthly national unemployment rate. Lacking specific theoretical guidance and in order to avoid imposing a functional form, we first adopted the usual practice of using dummies to represent duration and age. The results led us to choose a polynomial of degree three on age and the log of duration. Additionally, as the pattern of duration might vary along the life cycle, we include two variables of interaction between duration and age. Finally, we also include the monthly unemployment rate.Footnote 3
The data present some characteristics that make the estimations of the hazard rates relatively complex: censoring, truncation, and unobserved heterogeneity. We briefly explain how we dealt with each of these complications in what follows.
A spell of contributions is expected to end when the worker transits from contributing to not contributing. But the observed spell can also end because of the end of the observation period, death or the retirement of the contributor. This right censoring is not a major problem for the estimation of the hazard rates though.
The spells of not contribution that began before April 1996 are left censored. As usual, we exclude these unavailable spells of the analysis. There is no left censoring of the spells of contribution in this dataset. Even when the spell may have begun before the initial observation date we have the information about when these spells began.
There might be left truncation of the spells of contribution in this dataset. The work history database captures all individuals who contributed for at least one month between April 1996 and December 2004. Consider two workers who began to contribute say in January 1990, but one left one year later and never returned and the other one continued at least until April 1996. While the second worker will be registered in the social security database, the first worker with the shorter spell will be excluded.
Unobserved heterogeneity may significantly bias these estimations. Over time, the proportion in the population of individuals with high risk of leaving the state declines. Thus, the average hazard rates of mixed populations tend to decline over time even if the ‘true’ hazard rates of the individuals in the population rise. In order to reduce uncontrolled heterogeneity, we worked separately with several groups of workers whose behavior is likely to differ. For each one we run formal tests of unobserved heterogeneity and controlled for the heterogeneity that could still remain modeling it as an individual effect. Assuming that the individual effects are normally distributed with zero mean, the hazard rates for mixed distributions can be estimated using random effects complementary log–log or logit models (Jenkings, Reference Jenkins2005, p. 84–85). We used the xtcloglog and xtlogit commands in STATA to estimate these models (STATA, 2003). The program reports the likelihood ratio test for the null hypothesis that the variance of the individual effects is zero. Frailty is not important if this hypothesis cannot be rejected. Otherwise, frailty matters and the random effects estimation takes it into account.
5.2 Second stage: simulating the work histories
Our final goal is to build empirical distribution functions of the number of contribution periods at the usual retirement ages without assuming that the probabilities of contributing each period are independent of previous period status. As probabilities vary along the life cycle, work histories are determined by a non-homogenous Markov chain. We performed Monte Carlo simulations to overcome this difficulty.
The simulation of the work histories entails building strings of ‘c’ and ‘n’ (for contributing and not contributing, respectively) that adequately replicate the stochastic properties of the observed incomplete histories. The simulated worker contributes in t if he was either contributing in t−1 and did not make a transition to not contributing or he was not contributing in t−1 and made a transition to contributing. Let p represent the propensity to make transitions and let us assume that it is drawn from a uniform distribution in the [0,1] interval. The individual contributes in t if p⩾h c(t−1, X t−1) and he was contributing in t−1, or if p⩾1−h n(t−1, X t−1) and he was not contributing in t−1. With this rule, the probability that an individual who contributes in t−1 also contributes in t is 1−h c(t−1, X t−1), which is the probability of not leaving the state ‘contributing’. The probability that an individual who does not contribute in t−1 contributes in t is h n(t−1, X t−1), which is the probability of leaving the state ‘not contributing’.
For each of the 16 groups of workers, we use the probabilities predicted in the first stage and we apply the above algorithm to the lifetime of each simulated individual. The simulations begin at age 18 in the state ‘not-contributing’ and end at age 70. We assume that the rate of unemployment is 11.2% (average of 1981–2006). The number of months of contribution accumulated at any age could then be counted in each simulated work history. Repeating this procedure 5000 times, we got empirical distributions of the counting of the months of contribution at the desired ages.
6 Results
6.1 The hazard rates
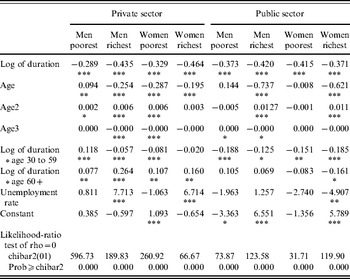
We estimated the complementary log–log and logit models of contributing and not contributing for the 16 groups. Both models yield very similar results. Thus, for the sake of brevity, we only present here some of the results obtained with the complementary log–log model (Table 3).Footnote 4
Hazard rates of leaving the state of contributing

Legend:
* p<0.05; **p<0.01; ***p<0.001.
Notes: The table summarizes the results of running a random effects complementary log–log model for the state ‘contributing’. For private workers the poorest includes only the first quintile of the income distribution by gender and generation, while for public workers includes the first, second and third quintiles.
Source: Authors' computations using a sample of the work history database of the BPS.
Higher unemployment rates increase the probability of not contributing and decline the probability of contributing for most categories of private workers. This is to be expected, as in periods of high unemployment workers stop contributing at higher rates because of job loss and transition to informality, and find it more difficult to get formal jobs. Higher hazard rates of leaving the contributing state and lower hazard rates of leaving the not contributing state lead to lower densities of contribution during downturns. In the case of Chile, Berstein et al. (Reference Berstein, Larraín and Pino2006) report that the unemployment rate has a negative impact on the density of contributions of men, but positive on the density of contributions of women.
Age has a significant impact on the hazard rates as well. Young workers tend to have higher hazard rates of both contributing and not contributing than middle-aged workers, implying that turnover is particularly high at the beginning of the working career. Senior workers tend to show higher hazard rates of leaving the contributing state and lower hazard rates of leaving the not contributing state than middle-aged workers. This is to be expected, as workers within the pensionable age are more likely to stop contributing and less likely to restart contributing after they stopped than workers who are in the middle of their working careers and have not yet arrived at their retirement age.
In both states, the probabilities of making a transition reduce as the workers spend time in the state. Indeed, duration has a highly significant negative impact on the hazard rates of both contributing and not-contributing. In most regressions the coefficient for duration was found to be negative meaning that the hazard rates drop fast initially and tend to stabilize for long durations. The estimated coefficient varies across categories, but it is worthnoting that even in the public sector duration has a highly significant impact.
The coefficient of the variable that captures the interaction between duration and the dummy variable for age 30 to 59 is negative in all regressions and significantly different from zero at 0.1% significance level in most of them. This means that duration has a higher negative impact on the hazard rates of contributing and not contributing when workers are between 30 and 59 years old than earlier in their lifetime. In turn, the coefficient sign is not stable for aged 60 and above, meaning that the pattern is less clear for senior workers.
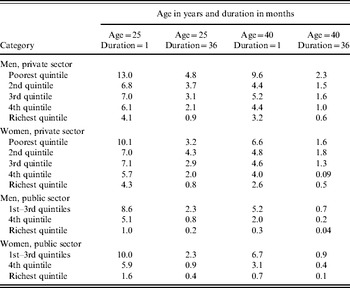
The negative effect of duration is depicted in Table 4 that provides some predicted hazard rates of leaving the contributing state when the unemployment rate is set at the mean of 1981–2006 (11.2%). The average 40 years old man working in the private sector and belonging to the richest quintile has an expected hazard rate of about 3.2% in the first month and only 0.6% in the 36th month of contribution. The same individual at 25 would have an expected hazard rate of 4.1% in the first month and 0.9% in the 36th month of contribution.
Simulated monthly hazard rates of leaving the state of contributing (%)

Note: These simulations have been done setting the unemployment rate at the 1981–2006 period average, which was 11.20%.
Source: Authors' computations using a sample of the work history database of the BPS.
The predicted hazard rates also indicate that low-income workers tend to have higher (lower) risk of leaving the state of contributing (not contributing). Therefore, low-income workers are less likely to contribute than high-income workers.
Workers in the public sector present lower (higher) hazard rates of leaving the state contributing (not contributing) than private workers. Thus, the former have higher probabilities of contributing than the latter.
6.2 The simulations
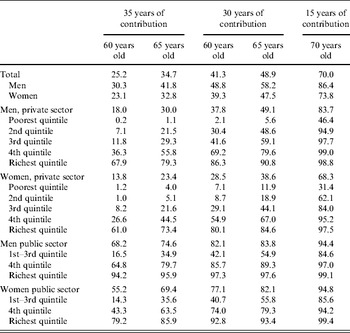
In Table 5, we present the percentage of workers who reach 30 and 35 years of contribution at the ages of 60 and 65, respectively, obtained by simulating the lifetime path of contributions considering an unemployment rate of 11.2% (average rate of 1981–2006). According to our estimations, there is a serious risk that a sizeable proportion of the workers registered in the work history records of the BPS will not be able to accumulate the 35 years of contribution required to be eligible for a pension when they reach the usual retirement ages. Only about 25% of contributors will have made the required 35 years of contributions by the age of 60 and about 35% by the age of 65. However, as also showed in Table 5, 70% of workers reach 15 years of contribution at 70 years of age, which make them eligible for a (minimum) benefit higher than the assistant pension.
Percentage of workers who contribute for at least 30 or 35 years at the ages 60 and 65, and for at least 15 years at 70 years of age. Simulations were run using the average unemployment rate observed between 1981 and 2006 (11.20%)

Source: Authors' computations using a sample of the work history database of the BPS.
As expected, the problem is more serious for women than men. While only 33% of women satisfy the requirements at 65, 42% of men manage to do so at the same age. These figures fall to 23 and 30%, respectively, at 60.
Public employees are more likely to meet the requirements than private workers. Only 30% of men and 23% of women working in the private sector satisfy the access condition when they turn 65 years old. In contrast, 75% of men and 69% of women working in the public sector do.
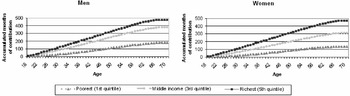
We have also found big differences between workers in different income brackets. In Figure 2 we depict the predicted lifetime accumulated contributions of the average private worker of different income strata. Both the average man and woman of the highest quintile accumulate 35 years of contribution (420 months) at age 60. About 94% of the men and 80% of the women in the richest quintile working in the public sector would access a pension when they turn 60 (Table 5). In contrast, in the poorest quintile, the average man accumulates 13 and the average woman 10 years of contribution. Almost no worker in this category would be eligible for a pension at 60, because they would not have contributed 35 years or more. Some of them would however be eligible for a contributory pension that is granted at 70 with only 15 years of contribution. According to our simulations, about 46% of men and 31% of women in the poorest quintile would accumulate at least 15 years of contribution at 70. These findings are roughly consistent with the theoretical literature on informality.
Accumulated months of contribution by age

We also report the probability of accumulating 30 rather than 35 years of contribution at the retirement ages. The difference between these two estimations provides a rough approximation to the direct impact on pension coverage of changing the minimum required number of years of contribution. This measure does not take into account the indirect effects of such changes. It is possible, for example, that reductions in the required number of periods of contribution induce some workers to contribute less frequently. But it is also possible that an increase in the required number of periods of contribution, like the one that was put in place in 1996, provides incentives for some workers to contribute more periods. If this is the case, the total impact on coverage of changing this access condition will be lower than the direct impact estimated here. Therefore, the estimated difference between the probabilities of contributing 30 and 35 years at retirement provide an upper bound to the total impact of this change.
If the density of contributions observed between 1996 and 2004 remain unchanged, the proportion of individuals who accumulate 30 years of contributions is necessarily higher than the proportion of individuals who accumulate 35 years of contributions at any given age. We find that 41% and almost 49% of the population registered in the labor history records will accumulate 30 years of contributions when they turn 60 and 65 years old, respectively. Thus, the difference between the proportion of workers who would reach the required 30 or 35 years is around 15 percentage points. The change seems to impact more strongly individuals with high and medium densities of contribution than individuals with low densities. Indeed, workers with very low densities of contributions are not likely to contribute for either 30 or 35 years.
According to these results, the increase in the vesting period in place since 1996 will likely cause a sizable decrease in the proportion of contributors who will fulfill this requirement. This tightening of the conditions to access a pension is therefore likely to cause a significant reduction in the proportion of individuals that can retire at any given age, and an increase in the average retirement age. Obviously, for these phenomena to take place, the social security administration has to actually check individual records of contributions and enforce the pension access conditions. This was not warranted in the past, but the ability of the administration to do it is growing gradually as information based on labor history records is being accumulated.
It is worth to noting that the simulations are sensitive to the business cycle. We showed in the previous section that the unemployment rate impacts the hazard rates and hence the simulated work histories depend on the assumptions made about the unemployment rate. The simulations presented so far are based on the average unemployment rate during the period 1981–2006. In order to analyze the sensitivity of the results to this variable, we did similar simulations using the average unemployment rate of the period covered by the work history database, i.e. between April 1996 and December 2004, which was 13.45%. As expected, we found a lower proportion of workers accumulating the required years of contribution. For example, the proportion reaching 35 years of contribution at 65 years of age decreases from 49 to 41%. However, the poorest workers are practically unaffected by the change in the unemployment rate. Most of them are basically out of the system with any of the two unemployment rates used in the simulations, suggesting that the business cycle has a bigger impact on workers in higher quintiles of the distribution.
The simulations presented so far were based on computations of the periods of service for regular jobs. There are some occupations that compute more than one period of service per period of effective contribution though. This is the case of most teachers and individuals working in risky activities. For example, workers handling radioactive substances register three periods of service every two periods of effective contribution, and hence they are required to contribute a significantly smaller number of periods to be eligible for a pension. The special regimes are relatively frequent among some groups of public employees, but they are much less frequent among private employees. Hence, we do not expect these regimes to have a significant impact on the estimations of the proportion of private employees who would qualify for a pension. Women in the richest quintile register the largest incidence of special regimes among private workers, and yet only around 3% of them have special bonuses for at least half of the time they have contributed.
In contrast, over 30% of every income group of women working in the public sector has a special bonus at least half of the total time they have contributed. This figure exceeds 46% when it comes to women in the richest quintile. Workers that present the lowest incidence of these regimes in the public sector are men in the fourth highest quintile, and almost 12% of them work in activities with bonus for at least half of the time.
Thus, we compute a proxy for the number of periods of service of public workers in activities with special bonuses. A worker who contributed for one period in any of these activities will be granted more than one period of service (the exact number depending on the bonus legally attached to the activity). This correction of the original estimation increases the estimated proportion of public workers who would satisfy accessibility requirements for every subgroup of public employees. As expected, the difference between the estimations that take into account special bonus and those which do not is much bigger among women than men. The proportion of public workers who accumulate 35 years of contribution at 60 years of age rises by 3.4 and 15.6 percentage points, men and women respectively. In the case of women in the fourth highest quintile, the difference between the two estimations is as high as 25 percentage points at the age of 60 and 12 percentage points at the age of 65. These results suggest that special bonuses may have a great impact on the proportion of public workers who satisfy the accessibility conditions, particularly in the case of women.
7 Concluding Remarks
Large segments of Latin American population are not covered by the old-age pension programs. Some workers stay out of the system all their lives, never contributing or receiving pensions. Other workers contribute, but many of them do not reach the minimum number of periods of contribution required to qualify for a pension or for a minimum pension guarantee. There is increasing evidence of the existence of a significant number of workers making frequent transitions between formality and informality. Highly fragmented and incomplete histories of contribution to social security risk leaving these workers with no contributory pension rights. Some of them might receive an assistance pension, but these are usually much less generous. This risk has probably been rising recently as the social security administrations have been increasing their ability to enforce the fulfillment of the qualifying conditions.
We propose in this paper a methodology to estimate the proportion of workers who would accumulate the number of periods of contribution required to access a pension, and to assess the impact of different explanatory variables on the fulfillment of this condition. The estimation represents a significant challenge, because the information that is currently available to estimate the number of periods of contribution of each worker is incomplete. We propose a two-steps methodology to overcome this difficulty. In the first step, we estimate the probabilities of transition between the contributing and not contributing at each age, using survival analysis. In the second step, we perform Monte Carlo simulations of the histories of contribution using the probabilities of transition estimated in the first step.
Using this methodology on a database of the main social security institution of Uruguay, the BPS, we found some distinctive patterns in the hazard rates. First, the hazard rate of both states decline with duration. As workers spend time in any of the two states, the chances of staying in the state rise. History and luck during the first periods in the state seem thus to be crucial for the fate of the working career. Second, young workers have higher risk of quitting the state contributing but also of quitting the state not contributing, i.e. they are more mobile. Third, economic downturns raise the risk that private workers stop contributing and reduce the chances that they start contributing.
Our simulations indicate that the majority of contributors to the BPS will not reach the required number of years of contribution to access a pension at the normal retirement age. Not at least if the current probabilities of transition between contributing and not contributing remain in the future the same as in the period of observation (1996–2004). The required number of periods of contribution to access a pension in Uruguay is 35 years, which is unusually high for a developing country, but even when we estimate the proportion of contributors who would accumulate 30 years of contribution, we get disappointingly low figures.
Incomplete and highly fragmented histories of contribution are much more pervasive among low- than among high-income workers. This is hardly surprising, but the size of the differences is really striking. Consider for example the case of men working in the private sector. They have almost a 68% chance of reaching the required 35 years of contribution at 60 years if they belong to the richest quintile, but less than 1% chance if they belong to the poorest quintile. The same figures for women are 61 and 1% for the richest and poorest quintiles, respectively.
These findings may be explained in the framework of Albert et al. (Reference Albrecht, Navarro and Vroman2008). Additionally, some more specific characteristics of the Uruguayan social security system – like minimum pensions, non-contributory pensions and incomplete work history records – may contribute to explain why some workers and especially low-income workers tend to stay out of the system or to contribute only part of the time. While the abovementioned formal models do not explicitly consider those characteristics, they can nevertheless shed some light on these issues if some of the parameters in the models are reinterpreted in the appropriate way. First, minimum pensions turn contributions into a pure tax in the margin for some low-income workers. When the self-financed pension lies below the minimum, all additional contributions that are not enough to surpass the minimum do not raise the pension and are therefore completely taxed out. In terms of Albrecht, Navarro and Vroman's model, these workers would be implicitly paying higher payroll taxes and the model predicts that payroll taxes decrease the rate of formalization. Second, many social security systems (including the Uruguayan one) offer a non-contributory pension to low-income individuals who are not eligible for contributory pensions. This benefit raises the value of working in the informal sector and decreases the incentives to accept formal sector job offers. Third, the limited capacity that the social security administration had in the past to verify whether contributions had been made, may have also increased the tax content of social security contributions for many workers. Unable to verify contributions, the administrations de facto loosened the link between contributions and pensions eroding the incentives to contribute.
These results suggest that this pension scheme requires some reform. In particular, the condition of having accumulated 35 years of contribution to access to a pension should be revised.
Several social security systems in Latin America seem to be facing similar challenges as the BPS in Uruguay and have now similar databases as the one used in this paper. The densities of contribution estimated in previous studies for countries like Argentina and Chile are similar to the ones we found for Uruguay. But the densities of contribution alone do not tell us what the probability is that a worker qualifies for a pension when he reaches the retirement age. The methodology proposed in this paper to estimate these probabilities and the factors that impact them might thus be useful to assess the situation in other countries of Latin America as well.