Introduction
Piezoelectric actuator is an important device that can output precisely controlled displacement during the application of electric field and is widely used to drive motors in lots of advanced engineering systems. Up to now, the commercially available materials used for piezoelectric actuator are dominated by lead-based ceramics due to their excellent piezoelectric properties, such as perovskite lead zirconate titanate Pb(ZrxTi1−x)O3 [Reference Zhu, Zhang, Xie, Fan, Marwat, Ma, Wang, Yang, Xiao and Zhang1, Reference Guo, Fan and Shi2]. However, due to the negative environmental impact of lead-containing substances, developing environmentally friendly lead-free piezoelectric materials is of great importance and with urgency [Reference Rödel, Webber, Dittmer, Jo, Kimura and Damjanovic3, Reference Muramatsu, Nagata and Takenaka4]. Among the developed lead-free materials, BNT-based lead-free piezoceramics are considered as one of the most promising candidates due to their high field-induced strain level [Reference Wei, Zhu, Li, Guo, Zheng and Hou5, Reference Luo, Jiang, Zhang and Li6]. Especially in the latest decade, MPB solid solutions based on BNT were designed and investigated extensively due to their enhanced strain properties, such as (Bi1/2Na1/2)TiO3–BaTiO3 [Reference Chen, Wang, Zhang, Yang and Jin7], BNT–Bi0.5K0.5TiO3 [Reference Fan, Zhang, Xie, Zhu, Ma, Wang, Yang, Xu, Xiao and Zhang8, Reference Goldstein, Krell and Kleebe9], and BNT–SrTiO3 (BNTST) [Reference Zhu, Zhang, Xie, Fan, Marwat, Ma, Wang, Yang, Xiao and Zhang1]. Moreover, the current understanding suggests that the choice of a system undergoing a similar field-induced phase transition from ferroelectric to relaxor could be more attractive for obtaining high strain. One of the promising system is the (1 − y)BNT–yST (BNTST) solid solution, as they form a complete solid solution between y = 0–1, and no tetragonal distortion is detected in the whole composition range, with all compositions showing relaxor behavior (A-site relaxor) [Reference Liu, Shi, Knapp, Ehrenberg, Fang and Chen10]. The investigations on the BNTST found that a large strain of about 0.2% could be obtained under applied field E of ∼3 kV/mm [Reference Hiruma, Imai, Watanabe, Nagata and Takenaka11, Reference Liu, Acosta, Wang, Xu, Stark and Dietz12, Reference Koruza, Rojas, Molina-Luna, Kunz, Duerrschnabel, Kleebe and Acosta13, Reference Li, Liu, Zhou, Wang, Li, Liu and Fang14]. Therefore, BNTST was chosen due to its certain advantages for obtaining large strain. Based on BNTST, various strategies, such as composition engineering and structure engineering, were carried out to modify the electromechanical properties. For example, by introducing BiMg1/2Ti1/2O3 (BMT) or NaNbO3 (NN) into the 0.93BNT–0.07ST, excellent field-induced strain performance of S max/E max ∼ 850 pm/V was achieved under an ultralow driving field of E ≤ 3 kV/mm, which was attributed to a phase transition from the ferroelectric to ergodic relaxor [Reference Tong, Li, Zhou, Liu and Fang15]. While Cho et al. found that Fe3+ modification on 0.77BNT–0.23ST promoted the diffusion of Sr2+ ions into the core region, thus shifting ferroelectric behavior toward ergodic-relaxor behavior and bringing in an effective d*33 of over 500 pm/V at relatively low electric field of 2 kV/mm at 4.0 mol% Fe3+ doping [Reference Cho, Park, Kim, Jeong, Yun, Park, Hong and Paik16]. Besides, several researchers pay attention to the effect of B-site complex cation on the crystal structure, relaxor behaviors as well as the field-induced strain behavior for the BNT-ST system [Reference Dhifallah, Turki, Marssi, Dammak and Khemakhem17, Reference Malik, Hussain, Zaman, Maqbool, Rahman, Song, Kimc and Kim18].
In this work, the cubic paraelectric perovskite Sr(Zn1/3Nb2/3)O3 (SZN) with B-site complex structure [Reference Hao, Li, Zhai and Chen19] was introduced into 0.80(Bi0.5Na0.5)TiO3–0.20SrTiO3. SZN could form a stable solid solution with BNTST and modulate the crystal structure, dielectric and ferroelectric properties as well as actuating performance. Finally, this material system gave a large field-induced strain at 2 mol% SZN and showed a good temperature stability up to 100 °C.
Results and discussion
The room temperature powder XRD patterns of the poled samples are shown in Fig. 1(a). All the samples show similar diffraction patterns, and no secondary phase can be detected, indicating the complete incorporation of (Zn1/3Nb2/3)4+complex cation into the perovskite lattice of the matrix. For modified BNT, a cubic-like global structure was observed before poling at room temperature while nanoscale P4bm platelets are already present [Reference Dorcet, Trolliard and Boullay20]. And it is known that for (1 − y)BNT–yST, it shows a rhombohedral (R3c) symmetry for y < 0.22 and transforms into pseudocubic structure with local P4bm symmetry as ST increases [Reference Liu, Shi, Knapp, Ehrenberg, Fang and Chen10]. To examine the SZN-induced phase evolution, the fine scanning XRD patterns in the 2θ range of 39°–49° were recorded, as shown in Fig. 1(b). Obviously, the diffraction around 40° for sample x = 0 splits into  $\left( {1\bar{1}1} \right)$ and (111) subdiffractions while the (200)pc diffraction around 46° with a shoulder [Reference Ge, Devreugd, Phelan, Zhang, Ahart, Li, Luo, Boatner, Viehland and Gehring21, Reference Ohwada, Hirotal, Rehrig, Gehring, Noheda, Fujii, Park and Shirane22] keeps singular, evidencing its nature of rhombohedral symmetry, which is consistent with previous reports [Reference Hiruma, Imai, Watanabe, Nagata and Takenaka11, Reference Eitel, Zhang, Shrout, Randall and Levin23]. As the SZN added, both the diffraction splitting and the
 $\left( {1\bar{1}1} \right)$ intensity reduce gradually. When x = 0.0275, the split subdiffractions around 40° merge into single one. To quantitatively elucidate the effect of SZN addition on phase structure, Fig. 1(c) depicts the relative intensity
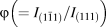 $\varphi \left( { = {{{I_{\left( {1\bar{1}1} \right)}}} / {{I_{\left( {111} \right)}}}}} \right)$ and rhombohedrality 90-γ as a function of SZN addition. As seen from Fig. 1(c), both the relative intensity φ and rhombohedrality 90-γ decrease gradually with the addition of SZN, and finally close to zero at x = 0.02 and over, demonstrating the SZN-induced phase evolution from rhombohedral (R3c) to pseudocubic symmetries, as ST itself did [Reference Liu, Shi, Knapp, Ehrenberg, Fang and Chen10].
Powder XRD patterns (a), fine-scanning XRD patterns (b), and the composition dependence of relative intensity φ of  ${{{I_{\left( {1\bar{1}1} \right)}}} / {{I_{\left( {111} \right)}}}}$ and rhombohedrality 90-γ(c) for the poled BNSZN100x samples.

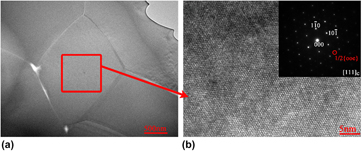
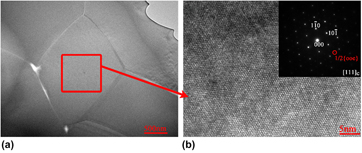
In order to probe the local symmetry existing in the pseudocubic phase, the bright field (BF) and high-resolution (HR) TEM images as well as selected-area electron diffraction (SAED) pattern alongside the [111]c zone axis for the poled sample x = 0.02 are shown in Fig. 2. In addition to x = 0.02, we also performed a TEM analysis on x = 0. The TEM observation on poled sample x = 0 demonstrates a ferroelectric domain structure, consistent with the observation on Sr2+ added BNT [Reference Shi, Fan, Liu, Bell and Rödel24]. For x = 0.02, no obvious ferroelectric domains were observed, indicating that the SZN addition disrupts the ferroelectric order of BNT-ST. Meanwhile, the BF TEM image for x = 0.02 [Fig. 2(a)] demonstrates a morphology of grains with smooth grain boundaries, indicating the well sintering effect of x = 0.02. Moreover, the ordered atomic arrangement in the HR TEM picture [Fig. 2(b)] shows the single crystal feature. Besides, the SAED pattern was observed in several grains, and the typical image was illustrated in inset of Fig. 2(b). There appears the 1/2{ooe} superlattice diffraction spots (“o” and “e” represent odd and even Miller indices, respectively), which indicates the a −a −a + tilting of the oxygen octahedra in perovskite lattice [Reference Howard and Stokes25] and implies the occurrence of local P4bm symmetry. In brief, increasing SZN induces the phase transition from the R3c to P4bm symmetries, which will affect the electric properties and field-induced strain behavior.
BF TEM (a) and HR TEM (b) images of sample x = 0.02. The inset in (b) shows the SAED pattern alongside [111]c zone axis.

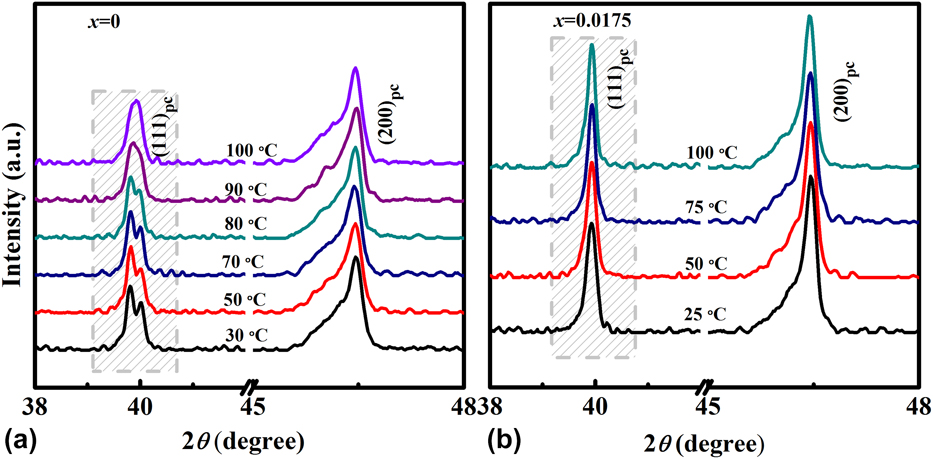
Prior to the poling, the BNT-based compositions around MPB generally exhibit a “cubic” structure with P4bm nanodomains [Reference Ma, Guo, Beckman and Tan26]. The asymmetric ferroelectric ordering are grown from an unpoled pseudocubic structure due to the lattice distortion induced by the applied field [Reference Hao, Bai, Li, Shen and Zhai27], which will be destabilized due to the thermal depolarization. To examine the thermal stability of the R3c structure, the temperature-variable XRD measurement was carried out on the poled BNSZN100x samples. As seen from Fig. 3(a), upon heating, the splitting of (111)pc diffraction for x = 0 holds on before the temperature arrives to 90 °C, implying the temperature stability of field-induced ferroelectric domains with R3c symmetry. At 90 °C, the splitting of (111)pc diffraction vanishes, implying the thermal-induced destabilization of the ferroelectric macrodomains, i.e., the thermal depolarization occurs around this temperature [Reference Otoničar, Škapin, Jančar, Ubic and Suvorov28]. However, for x = 0.0175 [Fig. 3(b)], no splitting or obvious peak shifting is observed at the measuring temperature range, implying that the field-induced R3c is unable to be stabilized after the external applied field releases, even though the temperature lowers to room temperature. In other word, the ergodic polar nanoregions (PNRs) control the average structure of x = 0.0175 due to that it will revert back to its original weak polar state after the external field releases [Reference Dittmer, Gobeljic, Jo, Shvartsman, Lupascu, Jones and Rödel29]. For (200)pc peak, the singular peak with a shoulder maintains in the testing temperature range. The shoulder appeared in (200)pc peak at all temperatures can be attributed to the skin effects, as suggested by Ge et al. and Ohwada et al. [Reference Ge, Devreugd, Phelan, Zhang, Ahart, Li, Luo, Boatner, Viehland and Gehring21, Reference Ohwada, Hirotal, Rehrig, Gehring, Noheda, Fujii, Park and Shirane22]. In a word, the increasing SZN reduces the thermal stability of field-induced ferroelectric order with R3c symmetry. Both the composition-induced transition from R3c to P4bm symmetries and the reduced thermal stability of ferroelectric R3c phase induced by increasing SZN will further affect the electrical and electromechanical behaviors.
Temperature-variable XRD patterns of the poled samples x = 0 (a) and x = 0.0175 (b).

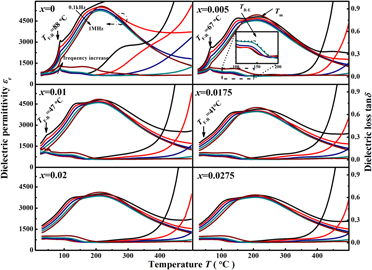
The temperature-dependent dielectric permittivity (εr) and dielectric loss (tanδ) of the poled samples (x = 0–0.0275) at different frequencies are shown in Fig. 4. As seen from Fig. 4, for the sample x = 0.005, three dielectric anomalies occur upon heating, corresponding to different transition processes: around 67.4 °C, a steep skip of εr without apparent frequency dispersion is observed, which is ascribed to the ferroelectric–nonergodic relaxor transition and defined as T F-R; as the temperature increases, there appears a diffusive and frequency-dispersed peak in the tanδ accompanied with diminishing of the frequency dispersion in the εr, which reflects the nonergodic relaxor–ergodic relaxor transition and defined as T R-E [Reference Lerner, Mierzwa, Paluch, Feldman and Ishai30, Reference Li, Zhu, Wei, Zheng, Hou and Hao31]; further increasing the temperature, the maximum of the εr with frequency dispersion arrives at temperature T m, which is referred as to the relaxation of ergodic PNRs [Reference Tong, Li, Zhou, Liu and Fang15]. Other samples with different SZN additions show similar dielectric responses. For 0 < x ≤ 0.0175, with increasing SZN, the T F-R lowers gradually from 88.4 °C for x = 0 to 41.4 °C for x = 0.0175, showing the SZN-induced destabilization of the field-induced ferroelectric order. However, for x > 0.0175, no obvious dielectric anomaly was observed at low temperature, which may be attributed to the composition-induced instability of the field-induced R3c symmetry, as observed in XRD analysis [Figs. 2(b) and 3(b)]. Another possibility could be attributed to the fact that the relaxation process of the remanent ferroelectric state is almost replaced by the ergodic PNRs [Reference Rödig, Schönecker and Gerlach32]. Especially, the sample x = 0.02 locates at the composition boundary between nonergodic relaxor and ergodic relaxor, which is beneficial for obtaining large strains [Reference Wei, Zhu, Li, Guo, Zheng and Hou5]. Moreover, in the all composition ranges, the T R-E keeps almost unchanged with the increasing SZN, which enlarges the gap between T R-E and T F-R. The enlarged gap between T R-E and T F-R will be helpful for the temperature insensitivity of the field-induced strain [Reference Li, Zhu, Wei, Zheng, Hou and Hao31]. In a word, the variation of the feature temperatures reveals the destruction of ferroelectric ordering and the percolation of PNRs into low temperature by increasing SZN.
Temperature dependent dielectric response of poled BNSZN100x samples.

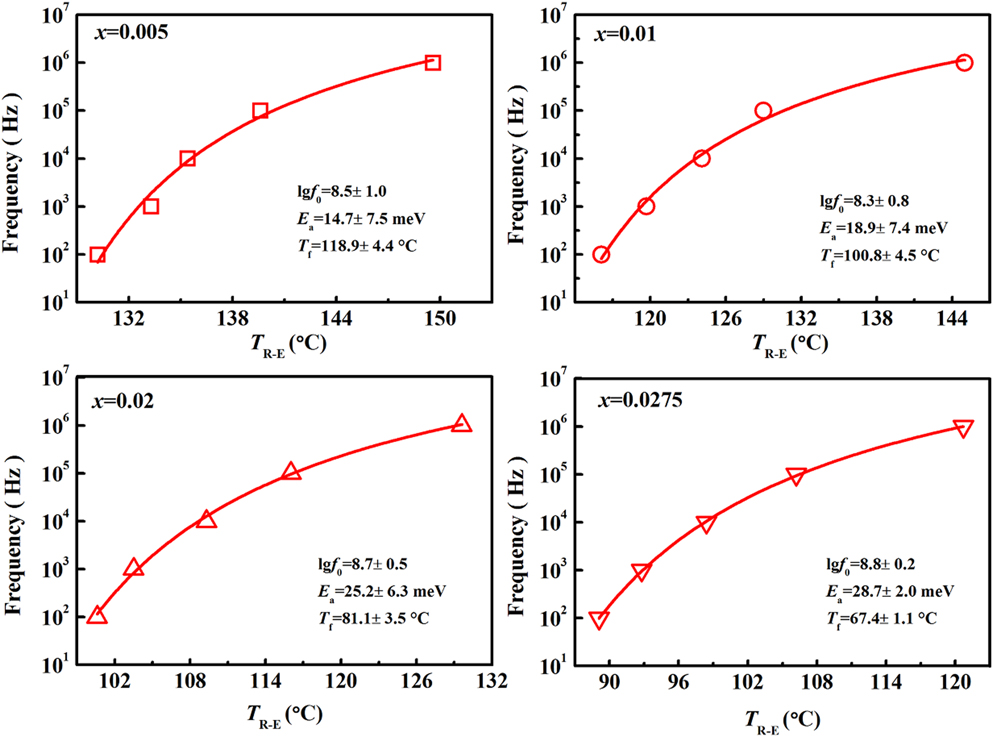
To explore the dynamic behavior of PNRs, the dependence of the T R-E on the frequency was investigated. As generally known, BNT is a A-site relaxor, the addition of ST will enhance the relaxor behavior; hence, the dielectric response of BNTST can also be regarded as a polar-glassy system [Reference Khan, Nadeem and Idriss33]. Figure 5 gives the frequency dependence of T R-E of samples x = 0.005–0.0275, which should obey the Vogel–Fulcher equation  $f = {f_0}\exp \left( { - {{{E_{\rm{a}}}} / {{k_{\rm{B}}}\left( {{T_x} - {T_{\rm{f}}}} \right)}}} \right)$, where, T x is the temperature where the imaginary permittivity arrives maximum at corresponding frequency f; the parameters E a, T f, f 0, and k B are the freezing activation energy, the freezing temperature, the attempt frequency, and the Boltzmann’s constant, respectively. As seen from Fig. 5, the most noteworthy is that the E a increases continually from 14.7 meV for x = 0.005 to 28.7 meV for x = 0.0275, which implies that the SZN addition into BNTST weakens the coupling between PNRs. The weakening of the coupling between PNRs will result in a critical slowing down of the PNRs dynamics, and further influences ferroelectric behaviors.
The frequency dependence of T R-E of samples x = 0.005–0.0275. The solid line is the fitting on the Vogel–Fulcher equation.

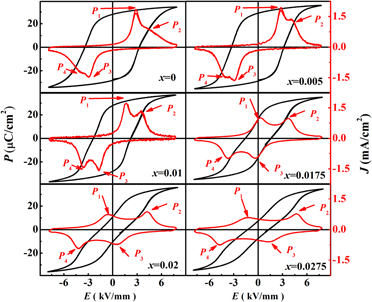
To verify the influence of dynamic behavior of PNRs on ferroelectric behavior, the room temperature ferroelectric hysteresis (P–E) loops and current density (J–E) curves for samples x = 0–0.0275 were shown in Fig. 6. For x = 0, the P–E loops show a saturated shape with an adequately high P r, which is a feature of a ferroelectric, and could be ascribed to the switching of ferroelectric domains at E = E C. However, the J–E curves showed “double peaks” even though the peak P 2 is overlapped with the P 1, indicating the presence of other polarizing species than the ferroelectric macrodomains. Generally, the sharp peak P 1 at low field corresponds to the polarization response of ferroelectric macrodomains while the diffusive peak P 2 (pair with P 4) at high field corresponds to the polarization response of the nanoscaled domains or PNRs, respectively [Reference Zhao, Zuo, Fu and Shi34, Reference Viola, Mckinnon, Koval, Adomkevicius, Dunn and Yan35]. As x increases, the P–E loops keep on the saturated shape while the peak P 1 in the J–E curves shifts to low field, thus rendering the peaks P 1 and P 2 separate gradually and indicating the breaking down of ferroelectric domains. At x = 0.01, the P–E loop shows a slightly pinched shape and the current peaks P 1 and P 2 separate thoroughly. Further increasing x over 0.01, the severely pinched P–E loops appear, which may be ascribed to the enhanced polarization contribution of the ergodic PNRs [Reference Han, Jo, Rodel, Hong, Tai and Lee36, Reference Ma, Chen, Huang, Chen, Zhou and Fang37]. Meanwhile, in the J–E curves, the current peak P 1 moves to negative field side, and a current peak, designated as P 3, is observed in the discharging side opposite to the P 1, which signals that the polarization response begins to be controlled by the ergodic PNRs [Reference Karthik, Radhakrishanan, Narayana and Asthana38] and constructs the structural basis for the generation of large field-induced strain. Further increase of x over 0.02 renders the P 3 move to high field, indicating that the ergodic PNRs be dominant completely.
P–E loops and the J–E curves measured at a frequency of 1 Hz for BNSZN100x samples.

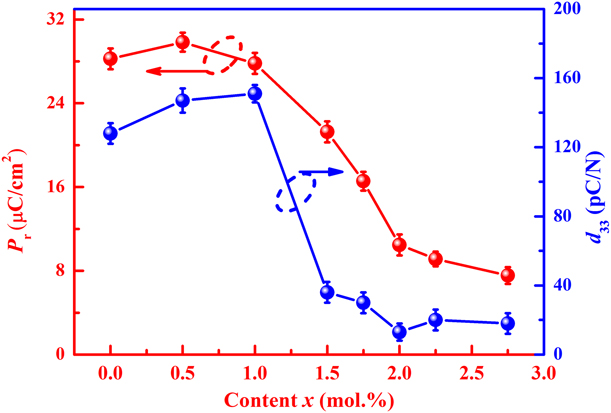
To elucidate the polarization contribution of macrodomains and PNRs, the P r versus increasing SZN is shown in Fig. 7. The remanent polarization P r could be referred as the contribution of ferroelectric domains that do not switch back or return to PNRs upon removal of field [Reference Zhu, Zhang, Xie, Fan, Marwat, Ma, Wang, Yang, Xiao and Zhang1]. As seen from Fig. 7, the P r decreases with increasing SZN, indicating that the contribution from ferroelectric domains reduces. In other words, the contribution from ergodic PNRs to polarization enhances gradually. When x ≥ 0.02, the P r value keeps almost unchanged, inferring that the contribution of ergodic PNRs saturates and the remanant ferroelectric domains almost disappear. To verify the change of ferroelectric domain contribution, the quasistatic piezoelectric coefficient d 33 was also recorded. Generally, the d 33 originates from the intrinsic lattice response and the extrinsic response from motion of domain walls; hence, the magnitude of d 33 can reflect the stability of the field-induced ferroelectric domains after artificial poling. The high d 33 occurs in the samples x ≤ 0.01, indicating that their well stability of field-induced ferroelectric order [Reference Zheng, Wu, Xiao and Zhu39], which can be explained by the occurrence of high P r. As x increases over 0.01, the value of the d 33 drops dramatically; especially for the sample x = 0.02 and over, the d 33 value drops closing to zero, which implies that the sample x = 0.02 is controlled by the ergodic PNRs, consistent with the dielectric analysis. The variation of P r and the d 33 also affirm the composition-induced growth of ergodic PNRs, and the composition boundary of nonergodic relaxor and ergodic relaxor is fixed around x = 0.02, which constructs the structure basis to obtain a large strain.
The P r and the quasistatic piezoelectric coefficient d 33 as a function of SZN.

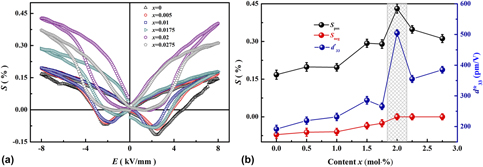
The room temperature bipolar strain loops for the BNSZN100x samples are shown in Fig. 8(a). As seen from Fig. 8(a), the bipolar S–E strain loops for x ≤ 0.0175 exhibit a butterfly shape, which is typical for a ferroelectric [Reference West and Payne40]. However, for x ≥ 0.02, the S–E loops turn into a sprout one due to that the samples be dominated by ergodic PNRs. Figure 8(b) depicts the positive strain S pos, negative strain S neg, and normalized unipolar strain d*33(=S max/E max) as a function of SZN content. For x = 0, the sample presents a relatively large S neg, originating from the back-switching of ferroelectric domains [Reference Fu and Zuo41] and showing its strong ferroelectricity, as observed in P–E loops. For x < 0.02, the S neg decreases gradually with x increasing, which could be the result of the reduction of ferroelectric phase and the growth of ergodic PNRs [Reference Wei, Zhu, Li, Guo, Zheng and Hou5]. As x increases to 0.02 and over, the S neg approaches to zero. As a result, the maximum bipolar strain S pos of 0.43% appears at x = 0.02 with a normalized unipolar strain of 505 pm/V under 8 kV/mm. The occurrence of the largest strain at x = 0.02 could be ascribed to that the composition x = 0.02 locates around the critical composition boundary between nonergodic relaxor and ergodic relaxor. Moreover, for x = 0.02, a largest d*33 value could be achieved at lower applied electrical fields with a maximum of 675 pm/V at 4 kV/mm, which further highlights this composition’s potential for use in actuator applications.
Bipolar strain loops of BNSZN100x ceramics at room temperature (a) and the composition dependence of positive strain (S pos) and negative strain (S neg) and normalized unipolar strain (d*33) (b).

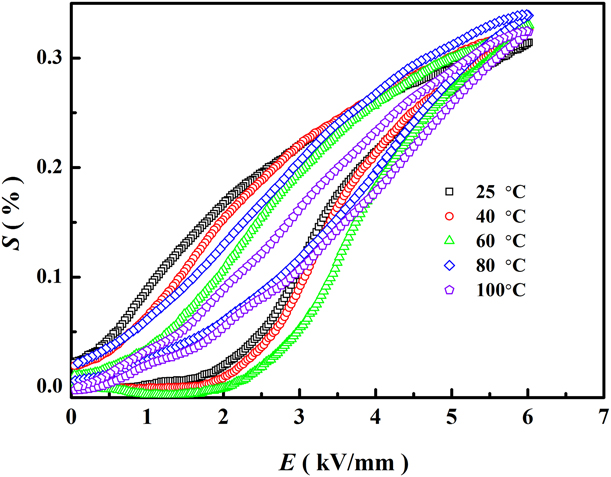
For the actuator application, the temperature insensitivity is an important performance. To inspect the temperature stability of field-induced stain for x = 0.02, the temperature-variable unipolar S–E curves were measured under 6 kV/mm, as shown in Fig. 9. It is interesting that the field-induced strain fluctuates in the range from 0.31 to 0.33% by a slight deviation less than 7%, while the temperature up to 100 °C from 25 °C, indicating the temperature-insensitive feature. Besides, as the temperature increasing, the strain hysteresis decreases gradually. The enhanced temperature stability could be assorted to the widened gap between T R-E and T F-R [Reference Fang and Jean42], as revealed by the temperature-dependent dielectric responses in Fig. 4. The large and temperature-insensitive strain obtained in the composition x = 0.02 gives it a promising potential in application of precision position controlling devices.
Temperature-dependent unipolar strain (S–E) at 1 Hz of sample x = 0.02.

Conclusion
Lead-free BNSZN100x ferroelectric ceramics with perovskite structure were successfully fabricated by a columbite route. It is shown that increasing SZN causes the phase transition from R3c to P4bm symmetries and the destabilization of field-induced ferroelectric R3c phase, inducing the nonergodic relaxor–ergodic relaxor transition temperature decreasing to around room temperature, which results in the composition phase boundary between nonergodic relaxor and ergodic relaxor locating around x = 0.02. For the sample x = 0.02, a large field-induced bipolar strain of 0.43% and a normalized unipolar strain of 505 pm/V under 8 kV/mm with good temperature-insensitivity up to 100 °C were achieved. The present work indicates that BNT-based ceramic is promising for actuator applications.
Materials and characterization
BNT-based lead-free piezoceramics with nominal composition of (1 − x)[0.80(Bi0.5Na0.5)TiO3–0.20SrTiO3]–xSr(Zn1/3Nb2/3)O3 (BNSZN100x, 0 ≤ x ≤ 0.0275) were prepared by the columbite route from Bi2O3 (purity ≥99.0%), SrCO3 (purity ≥99.0%), Na2CO3 (purity ≥99.8%), TiO2 (purity ≥99.0%), ZnO (purity ≥99.0%), and Nb2O5 (purity ≥99.0%). The coulumbite ZnNb2O6 was prepared by the solid synthesis method: the predetermined amounts of ZnO and Nb2O5 were mixed and the powders in stoichiometric ratio were ball-milled using zirconia balls in ethanol for 12 h, and then calcined at 1000 °C for 4 h to obtain ZnNb2O6. Next, the ZnNb2O6 was mixed with the oxides and carbonates Bi2O3, SrCO3, TiO2, and Na2CO3 and then the resulting slurry was calcined at 850 °C for 4 h. The calcined BNSZN100x powders were subsequently ball-milled in ethanol again for 12 h and then pressed into green pellets at 300 MPa. After removing the binder at 650 °C for 12 h, the green pellets were sinter at 1200 °C for 4 h in a covered alumina crucible.
The crystal structure was determined by X-ray diffraction (XRD; D8 Advance, Bruker, Karlsruhe, Germany) using Cu Kα (1.54178 Å) radiation. Before the XRD measurement, the samples were poled under 5 kV/mm at 40 °C for 30 min and field-cooled to room temperature. For regular XRD testing, the sample pellets were crushed into powder. For the temperature-variable XRD testing, the poled sample pellets were used due to the limitations of the test instrument and poor thermal conductivity of powder, as suggested by Lu et al. [Reference Lu, Dong, Liu, Huang, Han, Zhang and Meng43]. The lattice distortion 90-γ and the relative intensity  $\varphi \left( { = {{{I_{\left( {1\bar{1}1} \right)}}} / {{I_{\left( {111} \right)}}}}} \right)$ were evaluated on the XRD data using a software JADE 6.5 (Materials Data, Livermore, California). Transmission electron microscopy (TEM; Tecnai F30, FEI, Hillsboro, Oregon) was applied to inspect the local lattice structure.
For the measurement of the electric properties, silver paste was sprayed on the both sides of sample pellets and subjected to thermal treatment at 650 °C to realize the ohmic contact. The dielectric permittivity and loss were measured at different frequencies in the range of 0.1–100 kHz, using an LCR meter (E4980, Agilent, Santa Clara, California) equipped with an automated temperature controller. Ferroelectric polarization(P)–field(E) loops and field-induced strain were measured in silicone oil using a ferroelectric tester (Premier II, Radiant Technologies, Albuquerque, New Mexico) equipped with a photonic sensor (2000, MTI, Albany, New York) at 1 Hz.
Acknowledgment
This work was supported by the National Natural Science Foundation of China (Grant Nos. 51602012 and 51677001), the Natural Science Foundation of Beijing (Grant No. 2192009), Ri-Xin Talents Project of Beijing University of Technology (Grant No. 2017-RX(1)-15), and Beijing Municipal High Level Innovative Team Building Program (No. IDHT20170502).