Introduction
Paramagnetic optically active centers in solids are of prime importance in an increasing range of applications, particularly in nanosensing technology and quantum information processes.[Reference Weber, Koehl, Varley, Janotti, Buckley, de Walle and Awschalom1, Reference Barry, Turner, Schloss, Glenn, Song, Lukin, Park and Walsworth2] The spins associated with color centers are exquisitely sensitive to the environment perturbations and the external fields that drive them. Thus, these paramagnetic color centers are utilized as fluorescent probes for sensing technology and biologic imaging.[Reference Schrand, Hens and Shenderova3–Reference Shi, Zhang, Wang, Sun, Wang, Rong, Chen, Ju, Reinhard, Chen, Wrachtrup, Wang and Du6] The environmental noise induces two kinds of changes to the spin quantum state: (1) Spin relaxation, which is also called longitudinal relaxation or T 1 (spin–lattice relaxation time) process. It refers to the change of the longitudinal component of the spin. (2) Spin dephasing, which is also called transverse relaxation or T 2 (spin coherence time) process. It refers to the transverse components of the spin magnetization vector. The spin quantum decoherence induced by random noises from the surroundings (electron and nuclear spins in the lattice) is therefore utilized to reveal the environmental information. The negatively charged nitrogen-vacancy (NV) color center in diamond, denoted as NV(−), is a prominent candidate that possesses both long longitudinal and transverse relaxation times under ambient conditions.[Reference Balasubramanian, Neumann, Twitchen, Markham, Kolesov, Mizuochi, Isoya, Achard, Beck, Tissler, Jacques, Hemmer, Jelezko and Wrachtrup7–Reference Rondin, Tetienne, Hingant, Roch, Maletinsky and Jacques9] As a nanoscale sensing, NV centers can sensitively detect paramagnetic and nuclear spins in its vicinity by using T 1 and T 2 AC sensing magnetometry scheme.[Reference Hong, Grinolds, Pham, Sage, Luan, Walsworth and Yacoby10] The spin–lattice T 1 time of near-surface NV was employed to sense paramagnetic ions (e.g., Gd3+, Mn2+, and O2)[Reference Steinert, Ziem, Hall, Zappe, Schweikert, Götz, Aird, Balasubramanian, Hollenberg and Wrachtrup11] and magnetic Johnson noise,[Reference Kolkowitz, Safira, High, Devlin, Choi, Unterreithmeier, Patterson, Zibrov, Manucharyan, Park and Lukin12] while the spin coherence T 2 time of near-surface NV was sensitive to the kHz fluctuations induced by nuclear spins, such as 1H, 19F, 31P,[Reference DeVience, Pham, Lovchinsky, Sushkov, Bar-Gill, Belthangady, Casola, Corbett, Zhang, Lukin, Park, Yacoby and Walsworth13] 13C,[Reference Laraoui, Dolde, Burk, Reinhard, Wrachtrup and Meriles14] and 29Si.[Reference Müller, Kong, Cai, Melentijević, Stacey, Markham, Twitchen, Isoya, Pezzagna, Meijer, Du, Plenio, Naydenov, McGuinness and Jelezko15] Another important advantage of the host diamond is its chemical inertness; thus, fluorescent NV nanodiamonds is a suitable material for biosensing and bioimaging applications.[Reference Chen and Zhang16] NV centers also show potential for investigating quantum simulators,[Reference Cai, Retzker, Jelezko and Plenio17] quantum spin liquids,[Reference Balents18] nanoscale spin ice systems,[Reference Wang, Nisoli, Freitas, Li, McConville, Cooley, Lund, Samarth, Leighton, Crespi and Schiffer19] magnetic skyrmion lattice,[Reference Heinze, von Bergmann, Menzel, Brede, Kubetzka, Wiesendanger, Bihlmayer and Blügel20] and exotic magnetic domain walls.[Reference Rondin, Tetienne, Hingant, Roch, Maletinsky and Jacques9] Despite the versatile applications of NV in diamond, near-surface NV centers have many technical challenges to overcome. For nanosensing application, it is essential to produce the color centers in close proximity to the surface to enhance the sensitivity and spatial resolution. Consequently, the surface terminators can directly interact with these shallow NV centers. Therefore, to stabilize and optimize the properties of near-surface defect centers, surface functionalization is a crucial step when NV(−) centers are engineered within a few nanometers from the surface.[Reference Rondin, Dantelle, Slablab, Grosshans, Treussart, Bergonzo, Perruchas, Gacoin, Chaigneau, Chang, Jacques and Roch21, Reference Rosskopf, Dussaux, Ohashi, Loretz, Schirhagl, Watanabe, Shikata, Itoh and Degen22]
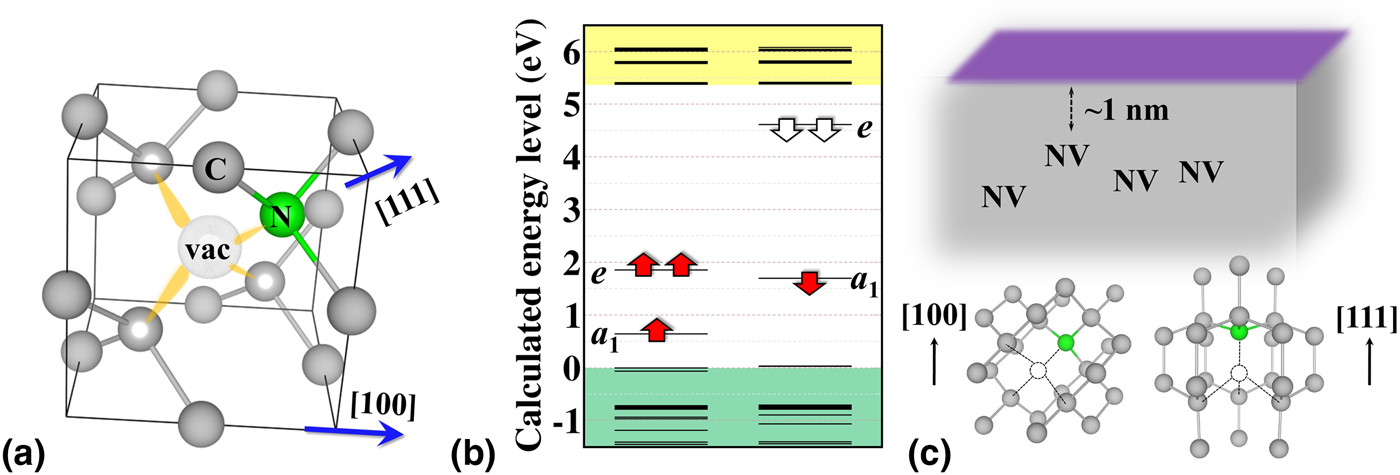
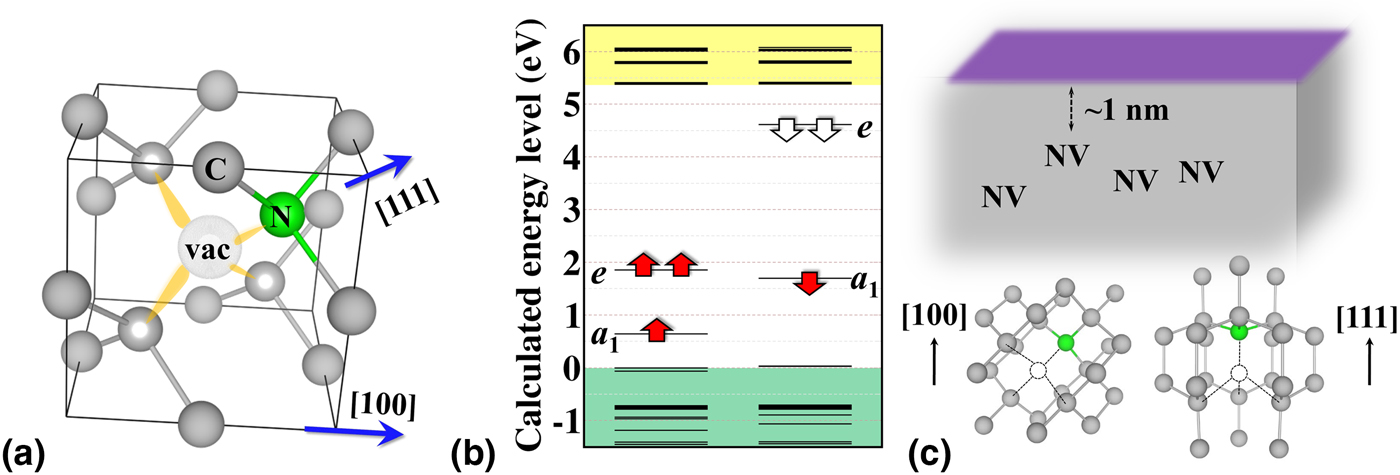
The NV center is composed of a substitutional nitrogen and an adjacent carbon vacancy aligned along one out of the four ⟨111⟩ crystallographic axes of diamond, exhibiting C 3V structural symmetry, as shown in Fig. 1(a). To achieve high sensitivity and spatial resolution, the NV center has to be as close as possible to the surface, and the surface termination will significantly affect the electronic and optical properties of near-surface NVs. Advanced technologies, e.g., low-energy ion implantation[Reference Ofori-Okai, Pezzagna, Chang, Loretz, Schirhagl, Tao, Moores, Groot-Berning, Meijer and Degen23] and nitrogen delta-doping,[Reference Ohno, Heremans, Bassett, Myers, Toyli, Jayich, Palmstrøm and Awschalom24] have already made possible to engineer NV centers <1 nm in depth from the surface in a controlled fashion, and luminescent nanodiamonds in ultrasmall size of ~5 nm[Reference Bradac, Gaebel, Naidoo, Sellars, Twamley, Brown, Barnard, Plakhotnik, Zvyagin and Rabeau25] could be fabricated as well where NV centers are naturally located very close to the nanodiamond surface. Experimental observations indicated that the negatively charged state of these near-surface NV centers could easily convert to neutral NV.[Reference Santori, Barclay, Fu and Beausoleil26] To keep high quality of a near-surface NV(−) optical defect in sensing applications, there are several criteria that candidate surface should meet:
(1) A positive electron affinity (PEA). The electron affinity in solid is normally defined as the energy gains obtained by moving an electron from the vacuum level outside the surface to the conduction band minimum (CBM) of the solid. A negative electron affinity (NEA) leads to upward band bending on the surface,[Reference Cui, Ristein and Ley27, Reference Petráková, Taylor, Kratochvílová, Fendrych, Vacík, Kučka, Štursa, Cígler, Ledvina, Fišerová, Kneppo and Nesládek28] i.e., the hole accumulation surface layer, which can shift the surface Fermi level. As a consequence, except for heavy n-type doping, the Fermi-level will shift below the acceptor level of the NV(−) center that the electron of near-surface NV(−) will be emitted spontaneously from a NEA surface, and NV(0) will dominantly appear.[Reference Fu, Santori, Barclay and Beausoleil29]
(2) Minimize surface state intrusion. Because the NV centers are close the surface, the unoccupied surface states of surface terminators can directly mix with the empty defect states of NV(−), rendering the fluorescent state of NV(−) unstable. So, even single-photon absorption may lead to temporary intermittency in fluorescence, which manifests itself as bleaching or blinking, i.e., blinking in nanodiamonds of 5 nm in diameter,[Reference Bradac, Gaebel, Naidoo, Sellars, Twamley, Brown, Barnard, Plakhotnik, Zvyagin and Rabeau25] due to the excited electron may be trapped by the surface terminators.
(3) No surface electron spins introduced by unintentional defects or impurities. Several experimental results demonstrate that the spin coherence times are significantly shorter than those in bulk as the NV depth decreases,[Reference Rosskopf, Dussaux, Ohashi, Loretz, Schirhagl, Watanabe, Shikata, Itoh and Degen22, Reference Tisler, Balasubramanian, Naydenov, Kolesov, Grotz, Reuter, Boudou, Curmi, Sennour, Thorel, Börsch, Aulenbacher, Erdmann, Hemmer, Jelezko and Wrachtrup30–Reference Romach, Müller, Unden, Rogers, Isoda, Itoh, Markham, Stacey, Meijer, Pezzagna, Naydenov, McGuinness, Bar-Gill and Jelezko32] causing the undesirably destructive process known as decoherence suggesting that diamond surface is plagued with ubiquitous defects, which give rise to magnetic and electric field noise. However, the details of these noises are still unclear. The origin of these ubiquitous surface magnetic noises are possibly originated from molecular adsorbate (e.g., paramagnetic oxygen)[Reference Bansal, Vastola and Walker33] or surface dangling bonds induced by the disordered arrangement of the surface.[Reference Osipov, Shames and Vul’34] It implies that an atomically flat surface without surface defect or impurity is essential to avoid the appearance of surface magnetic noises.
One another important condition for some NV sensing applications is the orientation of NV centers that we can add as an additional requirement.
(4) Good alignment. The alignment homogeneity of the NVs is a critical issue when multiple NV centers are used in the sensing protocol because the spin sublevels vary depending on the angle between the symmetry axis of NV and the external field.[Reference Doherty, Dolde, Fedder, Jelezko, Wrachtrup, Manson and Hollenberg35] In a diamond bulk crystal, each carbon atom bonds with four neighboring carbon atoms in a tetrahedral arrangement. For (100)-oriented diamond surface, each carbon atom has two upward bonds and two downward bonds, thus NV centers can be arranged in two of four possible orientations. By contrast, carbon atom in (111) surface has either one bond upward with three bonds downward or three bonds upward with one bond downward. The NV center with the NV C 3-axis lying perpendicular to the surface would be optimal to achieve enhanced photon collection efficiency. The type of selective alignment can be realized by chemical vapor deposition (CVD) growth, where the alignment selectivity approaches 50% for (100) and (110),[Reference Edmonds, D'Haenens-Johansson, Cruddace, Newton, Fu, Santori, Beausoleil, Twitchen and Markham36] 73% for (113),[Reference Lesik, Plays, Tallaire, Achard, Brinza, William, Chipaux, Toraille, Debuisschert, Gicquel, Roch and Jacques37] and 99% for (111)[Reference Lesik, Tetienne, Tallaire, Achard, Mille, Gicquel, Roch and Jacques38, Reference Atumi, Goss, Briddon and Rayson39] surface. It shows that the unique orientation with NV axis parallel to the 〈111〉 direction could be obtained on (111) surface [see, Fig. 1(c)] where the photon collection efficiency is maximum. The (113) diamond surface is a potentially useful facet, which exhibits particularly high growth rate, relatively high-quality smooth film, and degree of preferential orientation for NVs.
(a) The structure of NV center in diamond. The vacant site is denoted as “vac” and four dangling bonds are plotted as yellow lobes. (b) A HSE06 calculated energy levels of the NV(−) defect in a 512-atom diamond bulk. One filled a 1 state is below VBM, which is not shown in the figure. Valence and conduction bands of the diamond host are shown as green and yellow shaded regions, respectively. The red and white arrows represent the filled and empty states of NV center, respectively. (c) A schematic illustration of shallow NV, ~1 nm below surface, in diamond. The surface terminator is symbolized by purple rectangular. The orientations of NV in (100) and (111) diamond surfaces are shown in the bottom panels.
To obtain stable fluorescence and desirable spin properties of a NV center in the vicinity of the surface, the first three criteria mentioned above should meet with diamond surface technology for NV diamond sensors. However, proper functionalization of diamond surface is far from trivial. Beside the technical difficulties of plasma and wet chemistries of diamond surfaces that can be used to control the surface terminators, the desired surface termination is not exactly known. First-principles calculations can identify the target terminators of diamond, thus ab initio simulations are essential in the development of NV diamond sensors. The defect-induced gap levels, vacuum state, and surface-induced states, can be determined in calculations,[Reference Kaviani, Deák, Aradi, Frauenheim, Chou and Gali40, Reference Chou, Retzker and Gali41] which is a major component of criteria 1 and 2. However, in the case of criterion 3, it is not a trivial work to unambiguously unravel the nature of the ubiquitous surface magnetic noise. The suitable annealing processes and acid clean treatment are capable of creating a well-ordered and smooth surface to suppress or even eliminate the ubiquitous surface spins.[Reference Chu, de Leon, Shields, Hausmann, Evans, Togan, Burek, Markham, Stacey, Zibrov, Yacoby, Twitchen, Loncar, Park, Maletinsky and Lukin42] The double electron–electron resonance measurements suggest that the ambiguous surface spins are likely unsaturated bond beneath the very top surface, thus they experience strong hyperfine coupling with surface protons.[Reference Sushkov, Lovchinsky, Chisholm, Walsworth, Park and Lukin43] These magnetic noises are absent from the surface after the diamond is annealed at 465 °C in an O2 atmosphere, and their positions can be changed and re-build when exposed back to acid treatment.[Reference Chu, de Leon, Shields, Hausmann, Evans, Togan, Burek, Markham, Stacey, Zibrov, Yacoby, Twitchen, Loncar, Park, Maletinsky and Lukin42, Reference Lovchinsky, Sushkov, Urbach, de Leon, Choi, Greve, Evans, Gertner, Bersin, Müller, McGuinness, Jelezko, Walsworth, Park and Lukin44] Oxidation of diamond surface can stabilize the charge state of NV(−), but these experiments suggest that aggressive oxidation of diamond surfaces leads to the formation of surface spin defects too. It can be suspected that the rough diamond surfaces created by acid treatments should be avoided. Alternative termination of diamond surfaces should be found where criteria 1 and 2 can be calculated directly from first principles and we restrict our study to atomically smooth surfaces that would automatically satisfy criterion 3.
In this review paper, we discuss the surface termination effects for near-surface NV center in diamond that have been determined by ab initio simulations. First, we explain the method how to calculate the energy levels of near-surface charged NV center within supercell formalism, followed by the results and analysis of near-surface NV(−) center in (100) and (111) diamond surfaces with different terminators, including hydrogen (H), oxygen (O), hydroxyl (OH), H/O/OH mixture, fluorine (F), nitrogen (N), and nitrogen–hydrogen (N/H) mixture. The different density functional theory (DFT) methods and methods beyond DFT approximations are not discussed here. We rather focus on practical solutions that can be applied at the present computer resources. Particularly, the plane wave supercell DFT methodology will be presented here as a workhorse tool in the study of near-surface NV diamond.
Computational details
First-principles calculations based on DFT were performed using the plane-wave-based Vienna Ab Initio Simulation package (VASP).[Reference Kresse and Furthmüller45] The interactions between the ions and valence electrons were treated by the PAW (projector augmented-wave)[Reference Blöchl46] method. For the exchange-correlation functionals, we used gradient-corrected Perdew–Burke–Ernzerhof (PBE)[Reference Perdew, Burke and Ernzerhof47] functional. Constant volume relaxations using a cut-off energy of 370(740) eV in the plane-wave expansion for the wave function (charge density) resulted in an equilibrium lattice parameter of 3.570 Å. Increasing the cut-off energy to 420(840) eV has changed the lattice constant by only 0.003 Å. Therefore, considering the demands of the supercell calculations, the lower cut-off energy was selected. The calculated PBE band gap of 4.2 eV is apparently smaller than experimental value of 5.4 eV. Thus, we applied a screened hybrid functional HSE06[Reference Heyd, Scuseria and Ernzerhof48] of Heyd, Ernzerhof, and Scuseria with default parameters in VASP. HSE06 calculation in diamond happens to be nearly free of the electron self-interaction errors, providing defect-levels and defect-related electronic transitions within ~0.1 eV to experiment.[Reference Gali, Janzén, Deák, Kresse and Kaxiras49, Reference Deák, Aradi, Frauenheim, Janzén and Gali50] It also provides accurate band gap, defect energy levels and surface bands. The HSE06 band gap for bulk diamond at PBE lattice parameters is 5.34 eV, which is in great agreement with experiment value of 5.4 eV. As the HSE06 is extremely demanding, we calculated the HSE06 electronic structure at the PBE-optimized coordinates. We calculated charged NV defects in an extremely large diamond bulk, 8 × 8 × 8 cubic supercells consisting of 4096 carbon atoms, as a reference of the electronic structure for the comparisons of near-surface NV in diamond. We applied the Γ-point to map the Brillouin-zone, which is sufficient for such a large supercell. Defects in the supercell were allowed to relax in constant volume till the forces were below 0.01 eV/Å.
For convergence calculations, we used the optimized lattice constants in bulk to build-up the (100) slab models. The periodicity of surface primitive cell were chosen to be [√2 × √2]R45°. There are 22 carbon layers in the slab model, and surface dangling bonds are saturated by OH ligands. The total thickness of slab model is 2.2 nm. We applied vacuum more than 10 Å along the z-direction in order to avoid direct interaction between the periodic images of the bottom and the top surfaces. This [√2 × √2]R45° slab models were optimized using 8 × 8 × 1 Monkhorst–Pack[Reference Monkhorst and Pack51] k-points where the position of the carbons in the middle double layer of the slab were fixed in this procedure. The atoms were allowed to relax until the forces were below 0.01 eV/Å. After obtaining the optimized unit cells, we constructed a (2 × 2) supercell from this [√2 × √2]R45° primitive slab model, there are totally 352 carbons and the surface lattice constant is 10.097 Å. This square surface construction eliminates the need for any dipole correction. Here we applied 2 × 2 × 1 Γ-centered k-point mesh. The same calculation parameters were applied on (100) surface with different terminations, e.g., H, OH, O, H/O/OH-mixed, F, mixed substitutional nitrogen and hydrogen termination of the top diamond layer (briefly, N/CH termination) and substitional nitrogen termination (N) For (111) diamond surface, we used a [3√3 × 5√2]R30° square-like supercell that the surface size is 13.11 × 12.6 Å2. The surface terminators are H, OH, F, and N. When defects introduced to the slab models, we allowed the system to fully relax except terminators and two layers of carbon atoms in both the bottom and top layers where the position of those atoms were fixed at their defect-free slab coordinates. The energy levels and electron affinities were calculated with a screed hybrid functional HSE06, which is capable of providing accurate electronic structures. Finally, we obtained the electron affinity of the system as the energy difference of the vacuum level and the calculated CBM.
Modeling of near-surface NV centers: treating of charged diamond slabs
The electronic structure of negatively charged NV center in diamond has been already studied in details;[Reference Weber, Koehl, Varley, Janotti, Buckley, de Walle and Awschalom1, Reference Lenef and Rand52–Reference Alkauskas, Buckley, Awschalom and de Walle57] therefore we only briefly review the main points here. Since carbon dangling bonds add three electrons and nitrogen atom two non-bonding electrons, the negatively charged NV defect has altogether six electrons around the vacancy. From the group theory analysis, there are two fully symmetric one-electron a 1 states and one doubly degenerate e-state build up from combinations of these four dangling bond states, as depicted in Fig. 1(b). As a consequence, The 3A 2 ground state of the negatively charged state of NV is a spin triplet (S = 1). The m = 0 and m = ±1 spin levels of the triplet split by 2.87 GHz[Reference Loubser and van Wyk58] caused by the electron spin—electron spin dipolar interaction in the low C 3v crystal field of the defect. Since near-surface NV center is negatively charged, therefore, charged supercell models should be considered.
In ab initio calculations of point defects, finite-size supercell approaches under periodic boundary conditions are widely used. Charged systems require careful treatment since the pseudopotential expressions for the total energy are derived in a charge-neutrality condition.[Reference Ihm, Zunger and Cohen59] The charged supercell is problematic as the electrostatic energy would be divergent. The conventional method to solve this problem is to impose an artificial background jellium charge of opposite charge density that exactly compensates for the net charge in the supercell.[Reference Leslie and Gillan60] However, this compensating background will produce another problem due to the finite-size effect and periodic boundary condition, the charged defect in the supercell suffers a spurious long-range Coulomb interaction between the periodic charge images and the artificial background charges. In recent years, numerous correction schemes have been proposed to overcome this problem.[Reference Leslie and Gillan60–Reference Kumagai and Oba69] They are usually based upon extrapolation to the limit of infinitely large supercell[Reference Castleton and Mirbt62, Reference Hine, Frensch, Foulkes and Finnis66, Reference Taylor and Bruneval67] or directly correcting “a posteriori” the calculated formation energies.[Reference Leslie and Gillan60, Reference Makov and Payne61, Reference de Walle and Neugebauer70] Here we do not attempt to provide a complete overview of these outstanding works, more detailed discussions and comparisons of different correction schemes are summarized in Refs. [Reference Dabo, Kozinsky, Singh-Miller and Marzari63, Reference Lany and Zunger64, Reference Kumagai and Oba69, Reference Castleton, Höglund and Mirbt71].
These charged correction schemes have successfully worked for materials in bulk phase; however, they might be insufficient for charged defect study in two-dimensional system such as thin-film and surface. The compensating uniform background charge leads to a dipole, which diverges upon increasing the amount of vacuum between the slab images.[Reference Komsa and Pasquarello72, Reference Komsa, Berseneva, Krasheninnikov and Nieminen73] Several different methods were proposed to solve this spurious electrostatic interaction for calculating charged defect in low-dimensional structure. The artificial electrostatic interaction between image charges can be removed by introducing a Gaussian charge distribution layer inserted in vacuum to compensate for the excess charge and to allow electric-field discontinuities across the layer,[Reference Lozovoi and Alavi74] or eliminated by a supercell size scaling scheme combining with a Gaussian model charge correction scheme.[Reference Noh, Kim and Kim75] An extension of the band-filling correction method,[Reference Lany and Zunger64] which is to correct only the filling-up conduction band by shifting all energy levels above a certain energy to a reference energy, can easily and practically be applied to adsorbate/surface systems for the calculation of adsorption energies in the dilute limit.[Reference Hellström, Spångberg, Hermansson and Broqvist76] Komsa and Pasquarello[Reference Komsa and Pasquarello72] describe “a posteriori” correction scheme for charged defect on surface, which is reproduced the corrections scheme for bulk defects given by Freysoldt et al.,[Reference Freysoldt, Neugebauer and Van de Walle65] it is relied on the dielectric constant profile extracted from the electronic structure calculation. Recently, virtual crystal approximation (VCA) was applied to calculate the formation energies of charged surface in the supercell.[Reference Richter, Sicolo, Levchenko, Sauer and Scheffler77, Reference Moll, Xu, Hofmann and Rinke78] The VCA approach has been widely used for dealing with calculations of disorder and alloy in solid.[Reference Wei and Zunger79, Reference Singh80] The VCA method for the charged system calculation with the periodic boundary condition has been implemented in the all-electron FHI-aims code;[Reference Blum, Gehrke, Hanke, Havu, Havu, Ren, Reuter and Scheffler81] the compensating background is confined to have the same spatial extent as the extra holes or electrons. Both the nuclear and electronic charge of specific slab atoms are slightly modified that the excess charge goes to the valence or conduction band, simulating free charge carriers, whereas the modified nuclear charge simulates the charged background. Overall the supercell remains neutral and this fictitious charged slab enables the charged surface calculation exactly in the same manner as for charged bulk defects. The VCA has the advantages of simplicity and computational efficiency, but the validity of mixed pseudopotentials of virtual atoms should be examined very carefully. Very recently, Vinichenko et al.[Reference Vinichenko, Sensoy, Friend and Kaxiras82] present an internally consistent approach for calculating defect formation energies of low-dimensional systems with complex dielectric profiles. It demonstrates high computational efficiency and low computational cost.
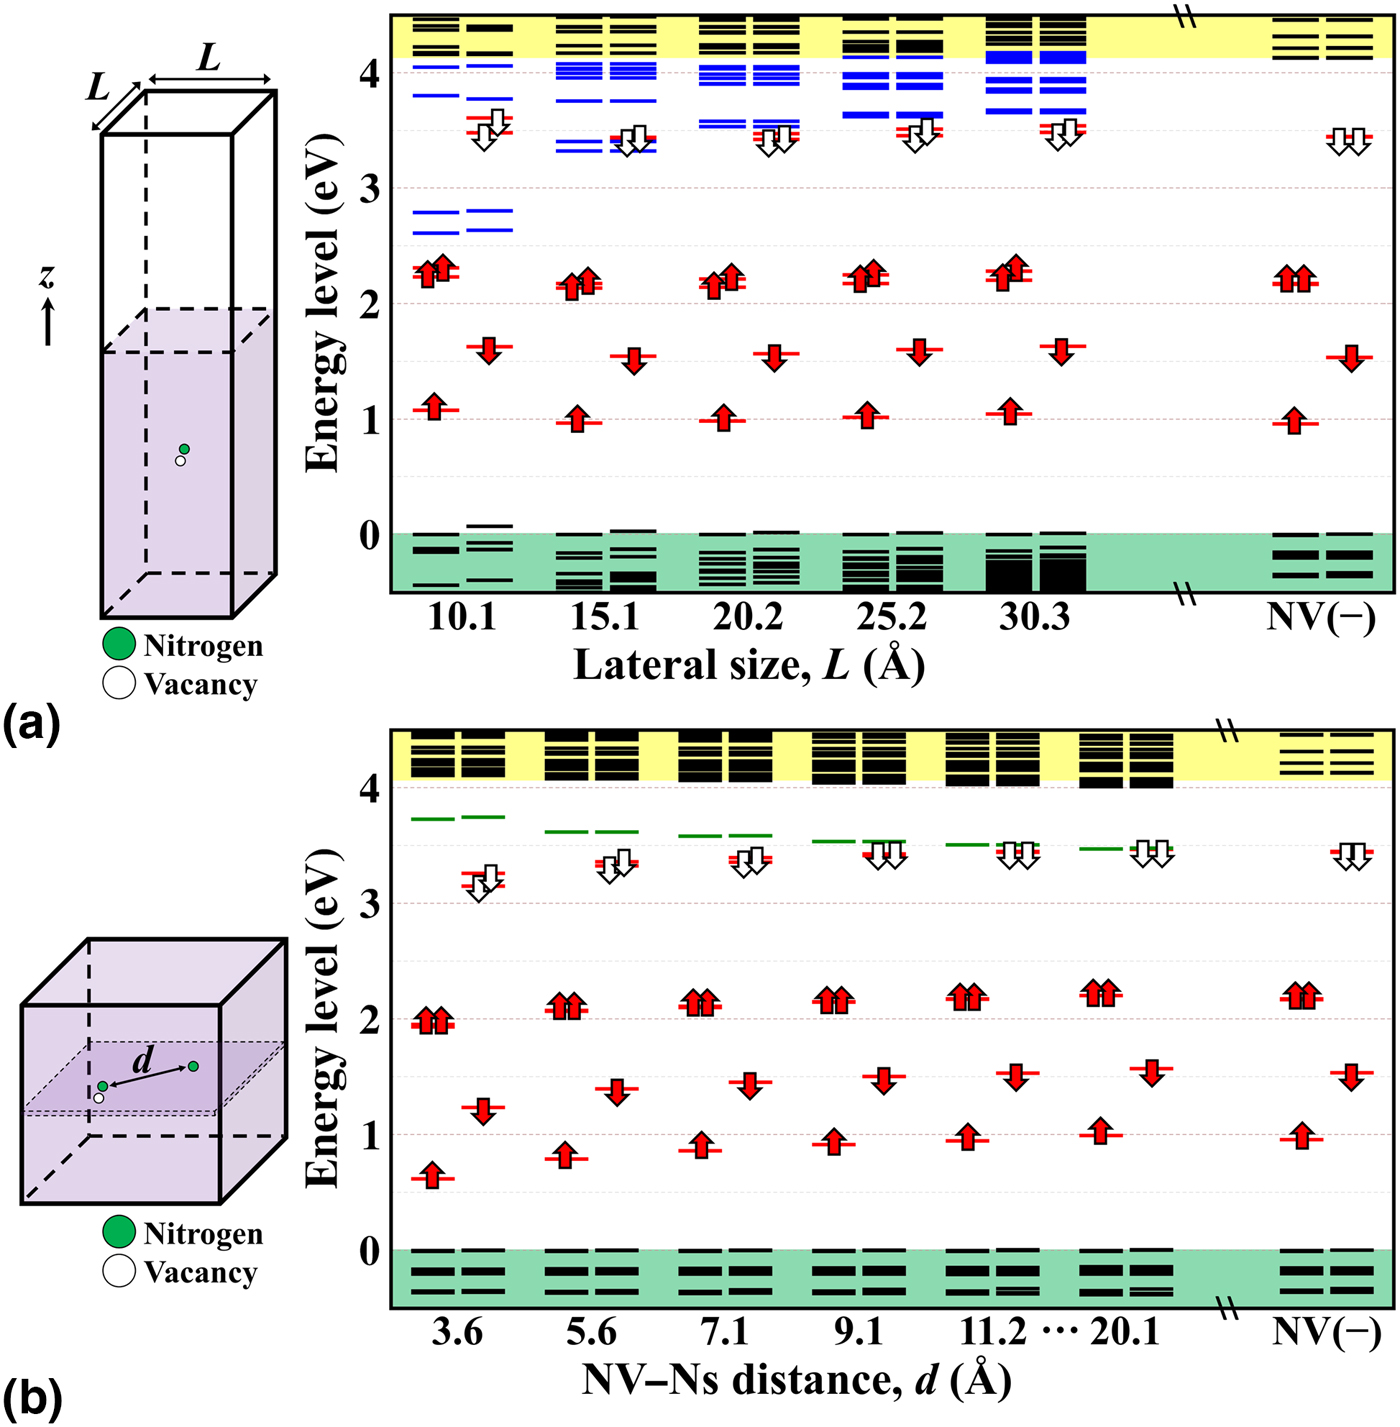
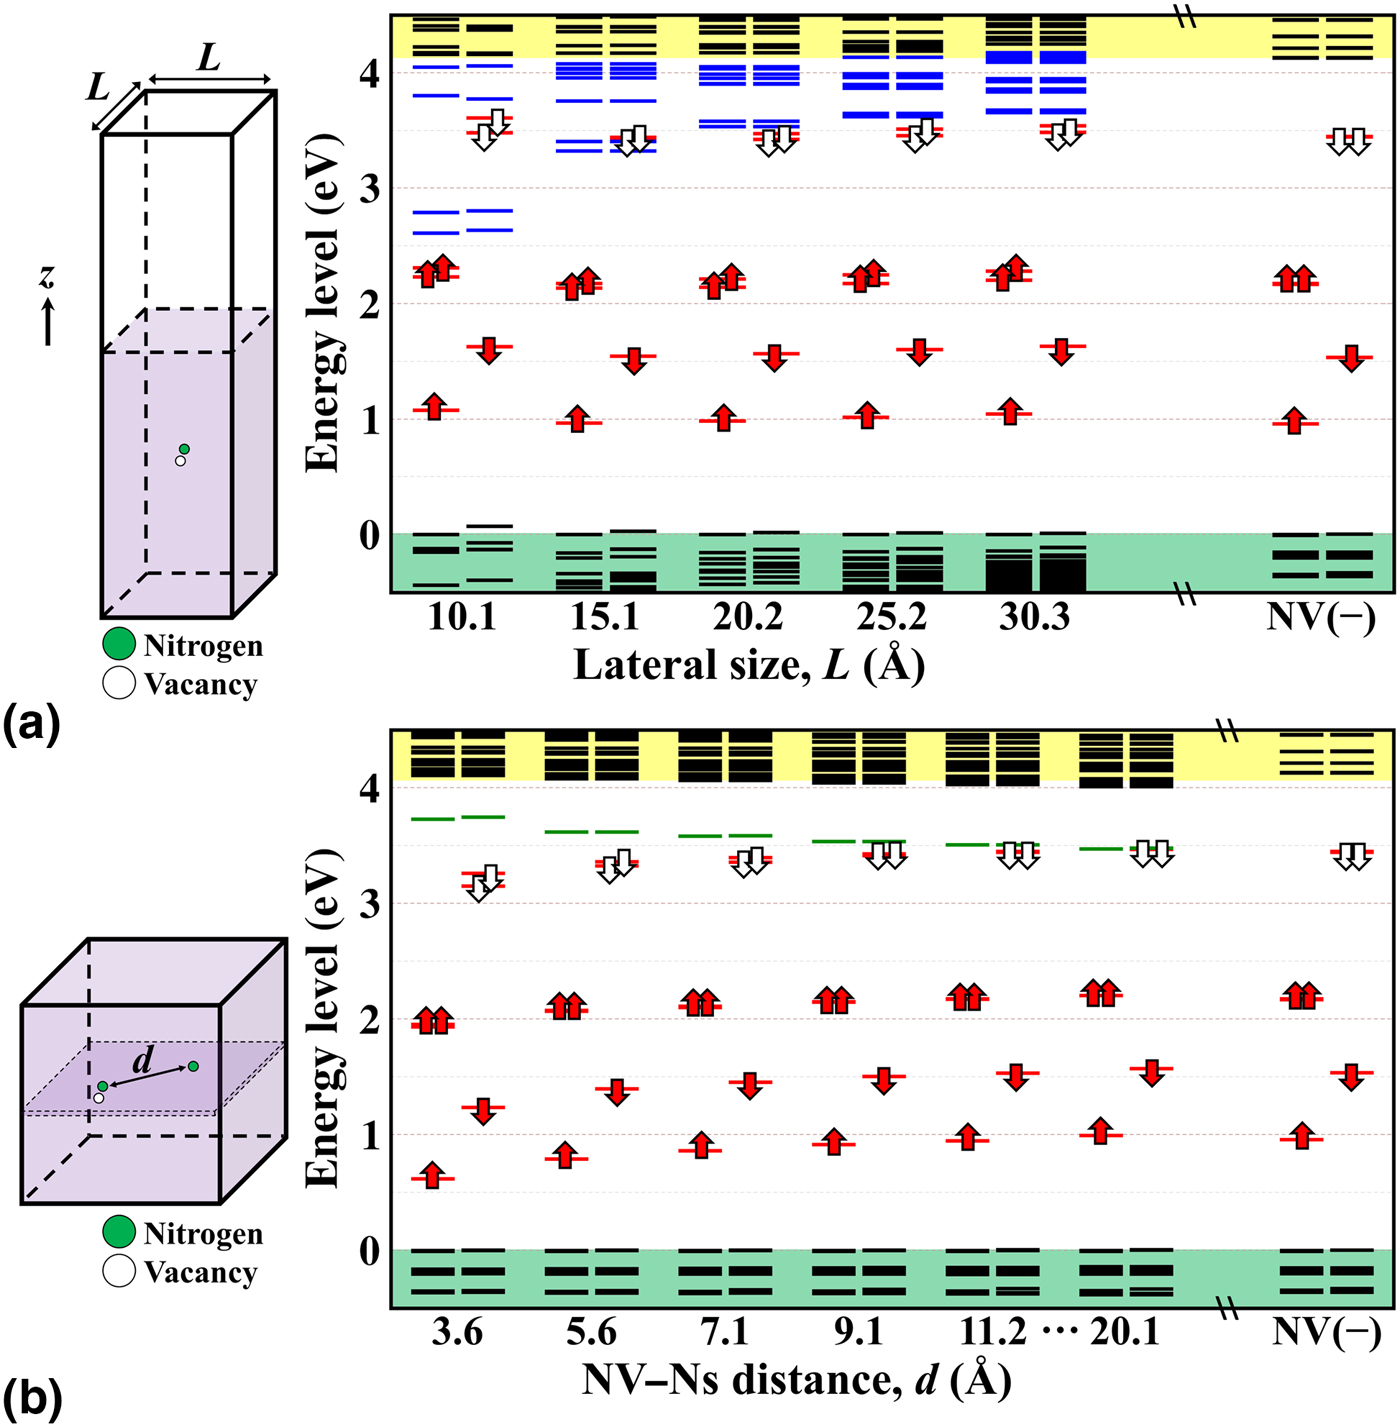
First, to appreciate the finite-size effect in a charged surface system, we calculate the energy levels of a single negatively charged NV defect in OH-termination (100) diamond surface without applying any finite-size correction upon variation of the lateral size of supercell, as shown in Fig. 2(a), from 10.1 × 10.1 to 30.3 × 30.3 Å2. We have to emphasize that we carried out PBE–DFT calculations here to check the convergence behavior, and to understand the electrostatics effects and corrections on this NV–Ns pair. Since the wave functions and the electrostatics are basically the same as in HSE06 and PBE calculations, thus the conclusions drawn from PBE studies can be applied to HSE06 results. Previous results[Reference Komsa and Pasquarello72] indicated that the formation energies of a charged slab system are found to diverge linearly with the size of the vacuum region and appear converged with increasing lateral dimensions. So, here we fixed the vacuum layer as 1.8 nm, the NV(−) defect is placed in the middle of slab and the distance between NV(−) defect and surface is roughly 1 nm. The energy levels are shown with respect to the calculated valence band edges. The energy levels of single NV(−) defect in a huge bulk of 4096 atoms (28.4 × 28.4 × 28.4 Å3 cubic supercell), denoted as NV(−) in Fig. 2, is served as reference. The electronic structure of the NV(−) defect in bulk diamond were already discussed in several publications in detail, which are not refrained here (see Ref. [Reference Gali, Fyta and Kaxiras53] and references therein). The energy levels obtained in this way correspond to the periodic supercell in which the charge of defect is compensated by a uniform background. In general, the defect levels gradually converge to the bulk values. One can see that the surface-related states obviously shift upward with the increasing of lateral size. In a 10.1 × 10.1 Å2 size cell, surface bands intrude deeply into the band gap at the position between filled and empty e-states of NV(−). As a consequence, in small size slab the empty states of NV(−) in the spin-down channel artificially fall into surface band region that can give incorrect results of NV(−) optical properties. The electronic states were found by direct comparison of charge density of the wave functions in the slab models and in the bulk supercells. This clearly demonstrates that “a posteriori” corrections are not sufficient to handle this situation as the starting charge and spin densities of the system are qualitatively wrong.
(a) The calculated PBE defect levels of a negatively charged NV center in OH-terminated diamond (100) surface as a function of lateral sizes from 10.1 to 30.3 Å. The schematic figure of the calculation supercell is shown in the left panel, the white and purple parts are vacuum and diamond surface, which are fixed in 18 and 21.8 Å, respectively. The energy levels of negatively charged NV in 4096-atom bulk supercell with lattice constant of 28.4 Å is also presented, depicted as NV(−). Particularly, the surface related bands shifted upward with increasing of supercell size. (b) The calculated PBE defect levels of NV–Ns pair, NV(−), and Ns(+), in a 4096-atom bulk supercell as a function of the distance of NV–Ns. The energy levels of Ns, NV, and diamond carbon states are colored in green, red, and black, respectively. The red and white arrows represent the filled and empty states of NV center, respectively. Valence and conduction bands are colored in green and yellow.
The above correction methods mostly focus attention on correcting the charged defect formation energy; however, the optical properties of most semiconductor materials are critically affected by defect level positions in the fundamental band gap. In a previous study of surface effects for near-surface NV defect in diamond,[Reference Kaviani, Deák, Aradi, Frauenheim, Chou and Gali40] an alternative perspective was presented to evaluate the defect level positions of the charged surface system. The charged states of single defect in slab could be modeled as a target defect in a host slab with an artificial impurity doping, which can donate electrons or holes to the target defect to form a charged defect. The electronic configuration of this additional impurity must be similar with the host atoms and be located far from the target defect to minimize the doping induced effects, e.g., dipole–dipole interaction between the target defect and artificial impurity. The concept of this method was to some degree similar with the VCA method in the sense that the supercell was neutralized. The nitrogen atom is a well-known deep donor in diamond, and the valence electronic configuration of 2s 2 2p 3 is only one electron more than carbon of 2s 2 2p 2. Therefore, the negative charge state of the NV defect could be mimicked by a NV defect with one additional electron donated from a substitutional nitrogen atom (Ns), which is placed by about 0.7 nm far from the NV, at the same depth from the diamond surface.[Reference Kaviani, Deák, Aradi, Frauenheim, Chou and Gali40] This construction could avoid the creation of an artificial dipole interaction across the slab, whereas the dipole–dipole interaction due to the negatively charged NV and the positively charged Ns within the same layer was canceled due to the square basal plane with periodic boundary conditions. A careful assessment of the defect level positions that is of high importance when interaction between the defect state and surface state was investigated.[Reference Kaviani, Deák, Aradi, Frauenheim, Chou and Gali40] Overall, in this NV–Ns pair model, the diamond slab remains neutral, thus the occupation of the defect states and the energy of the surface-related bands are qualitatively correct even in relatively small slab models.
To verify the validity of this method, the NV–Ns pair model was introduced to a system of single NV defect in a 4096-atoms bulk. The defect level shifts were identified as the function of distance between NV(−) and Ns(+) defects. The results are shown in Fig. 2(b). Two effects were visible in this NV–Ns pair model. A minor effect was the energy splitting of the empty e defect level: this splitting appeared 0.11 eV when the defects are very close as 3.6 Å and gradually vanished until distance of 20.1 Å. The splitting at distance of 7.1 Å was tiny as 36 meV, which means the NV(−) of NV–Ns pair could be considered as an almost isolated defect. However, the major effect was the downward shift of the NV(−) defect levels and upward shift of the Ns(+) defect levels as the defects were placed closer and closer with respect to the bulk counterpart. This was because the electrostatics interaction between the charges of the defects. This causes about 0.1 eV universal downward shift for the NV(−) at a distance of 7.1 Å with respect to those at distance of 20.1 Å. Therefore, it was concluded that the NV–Ns pair model could provide quantitative and reasonable results with taking the electrostatic interaction into account.
Other interactions in the slab calculations must be considered.[Reference Kaviani, Deák, Aradi, Frauenheim, Chou and Gali40] As the thickness of the slab model was restricted to 2.2 nm, quantum confinement may occur. The calculated HSE06 band gap of this slab model (without NV) is about 5.48 eV, which is 0.14 eV larger than that of bulk. The minutely enlarged band gaps were attributed to the quantum confinement effect in a 2.2 nm-thick slab model. This artificial quantum confinement effect increased the position of the e and a 1 defect levels in the spin minority channel by about 0.07 eV; thus, it was not so effective on the defect states and can still provide quantitatively fair results. Besides, top surface might modify the defect levels of interest, but the bottom surface can result in an extra mirror charge for the defect states and an extra dipole interaction that can both shift the position of the defect levels in the gap. These interactions would be absent when the bottom surface is infinitely far from the defect.[Reference Kaviani, Deák, Aradi, Frauenheim, Chou and Gali40] To evaluate the effects from bottom surface, the defect levels of single NV in OH-terminated diamond surface were calculated where the thickness of the slab was varied but fixed the position of NV at 1 nm below the top surface. It was found that the presence of the close bottom surface at distance of 1 nm uniformly shifts up the defect levels by about 0.3 eV, which was visible for both NV(0) and NV(−) defect bands.
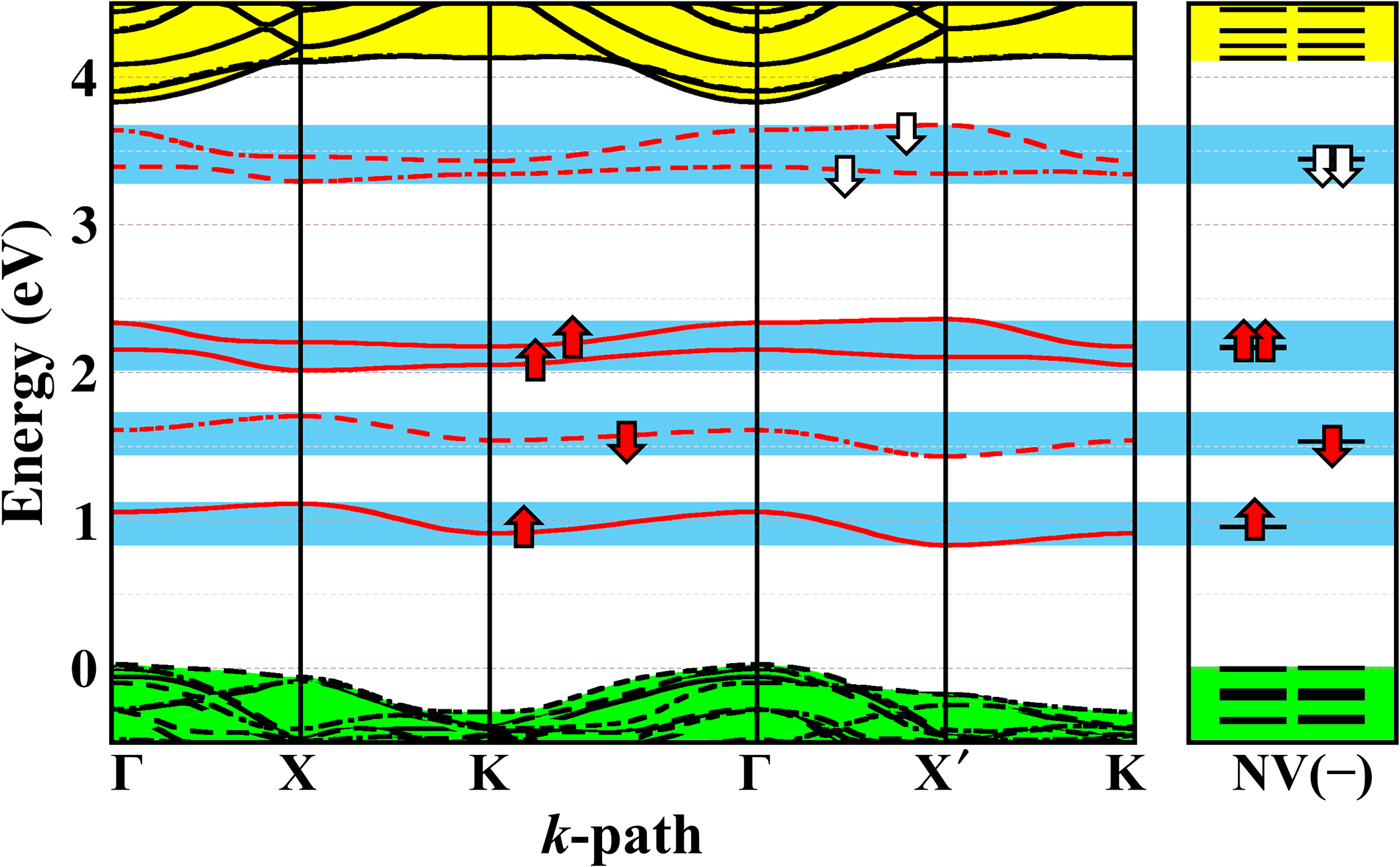
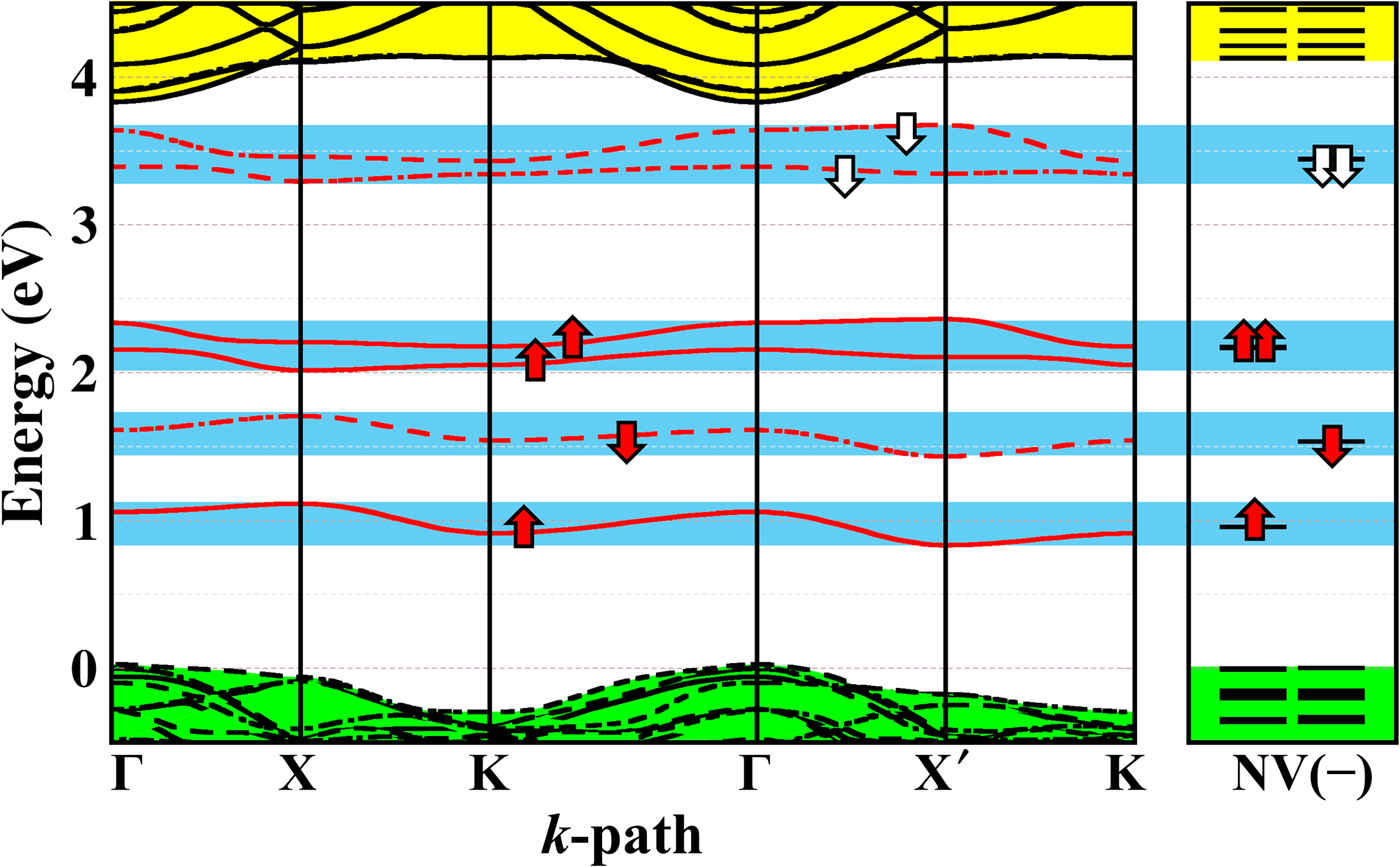
The NV–Ns pair model in OH-terminated diamond surface was then studied.[Reference Kaviani, Deák, Aradi, Frauenheim, Chou and Gali40] The PBE-calculated band structure result is shown in Fig. 3. Because of the limited size (10.1 × 10.1 Å2) of the (100) slab model restricted by the HSE06 method, the defects were relatively close to each other (~7 Å). It was found that the interaction between NV and Ns does not lead to any considerable change in the geometry of the defect compared to the isolated NV−1 in a 4096-atom bulk supercell. It was also found the interaction between the periodic images of NV itself cause ~0.3 eV dispersion in the slab model. This size-induced band dispersion of the NV defect levels in diamond slab model was discussed in Ref. [Reference Pinto, Jones, Palmer, Goss, Tiwari, Briddon, Wright, Horsfall, Rayson and Öberg83]. It was found that the average value of the dispersive defect band gives the defect level of the isolated defect. It is worthwhile to mention that this self-interaction induced by periodic images of NV(−) itself can shift downward the NV(−) levels in the band gap. An electrostatic correction proposed by Lany and Zunger[Reference Lany and Zunger84] was tested on single NV(−) in a 512-atom diamond cubic supercell (14.28 × 14.28 Å2) and it was found that an upward shift of 0.41 eV is needed.
The PBE band structure of NV(−) and Ns(+) pair in OH-terminated diamond (100) surface. The energy levels of NV(−) in 4096-atom bulk supercell, depicted as NV(−), is served as reference. For the sake of the clarity the majority spin-up and minority spin-down states are depicted by bold and dashed lines, respectively. The blue regions show the band dispersion and serve as a guide the eye to compare the alignment of slab band structure and the bulk energy levels. Valence and conduction bands are colored in green and yellow.
In summary, four different interactions affect the position of isolated defect levels in the slab model: (i) quantum confinement had a minor effect (<0.1 eV) in this slab model that can be neglected; (ii) the NV–Ns interaction shifted the defect levels downward by ~0.1 eV; (iii) the applied supercell size caused a downward shift of the defect levels by ~0.4 eV; and (iv) the presence of the bottom surface in the model resulted in ~0.3 eV upward shift in the applied slab model. This finally gave ~0.2 eV downward shift, which is an artifact of the applied NV–Ns model and the size of slab. Therefore, a +0.2 eV correction was applied to the calculated defect levels in the gap, in order to estimate their position at the surface. It was found that the position of the appropriate defect levels are all aligned within 0.1 eV to the valence band edges, independent from the surface termination, and they agree with the position of the defect levels in bulk diamond. A further note was that the empty e level in the spin minority channel lies at ~4.9 eV with respect to the valence band edge, and may interact with the surface related empty states, that may minutely shift and split the double degenerate e levels.
In the next section, we discuss the results of NV(−) defect levels in diamond (100) and (111) surface with different terminations by using this NV–Ns pair model.
Effect of different terminators of diamond (100) and (111) surface
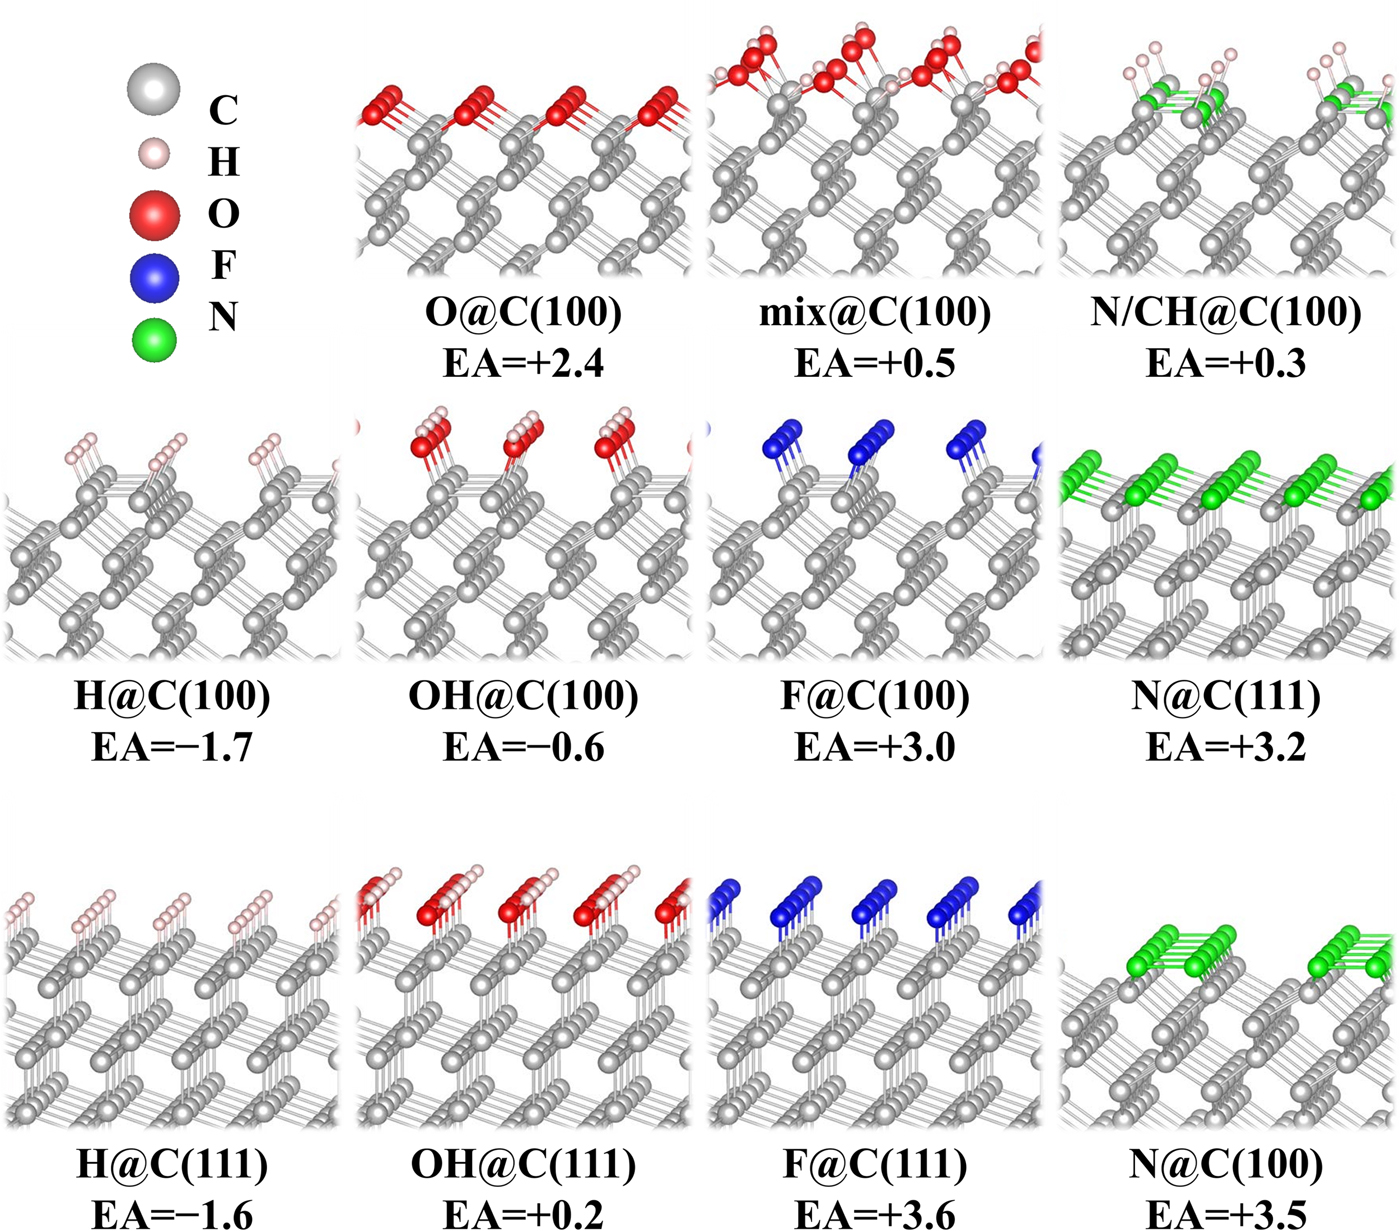
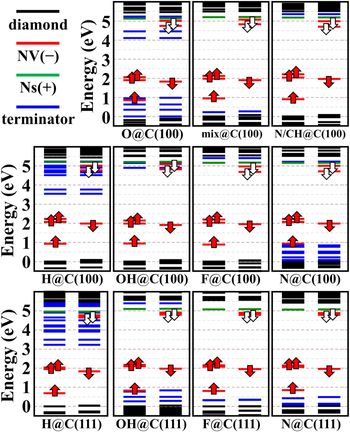
Near-surface NV center can be achieved by ion implantation techniques in a CVD diamond, and the (100) and (111) facets are the most present CVD diamond surface. Theoretical studies[Reference Pinto, Jones, Palmer, Goss, Tiwari, Briddon, Wright, Horsfall, Rayson and Öberg83, Reference Sque, Jones and Briddon85–Reference Song and Larsson89] of diamond (100) and (111) surfaces have showed that surface functionalization significantly modify the electron properties of diamond. In this review, we only focus on the surface functionalization effects on NV sensing applications. In the following, we discuss the electron affinity and surface-related state positions of the systems that ultrashallow NV in diamond (100) and (111) surface with different terminators, including H, O, OH, mixed H/O/OH, F, N, and N/CH mixture. The structures and corresponding electron affinities are shown in Fig. 4, and their NV(−) defect levels in the band gap are shown in Fig. 5.
The structures of (100) and (111) diamond surfaces with different terminations, e.g., H, OH, O, H/O/OH mix, F, N, and N/CH mixed. The corresponding electron affinities (denoted as EA, unit in eV) are also presented.

The calculated HSE06 defect levels of NV(−) in diamond at close proximity to different surface terminations at optimized PBE geometries. The black, red, green, and blue lines are diamond carbon, negatively charged NV, substitutional nitrogen, and surface-related states, respectively. The red and white arrows represent the filled and empty states of NV center, respectively.

Hydrogenation and oxygenation are conventional treatments for diamond surface termination. These treatments cause different effects for near-surface NV center. Previous experiments[Reference Petráková, Taylor, Kratochvílová, Fendrych, Vacík, Kučka, Štursa, Cígler, Ledvina, Fišerová, Kneppo and Nesládek28] have shown that the H-terminated (100) surface leads to NEA of −1.9 eV accompanied by upward band bending in the presence of water. H-terminators introduce deep surface-related states below CBM, E CBM − 1.9 eV for (100) and even deeper as E CBM − 2.3 eV for (111), that will lead to blinking or permanent bleaching.[Reference Bradac, Gaebel, Naidoo, Sellars, Twamley, Brown, Barnard, Plakhotnik, Zvyagin and Rabeau25] The theoretical results[Reference Kaviani, Deák, Aradi, Frauenheim, Chou and Gali40, Reference Chou, Retzker and Gali41] showed a NEA of −1.7 and −1.6 eV for (100) and (111) surface, respectively, which are in good agreement with experiment values. In H-terminated surface, deep sub-band gap hydrogen-related states appear. These surface hydrogen states are image states,[Reference Kaviani, Deák, Aradi, Frauenheim, Chou and Gali40] which are delocalized along the surface and show strong dispersion. The appearance of these image states was already reported in a highly convergent DFT calculation,[Reference Pinto, Jones, Palmer, Goss, Tiwari, Briddon, Wright, Horsfall, Rayson and Öberg83] nevertheless, their nature was not fully discussed there. For zero-dimension objects, such as molecules or nanoclusters, the image states are the well-known Rydberg-states in quantum chemistry. The concept of Rydberg-states or Rydberg excitations were introduced by Mulliken:[Reference Mulliken90] the lowest-energy unoccupied molecule orbitals are often originated from the antibonding combination of the covalent bonds, however, if the bonding–antibonding energy splitting is large, the high-quantum-number atomic-like state can appear as the lowest-energy unoccupied state of the molecule. Therefore, this can particularly happen in small molecules consisting of hydrogen atoms. In fact, these Rydberg-states appear in hydrogenated diamond-cage molecules, diamondoids.[Reference Vörös and Gali91] The C–C sp 3 bond in diamond is very strong, thus the energy of the antibonding combination appears at relatively high energy. When the surface carbon atoms are terminated by hydrogen atoms, the strong C–H covalent bonds create atomic-like, low-energy unoccupied states in small diamond cages. Diamond surface with relatively large band gap can also exhibit such phenomena as was first hinted in the fundamental study by Shockley,[Reference Shockley92] and a comprehensive study of this surface-bound state[Reference Han, Antonov, Wrachtrup and Bester93] was discussed recently. Indeed, this occurs for H-terminated surface. Because these image states are very delocalized, and the maximum finding probability is outside the surface, thus plane wave basis is needed to calculate their energies correctly. These states play an important role in the electron emission process. If the excited electron scatters to these image states, then it most likely will be emitted to the environment. The unoccupied defect level of NV(−), which is responsible for the spin-conserving absorption and luminescence, can easily mix with these surface image states. Because of the direct mixing of the NV defect state and the image states, any excitation of NV(−) will lead to a temporary or permanent loss of the excited electron resulting fluorescence intermittency (blinking). Therefore, a pure H-terminated surface is not suitable for NV-based sensing applications.
Usually, oxygenation treatments are used to prevent charge transfer at the surface[Reference Hauf, Grotz, Naydenov, Dankerl, Pezzagna, Meijer, Jelezko, Wrachtrup, Stutzmann, Reinhard and Garrido94] and lead to large PEA. Theoretical study[Reference Kaviani, Deák, Aradi, Frauenheim, Chou and Gali40] indicated that monolayer coverage of oxygen as in a C–O–C ether-type bonding configuration, shows a conventional PEA of +2.4 eV. However, an atomically smooth surface with full coverage of this ether-type O-termination is not possible. Oxygenated (100) surfaces are always rough due to the high degree of anisotropy in oxygen etching.[Reference Pehrsson and Mercer95] On (111) diamond surface, there is only one dangling bond on each surface carbon atoms, thus oxygen atom adsorption on (111) would show a high reactivity[Reference Zhao and Larsson86] and a significant reconstruction surface.[Reference Derry, Makau and Stampfl96] Such a poor quality surface can contain various surface defects, e.g. sp 2 carbon or dangling bonds, and then give rise to surface magnetic noises, which significantly shorten spin coherence times.[Reference Rosskopf, Dussaux, Ohashi, Loretz, Schirhagl, Watanabe, Shikata, Itoh and Degen22] Moreover, surface oxygen states are introduced into band gap in the regions 1.0 eV above valence band maximum (VBM) and 1.4 eV below CBM, which are detrimental for NV sensor applications. Oxidation of H-terminated diamond surface may generate hydroxyl groups on the surface resulting in OH-terminated diamond surface. OH-termination have been experimentally observed at the oxidized (100) and (111) single-crystalline diamond surface.[Reference de Theije, Reedijk, Arsic, van Enckevort and Vlieg97, Reference Kondo, Honda, Tryk and Fujishima98] The OH-termination gives rise to a slight NEA of −0.6 eV for (100) and slight PEA of +0.2 eV for (111) diamond surfaces. Similarly, atomic-like image states also appear on OH-terminated (100) surface at higher energies (~1.2 eV) than those at H-termination. Apparently, the C–OH unit at the surface produces high-energy atomic-like empty state than the C–H unit. A partially oxidized model surface was proposed,[Reference Kaviani, Deák, Aradi, Frauenheim, Chou and Gali40] allowing for alternating termination with H and OH groups as well as either-like C–O–C bridges [see mix@C(100) in Fig. 4]. This mixed termination surface shows slight PEA of +0.5 eV. The zigzag arrangement minimize the steric repulsion acting on the 2p states of the oxygen atoms and the ether-like bridge can take on a natural geometry, make surface still smooth atomically. As a consequence the bands of oxygen lone pairs are significantly reduced, only minor filled surface states appear at ~0.15 eV above valence band and no acceptor-like state appear near the conduction band. Since this mixed-type surface has PEA and no sub-band gap states interfere with NV(−) center, such combination of surface terminators from oxygen and hydrogen on (100) diamond surface is ideal for NV-based nanosensing. This mixed termination surface is not the consequence of the ordered surface. The H/O ration of this mixed termination should be about 1.0 ± 0.2.[Reference Kaviani, Deák, Aradi, Frauenheim, Chou and Gali40] Such surface can probably be created by gentle thermal oxidation of a hydrogenated surface or by oxidation with proper acid treatment.
Fluorination of diamond surface[Reference Havlik, Raabova, Gulka, Petrakova, Krecmarova, Masek, Lousa, Stursa, Boyen, Nesladek and Cigler99–Reference Rietwyk, Wong, Cao, O'Donnell, Ley, Wee and Pakes101] provide another opportunities for diamond chemical functionalization. Surface fluorination can be realized by exposing the surface to CF4 or SF6 plasma treatment,[Reference Schvartzman and Wind100] but it might etch diamond surface and form a polymer-like fluorocarbon layer 2–5 nm on the top layer increasing the roughness. As XeF2 precursor for fluorination of diamond surface,[Reference Rietwyk, Wong, Cao, O'Donnell, Ley, Wee and Pakes101] it avoids the formation of thick fluorocarbon layer above the surface and form an atomically smooth surface. A mild benchtop approach to nanodiamond fluorination has been developed recently, which can avoid fluorine etching and stabilize NV(−) centers in a mixed C–F and C–OH terminated nanodiamond. The fully fluorinated diamond surface provides large PEA of +3.0 eV for (100) and +3.6 eV for (111) surface, which has been confirmed in theory and experiment.[Reference Rietwyk, Wong, Cao, O'Donnell, Ley, Wee and Pakes101, Reference Tiwari, Goss, Briddon, Wright, Horsfall, Jones, Pinto and Rayson102] This F-terminated (100) diamond surface has no Rydberg-like image states in the band gap; however, few surface-related localized acceptor states do appear just below the conduction band edge.[Reference Kaviani, Deák, Aradi, Frauenheim, Chou and Gali40] The previous study of ultrasmall nanodiamonds[Reference Szilvási and Gali103] has explained the nature of these F-related localized states in detail. In a typical measurement conditions of the confocal microscope, applied for NV-based sensing, the NV(−) center is excited with a high density of photons, which leads to two-photon absorption via its real excited state, so the electron will be promoted into the conduction band with rather high probability.[Reference Siyushev, Pinto, Vörös, Gali, Jelezko and Wrachtrup104] Therefore, despite of its high PEA, these shallow surface-related empty states can still be detrimental for near-surface NV that the photoexcited electron will be trapped at the surface after two-photon absorption and lead to temporary bleaching or blinking of the NV photoluminescence signal.[Reference Kaviani, Deák, Aradi, Frauenheim, Chou and Gali40] Interestingly, these shallow fluoride surface-related states do not appear in the bandgap of F-terminated (111) diamond surface, only few occupied F-related states appear at 0.3 eV above CBM indicate that an atomically flat F-terminated (111) diamond surface is likely to be a good candidate for near-surface NV sensing applications.
So far, most of the attempts to functionalize the surface of diamond have involved terminating species of H, O, or F. While other terminated diamond surfaces have been reported in the literature: chlorinated surface[Reference Chaney and Feigerle105] shows an uncontrolled and disorder manner, Mg-oxide-terminated surface[Reference O'Donnell, Edmonds, Tadich, Thomsen, Stacey, Schenk, Pakes and Ley106] possesses extremely a high NEA of −2.0 eV, Si-terminated surface[Reference Schenk, Tadich, Sear, O'Donnell, Ley, Stacey and Pakes107, Reference Schenk, Tadich, Sear, Qi, Wee, Stacey and Pakes108] shows a two-domain (3 × 1) reconstruction with a NEA of −0.86 eV. As a result, these surface terminations might not suffice for near-surface NV in nanosensing applications. All these surface functionalization schemes mentioned above are based on single species adsorption with saturating with carbon dangling bonds on diamond surface. Another alternative termination scheme is based on singly substitutional nitrogen via plasma chemistry treatment. It has been recently demonstrated that high-quality N-terminated diamond (100) surface can be realized by using an indirect radio frequency N2 plasma process that sufficiently minimize surface damage from plasma.[Reference Stacey, O'Donnell, Chou, Schenk, Tadich, Dontschuk, Cervenka, Pakes, Gali, Hoffman and Prawer109–Reference Chandran, Shasha, Michaelson, Akhvlediani and Hoffman111] In particular, the predominant component is substitutional nitrogen or in the form of mixed N/CH at the surface, depending on the type of substrate where the fraction of nitrogen termination reaches at least 0.5 ML.[Reference Stacey, O'Donnell, Chou, Schenk, Tadich, Dontschuk, Cervenka, Pakes, Gali, Hoffman and Prawer109] The resulted 2 × 1 reconstruction pattern apparently indicated that the nitrogenated diamond (100) surface truly is atomically flat. Previous calculation results[Reference Chou, Retzker and Gali41] indicate that half and full coverage nitrogenated (100) diamond surfaces show PEAs of +0.3 and +3.5 eV, respectively. Similar to F-terminated (100) surface, both half and full coverage N-terminated (100) diamond surfaces introduce shallow N-related empty surface states. The experimentally successful achieving of N-terminated (100) surface implies the possibility of realization of N-terminated (111) surface by applying the same or similar conditions in the nitridation process.[Reference Chou, Retzker and Gali41] the N-terminated (111) diamond surface yields large PEA of +3.2 Ev, which are comparable with those of F-terminated surface, and few occupied surface nitrogen states appear below E VBM + 1.0 eV. In the previous works,[Reference Chou, Retzker and Gali41] nitrogenated (111) diamond surface exhibits at least 0.3 eV/atom lower formation enthalpy than nitrogenated (100) surface, and this occurs independent of the N coverage. This is because the favorable bonding configuration of substitutional nitrogen atoms on the top layer of (111) diamond, as they can form a perfect pyramid with its three immediate neighboring carbon atoms situated in the second layer without any measurable distortion of the diamond lattice. In the case of (100) surface, the substitutional surface nitrogen atoms also forms three N–C bonds, but the surface reconstruction stiffens somewhat there these bonds compared with those of (111) surface. It was also revealed that the N-terminated (111) surface can provide an array of nuclear spins that can be probed by the NV(−) electron spins.[Reference Chou, Retzker and Gali41] This type of surface array combining with shallow NV centers can be used as a quantum simulator. Such surface termination can open up a new route for NV-based nanosensing and quantum simulations operating at room temperature.
Conclusions
In this review paper, we provides a selective overview of issues on surface termination effects of near-surface NV center in (100) and (111) diamond surfaces. We present a list of criteria that surface termination should meet for nanosensing application, including positive electron affinity that can stabilize the charged state of NV, the exclusion of unoccupied surface state in the band gap, which may trap the electron and lead to intermittency in fluorescence, an atomically smooth surface in order to avoid the contaminants of magnetic noise, which cause decoherence of the electron spin of NV sensor. To overcome the spurious long-range interaction problem of a low dimension charged system calculation in periodic boundary condition, a NV–Ns model[Reference Kaviani, Deák, Aradi, Frauenheim, Chou and Gali40] was introduced to simulate a negatively charged single NV in diamond and demonstrated its applicability to energy level calculations. This approach keeps the whole system neutral; therefore the problem with the background jellium charge is avoided. Careful assessment of the near-surface NV(−) energy levels, determine the effects of the NV–Ns model and the size of the slab on the position of the defect levels in the gap. This NV–Ns model suffices to categorize the different surface terminations form the aspect of the photo-stability and charge state control of NV center near the surface.
Further, this NV–Ns model approach is then used to calculate the energy levels of shallow NV(−) in (100) and (111) diamond surfaces with terminators of H, O, OH, H/O/OH mixed, F, N/CH mixed, and N. Hydrogenated diamond is a robust electron emitter due to its high NEA; however, this NEA property deteriorates the charge state stability of NV center,[Reference Fu, Santori, Barclay and Beausoleil29] thus it is not suitable for NV sensing application. Oxygenation treatment on diamond surface via typical wet-chemical etching processes is frequently applied to turn the hydrogenated NEA surface to PEA surface; however, the surface becomes rough and disordered leaving a variety of uncontrolled surface-related defects with spins, which is undesirable and cause decoherence of the NV electron spin that undermine the sensitivity of the NV diamond sensor. A mixed hydrogen–oxygen surface was identified that may solve the problem of oxygenated diamond surface. Fluorination surface shows a large PEA and only few unoccupied surface-related states appear in the band gap, therefore exquisitely control the fluorination process can potentially represent a pathway to stabilize nanodiamond probes and diamond surfaces relevant for bio-imaging and quantum sensing. Functionalization diamond surface by nitridation treatment can open many opportunities in near-surface NV sensing applications. The N-terminated (111) surface is an ideal choice for NV-based quantum sensing and simulations as it has a high PEA, atomically smooth morphology, and it is diamagnetic surface.
Acknowledgments
This work was financially supported by the EU FP7 611143 (DIADEMS).