





Non-technical Summary
Historically more fossils have been described from the scientifically better explored parts of the globe, North America and Western Europe, than from other continents. If fossils from other continents were as well known, our current perception of the history of life might change, but only if fossils still to be discovered differ significantly from those already known. If the new fossils were the same as the old fossils, there could be no bias. We test this idea using new fossils recently described from China that were previously unknown to Western scientists. We use fossil echinoderms because they require special conditions to be preserved, and hence more fundamentally new forms might remain unknown. We use the early Paleozoic because high-level fossil echinoderm taxonomic diversity was maximal then and because the Chinese early Paleozoic contains several faunas that satisfy the special conditions echinoderms require to be preserved. So there is a greater chance of discovering new types. Our results show that most Chinese fossil echinoderms resemble forms already known from elsewhere, and thus, there is little evidence of bias. One possible explanation is that modern continents include sedimentary rocks deposited in different provinces during the early Paleozoic, so each may well provide an adequate sample on which to build global fossil diversity curves. Nevertheless, the rate at which new Chinese fossil echinoderms are being discovered is increasing rapidly, suggesting that the Chinese fossil record is still poorly known. Many new Chinese fossils remain to be found.
Introduction
Raup (Reference Raup1976a) documented Phanerozoic species diversity using data from the Zoological Record and showed that about 70% of the fossil species were described from Europe, North America, and the USSR (as it then was). In a companion paper, Raup (Reference Raup1976b) demonstrated a correlation, significant at the 1% level, between species diversity and estimated area of outcrop or rock volume throughout the Phanerozoic. Raup concluded that despite the raw numbers of species, there was no compelling evidence for an increase in biodiversity from the Cambrian to the Recent. Combined, Raup’s papers suggested that were the fossil record equally well known in all parts of the globe, a different pattern of evolution through the Phanerozoic might be revealed. This can be called the geographic bias hypothesis. Subsequent research has concentrated on further documentation of the correlation between outcrop area and biodiversity and methods to compensate for the correlation (Sepkoski, Reference Sepkoski1976; Allison and Briggs, Reference Allison and Briggs1993; Alroy et al., Reference Alroy, Marshall, Bambach, Bezusko and Foote2001; Smith, Reference Smith2001, Reference Smith2007; Crampton et al., Reference Crampton, Beu, Cooper, Jones, Marshall and Maxwell2003; Smith and McGowan, Reference Smith and McGowan2005, Reference Smith and McGowan2007; Tarver et al., Reference Tarver, Braddy and Benton2007; McGowan and Smith, Reference McGowan and Smith2008; Vilhena and Smith, Reference Vilhena and Smith2013; Na et al., Reference Na, Li, Krause, Zhu and Kiessling2023). Despite this effort, the geographic bias hypothesis remains more a theoretical concept than a reality. No one has demonstrated that bias exists, but the possibility that it does cannot be dismissed.
The hypothesis of potential geographical bias may be tested using real examples of recent discoveries as well as by theoretical modeling. From a Western perspective, knowledge of Chinese early fossil echinoderms has recently grown significantly and may be used to test the geographical bias hypothesis. The fundamental question is whether newly discovered Chinese early Paleozoic echinoderms are more of the same forms we already know or whether the Chinese fossil record contains previously unknown types of echinoderms. If the Chinese fossil record is predominantly more of the same, very little bias can exist between a fossil record with and one without any Chinese fossils. Alternatively, if the Chinese fossil record contains many types of fossils previously unknown to science, we will be forced to revise our views of the history of life on Earth significantly.
The preceding question can be investigated taxonomically, phylogenetically, and morphologically. A taxonomic approach uses the hierarchy of taxa to evaluate the degree of novelty. Clearly, provided they are correctly identified, species described previously from other parts of the world and subsequently discovered in Chinese rocks have no novelty value whatsoever. A genuinely new species that can be attributed to a previously known genus has less significance than one representing a new order or class of echinoderms. Although there is no generally accepted echinoderm tree of life, a new genus that fits into an accepted lineage is going to be less novel than one whose phylogenetic position is obscure or truly novel. First occurrences of higher-level taxa are more important in evolution than last occurrences. Extending the known range of a well-established lineage into younger rocks would have far less significance than discovering examples that were significantly older than those previously known. So documenting older first occurrences among Chinese early Paleozoic echinoderms is important.
Morphologically, a fundamentally new feature such as a fully developed holomeric stem in pelmatozoan echinoderms will be most significant, but new combinations of morphological features, such as the co-occurrence of spiral ambulacra, a distinct cup, and well-developed stem in Helicocystis Smith and Zamora, Reference Smith and Zamora2013, would also be seen as a significant morphological novelty.
Finally, the composition of the whole fauna may present novelties or confirm similarities. North American mid-Cambrian echinoderm faunas are dominated by gogiid blastozoans of the family Eocrinidae Jaekel, Reference Jaekel1918 (Sprinkle, Reference Sprinkle1973). So far, Chinese mid-Cambrian echinoderm faunas are dominated by similar forms (Sinoeocrinus Zhao et al., Reference Zhao, Huang and Gong1994; Guizhoueocrinus Zhao et al., Reference Zhao, Parsley and Peng2007; Globoeocrinus Zhao et al., Reference Zhao, Parsley and Peng2008; Wudingeocrinus Luo et al., Reference Luo, Fu, Hu, Li, Hou, Liu, Chen, Li, Pang and Liu2008; Kunmingeocrinus Y.L. Zhao et al., Reference Zhao, Guo, Selden, Cong and Li2022) although their taxonomic treatment has been different. North American eocrinids are still largely referred to the single genus Gogia Walcott, Reference Walcott1917, whereas Chinese eocrinid genera are mostly monotypic. Nevertheless, the morphological disparity of North American species within the genus Gogia is similar to if not greater than that of Chinese examples of the entire family Eocrinidae. Thus, morphological comparisons can be used as a check against different taxonomic practices. The dominance of eocrinids in the mid-Cambrian also suggests the Chinese and non-Chinese fossil records are similar.
Finally, we test the reliability of our preliminary results by using a discovery curve to assess the current state of knowledge of the Chinese echinoderm fossil record. Nevertheless, the principal aim of this paper is to outline approaches to testing for real geographic bias using actual examples. These tests can be applied repeatedly as our knowledge of the global fossil record improves. Equally, they can be applied to other taxonomic groups.
Geological setting
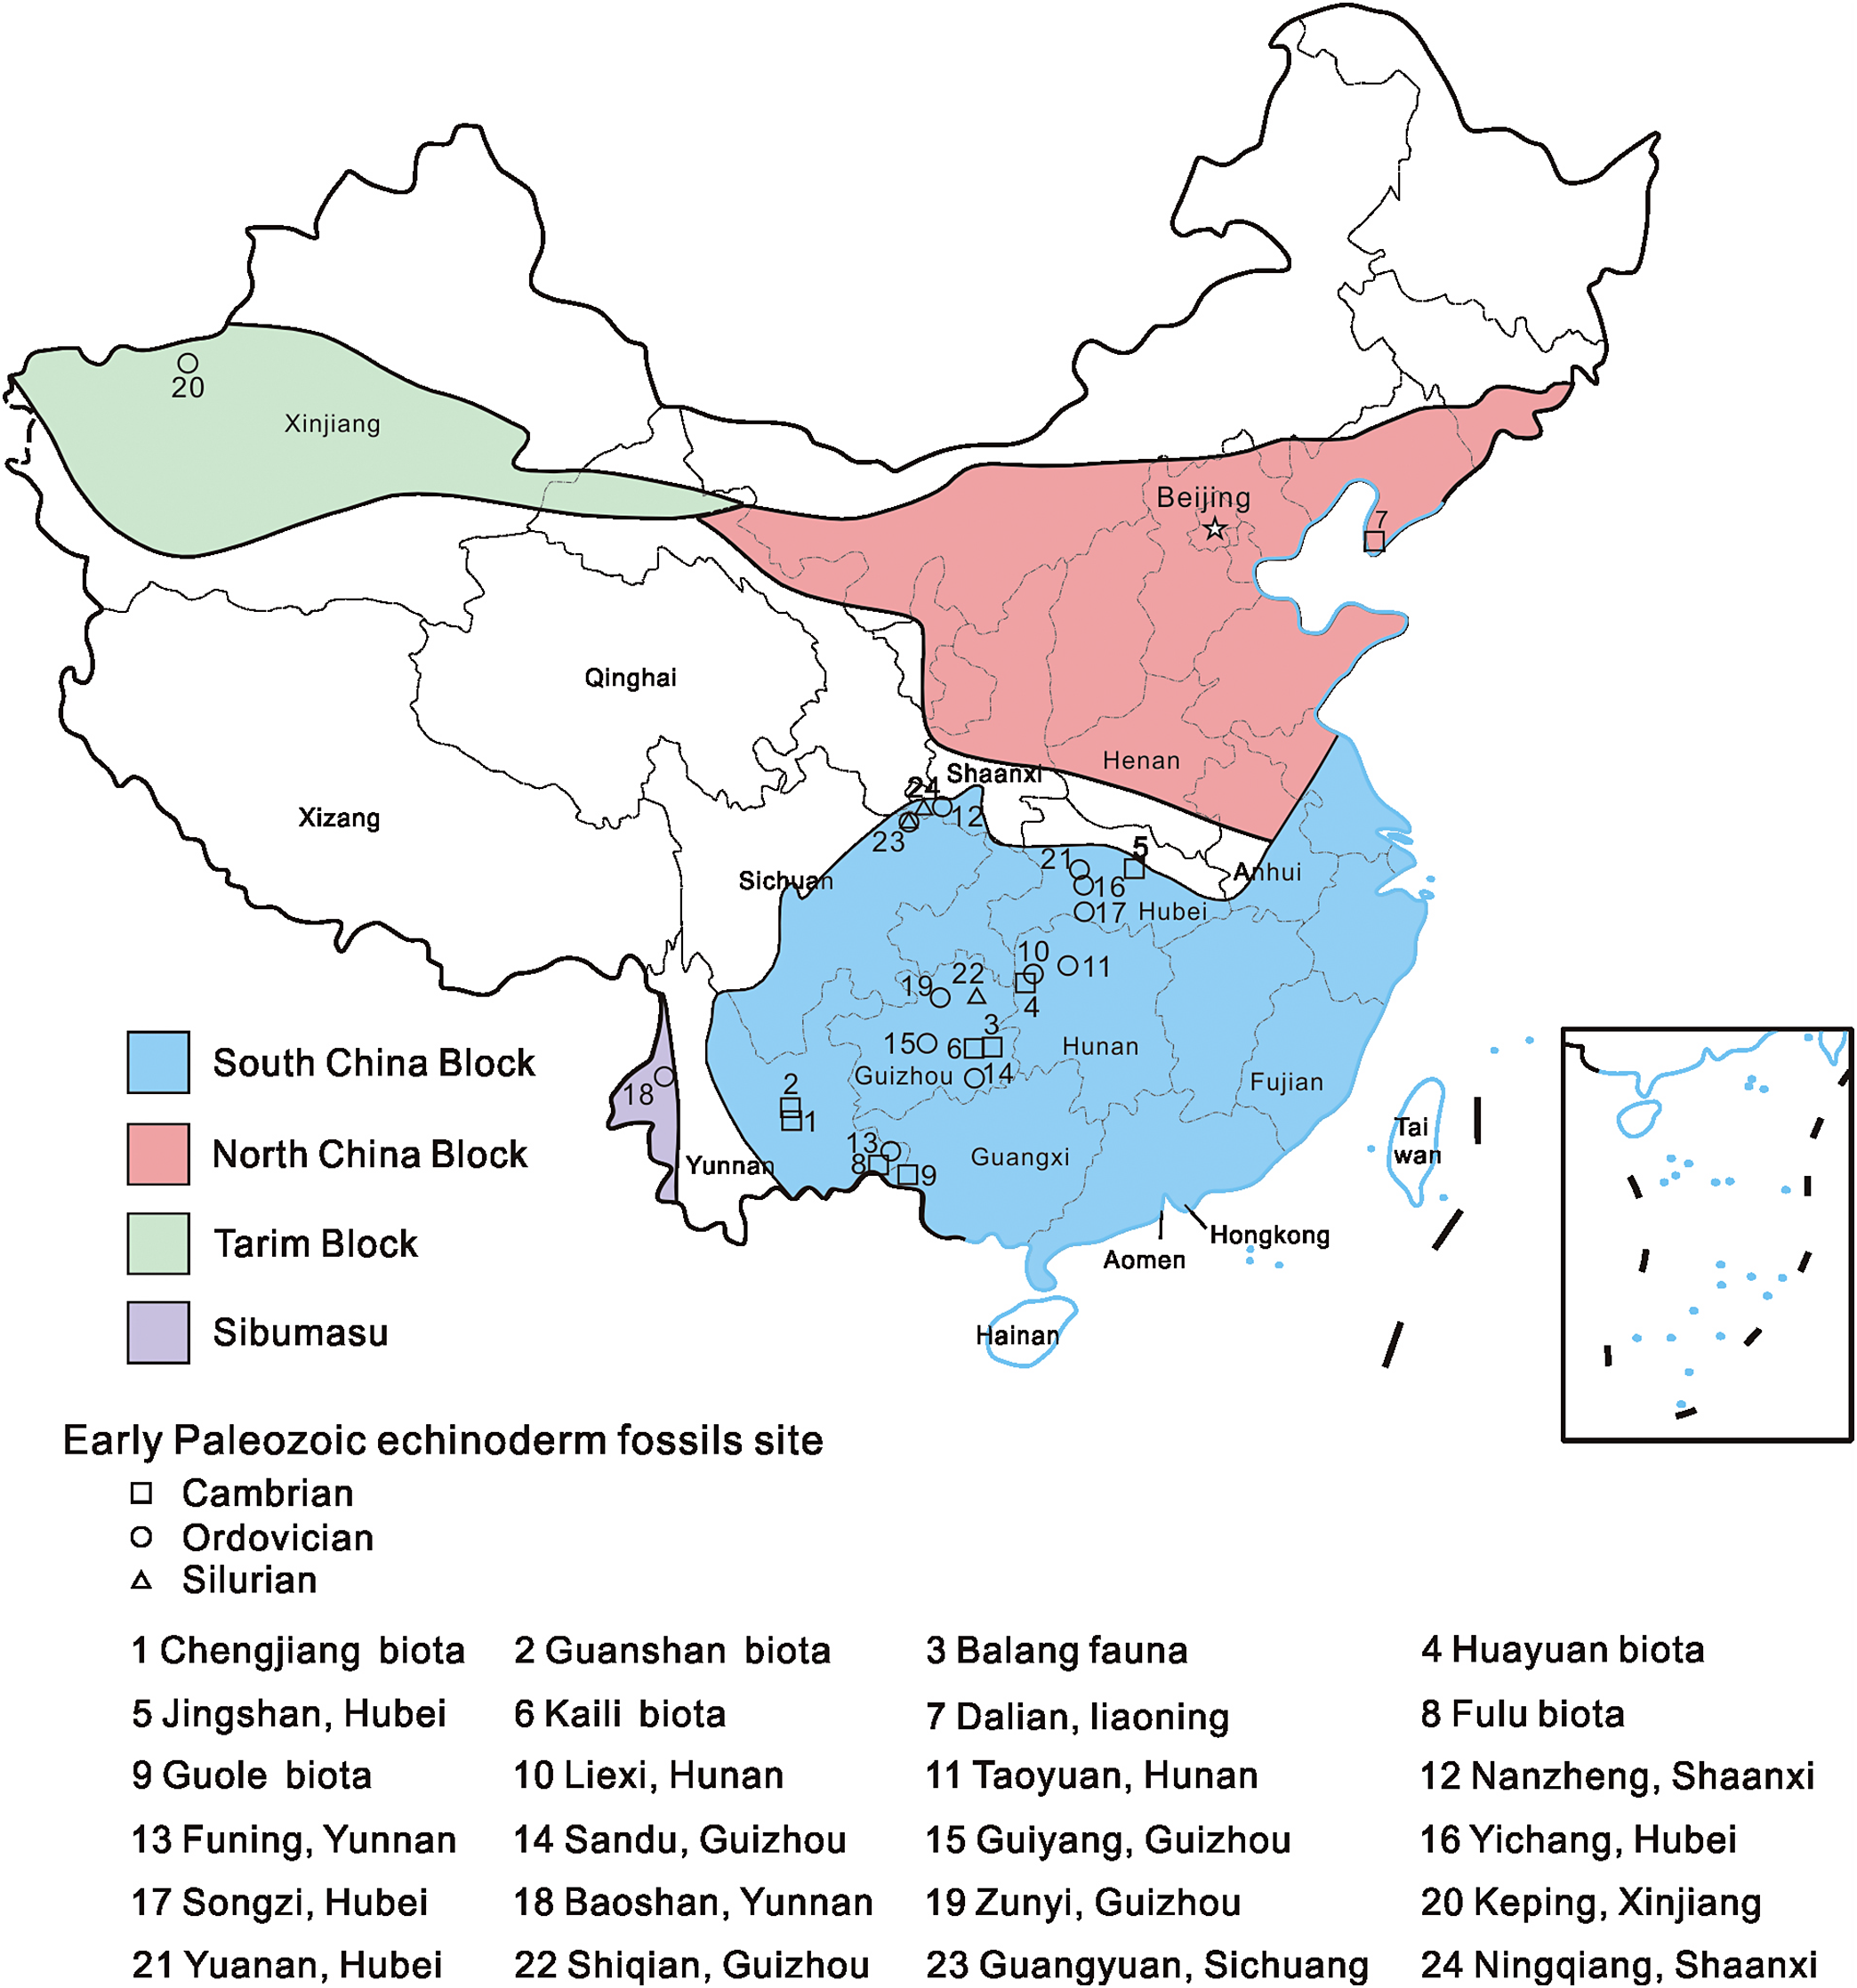
Sources of the Chinese early Paleozoic echinoderms are shown in Figure 1. The exceptionally well-preserved Cambrian echinoderms in China are reported mainly from eight significant faunas of the South China Block, and only a few eocrinoids occurred on the margin of the North China Platform. Five of the Cambrian Series 2 biotas are Burgess Shale-like faunas, including the famous Chengjiang and Guanshan biotas located in eastern Yunnan Province (Shu et al., Reference Shu, Conway Morris, Han, Zhang and Liu2004; Hu et al., Reference Hu, Luo, Hou and Erdtmann2007; Y.L. Zhao et al., Reference Zhao, Guo, Selden, Cong and Li2022), the Balang Fauna located in Guizhou Province (Zhao et al., Reference Zhao, Parsley and Peng2007), the Huayuan biota in Hunan Province (Zeng et al., Reference Zeng, Liu, Zhao, Luo and Wang2026), and the Jingshan fossil assemblage in central Hubei Province (Liu et al., Reference Liu, Hu, Zhang, Cuevas-Castell, Gong and Tao2010). Three of the later Cambrian biotas are also Burgess Shale-like, including the Kaili Biota from eastern Guizhou Province (Zhao et al., Reference Zhao, Sumrall, Parsley and Peng2010), the Fulu biota from the southeastern corner of Yunnan Province (Peng et al., Reference Peng, Yang, Liu, Zhu, Sun, Zamora, Mao and Zhang2020), and the Guole biota located in Guangxi Province (Zhu et al., Reference Zhu, Peng, Zamora, Lefebvre and Chen2016). The Ordovician and Silurian echinoderms in China are mainly from the South China Block, Sibumasu of southwest Yunnan province, and Tarim Block of northwest Xinjiang (Reed, Reference Reed1917; Sun, Reference Sun1936; Regional Geological Team of Xinjiang Geological Bureau et al., 1981; Chen and Yao, Reference Chen and Yao1993). The Ordovician echinoderms of the South China Block were reported from Guizhou, Hubei, and Hunan provinces (Sun, Reference Sun1936; Li, Reference Li1993; Liu et al., Reference Liu, Paul, Mao, Li, Fang and Huang2024), while the Silurian echinoderms of the South China Block were reported from Guizhou, Hubei, and Sichuan provinces (Xu, Reference Xu1962; Mu and Lin, Reference Mu and Lin1987; Mao et al., Reference Mao, Ausich, Li, Lin and Lin2017).
Map of modern China showing tectonic blocks and distribution of significant lower Paleozoic echinoderm fossil sites. Note the concentration in the South China Block.

Figure 1. Long description
A geological map of China identifies four tectonic blocks by color: Tarim Block in light green (Northwest), North China Block in pink (Northeast and Central), South China Block in light blue (Southeast), and Sibumasu in purple (Southwest border).
A legend for Early Paleozoic echinoderm fossil sites uses three symbols: squares for Cambrian, circles for Ordovician, and triangles for Silurian.
Distribution of sites:
* Tarim Block: Contains site 20 (Ordovician) in Xinjiang.
* North China Block: Contains site 7 (Cambrian) near Dalian, Liaoning.
* Sibumasu: Contains site 18 (Ordovician) in Yunnan.
* South China Block: Shows the highest concentration with 21 sites. Cambrian sites include 1 and 2 (Yunnan), 3, 4, and 10 (Hunan), 5 (Hubei), 6 (Guizhou), 8 and 9 (Guangxi). Ordovician sites include 11 (Hunan), 12 and 24 (Shaanxi), 13 (Yunnan), 14, 15, and 19 (Guizhou), 16 and 17 (Hubei), and 21 (Hubei). Silurian sites include 22 (Guizhou) and 23 (Sichuan).
Regional labels include Xinjiang, Xizang, Qinghai, Sichuan, Shaanxi, Henan, Beijing, Anhui, Hubei, Hunan, Fujian, Guizhou, Yunnan, Guangxi, Hainan, and Taiwan. An inset map at the bottom right shows the South China Sea region.
In general, the early Paleozoic echinoderms in China occur mainly in the South China Block, Sibumasu, and the North China Block. These occurrences and abundant fossils have greatly expanded the paleogeographic distributions of echinoderms.
Materials and methods
We use the fossil record of complete or nearly complete echinoderms from the early Paleozoic. Echinoderms possess complex skeletons that fall apart soon after death. Preservation of articulated echinoderms requires rapid burial soon after (or at) death (Donovan, Reference Donovan and Donovan1991, and references therein). Thus, the echinoderm fossil record is likely to be less well known than those of major taxa with simpler skeletons, such as gastropods. We concentrate on the early Paleozoic because Konservat Lagerstätten are more common, and known high-level taxonomic diversity of echinoderms reached a peak during that stratigraphic interval. Thus, the possibility of discovering additional novel high-level taxa in a relatively unexplored part of the globe might be increased.
Data gathering
We use records from bibliographic databases on the occurrence of early Paleozoic echinoderms to compare known biodiversity in North America and Europe with that of the rest of the world and China in particular. Records from Bassler and Moodey (Reference Bassler and Moodey1943) are used unfiltered to establish the extent of the geographic bias in knowledge of the fossil record by the mid-twentieth century. This establishes a baseline for comparisons with modern knowledge.
From a Western perspective, the past several decades have significantly increased our knowledge of Chinese early echinoderms, including occurrences in several Lagerstätten. Thus, we have a real example on which to test the geographic bias hypothesis. For specific tests, we use Webster’s (Reference Webster2014) index of crinoid crowns and parts of crowns and Webster and Webster’s (Reference Webster and Webster2019) supplement; the supplementary table of all Cambrian echinoderms in Rahman and Zamora (Reference Rahman and Zamora2024); the paleobiology and geobiology databases; and our own compilations of early Paleozoic pelmatozoans post Bassler and Moodey (Reference Bassler and Moodey1943). We have then sought out the original publications to evaluate taxonomic interpretations. Thus, the records we use are based on original publications in which illustrations enable us to assess the identity of the echinoderms. Rarely, we have also used unpublished sources in which the authors have seen photographs of the specimens or personal communications from a trusted source. We have used all these sources to compile a spreadsheet of Chinese early Paleozoic echinoderms that is as reliable as possible. The publications on which our spreadsheet is founded have then been used to assess the relative novelty of recently described and illustrated Chinese echinoderms. The results are presented in tables that distinguish any source without publicly available illustrations.
Our tests are based on the fundamental assumption that geographic bias can affect our interpretation of the history of life on Earth only if currently undiscovered fossils differ fundamentally from those we already know. We then analyze the spreadsheet for degree of novelty among recently discovered Chinese early Paleozoic echinoderms. Our spreadsheet involves single occurrences, but multiple occurrences of the same taxon test the hypothesis of geographic bias equally well. Thus, where we know a fossil has been recorded from different Chinese provinces, this fact has also been recorded.
Taxonomically, species previously described from elsewhere in the world and recently reported from China have no novelty value at all. A new Chinese species is assigned a low novelty value, whereas a new class is assigned the highest value. These categories could be assigned numerical values and an average novelty score calculated. We have not done so because our results do not seem to justify it yet. In addition, we feel this approach needs to be applied to other major taxa before an agreed scoring system could be developed. Nevertheless, we have chosen the family level as a significant boundary. Any new Chinese fossil that can be assigned to a known family is considered as “more of the same”; those assigned to a new family or higher-level taxon are regarded as novel. In a few cases, significantly novel fossil echinoderms have been illustrated but not yet formally described. Using phylogenetic and morphological assessment allows us to include these discoveries.
Phylogenetically, some new genera have been described but not assigned to any higher taxon, except sometimes a class. Nevertheless, if they clearly fit into an already recognized lineage, they merely add detail. These are the equivalent of low-level taxa and assigned a low novelty value. The alternative would be a new fossil that either did not fit into any recognized lineage or perhaps linked two major lineages at an early stage of their differentiation. This would be assigned a high novelty value. Evidence that Chinese specimens are the oldest known examples of families or higher taxa is also considered important.
Finally, any new morphological feature or new combination of morphological features would rate a high novelty value, whereas repetition of combinations of well-known morphological features would be assigned a low score. We need all these approaches because a significant number of echinoderms have been reported but not formally described taxonomically. Applying only a taxonomic test would risk underestimating true novelty.
Discovery curves
Despite these new discoveries, the question remains as to how well known the Chinese early Paleozoic echinoderm fauna is. Bibliographies allow us to build historic discovery curves based on the dates of publication of new taxa. As used here, taxonomic discovery curves avoid the problems of taxonomic refinement and different taxonomic practices (lumpers versus splitters) by selecting the most up-to-date or accurate systematic classification and examining when within each taxon at each taxonomic level the first known example was described. Such discovery curves are all based on the same taxonomy. They can investigate growth of knowledge of stratigraphic or geographic distributions as well as numbers of taxa. If a better taxonomy is adopted, the same process will reassess growth of knowledge under the new taxonomy. Potentially, this approach could be adopted for a phylogeny; however, we are unaware of any such example.
Thus, our discovery curves enable recognition of the rate of growth of knowledge of the echinoderm fossil record, which in turn can be used to assess the completeness of our knowledge of that record (Paul,Reference Paul1980, fig. 3, p. 301, Reference Paul, Joysey and Friday1982, fig. 2, p. 129, Reference Paul, Donovan and Paul1998, p. 16 et seq.). We use as our starting point Bassler and Moodey’s (Reference Bassler and Moodey1943) bibliography and index of Paleozoic pelmatozoans to establish the geographic bias in search effort (Table 1) as well as knowledge of Chinese early Paleozoic echinoderms by the mid twentieth century (Table 2). Then we have compiled separate files for current knowledge of Chinese Cambrian, Ordovician, and Silurian fossil echinoderms (Tables 3–5). These tables include the earliest date in which Chinese fossil echinoderms became known to science where this differs from the date of formal taxonomic description. From this, we construct a Chinese early Paleozoic echinoderm discovery curve. Finally, Webster’s bibliography of echinoderms (Webster, Reference Webster2014; Webster and Webster, Reference Webster and Webster2019) allows us to estimate the change in effort involved in compiling the known Chinese fossil record over time. Comparison of the Chinese discovery curve with the global effort curve for crinoids enables us to assess how well known the Chinese early Paleozoic echinoderm fauna is.
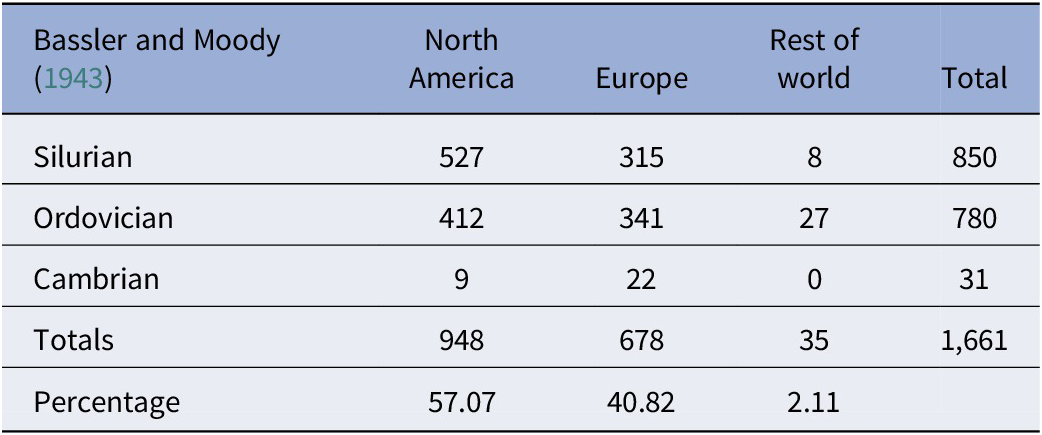
Number of entries for lower Paleozoic pelmatozoan echinoderms in Bassler and Moodey (Reference Bassler and Moodey1943)

Table 1. Long description
The table consists of five columns and five data rows.
Columns from left to right are: Bassler and Moody 1943 (Geological Period), North America, Europe, Rest of world, and Total.
Row 1: Silurian period. North America has 527 entries, Europe has 315, Rest of world has 8, with a Total of 850.
Row 2: Ordovician period. North America has 412 entries, Europe has 341, Rest of world has 27, with a Total of 780.
Row 3: Cambrian period. North America has 9 entries, Europe has 22, Rest of world has 0, with a Total of 31.
Row 4: Totals. North America has 948 entries, Europe has 678, Rest of world has 35, with a Grand Total of 1,661.
Row 5: Percentage. North America accounts for 57.07 percent, Europe for 40.82 percent, and Rest of world for 2.11 percent.
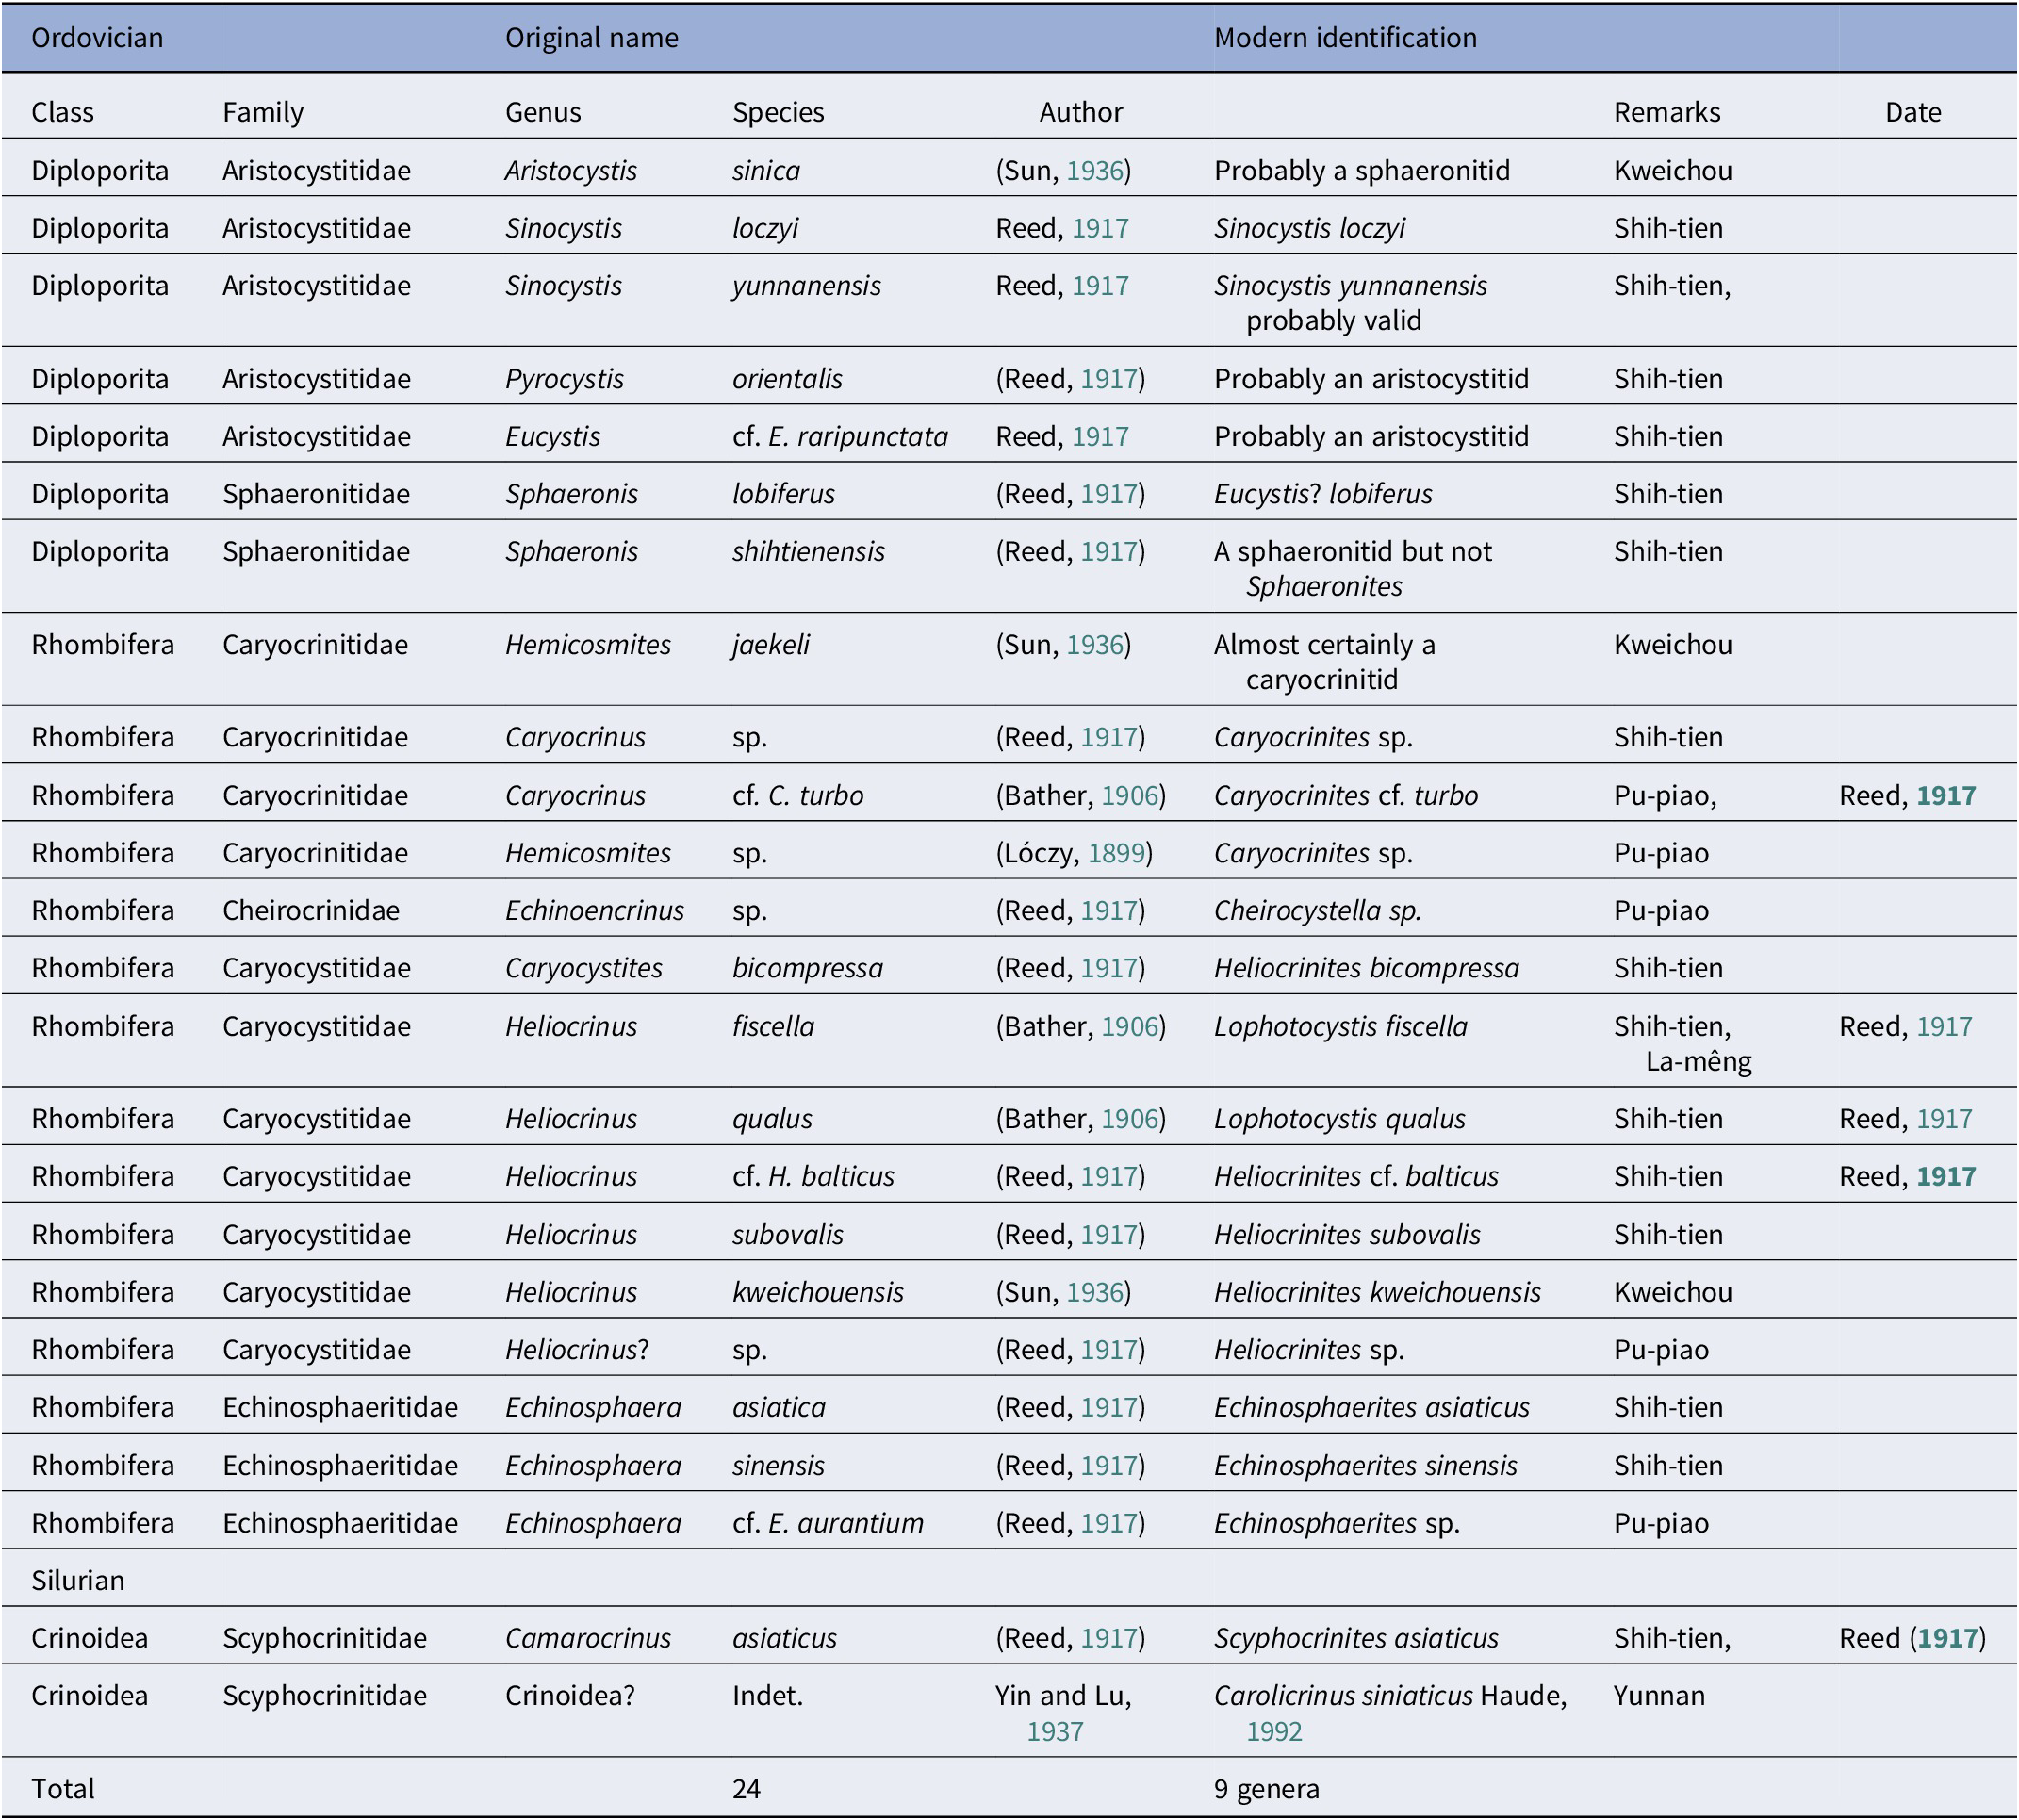
Lower Paleozoic echinoderms known from China by 1943

Table 2. Long description
The table is organized into eight columns: Class, Family, Genus, Species, Author, Modern identification, Remarks, and Date.
Under the Ordovician section:
- Diploporita Class includes families Aristocystitidae (genera Aristocystis, Sinocystis, Pyrocystis, Eucystis) and Sphaeronitidae (genus Sphaeronis). Notable species include Sinocystis loczyi and Sinocystis yunnanensis from Shih-tien.
- Rhombifera Class includes families Caryocrinitidae (genera Hemicosmites, Caryocrinus), Cheirocrinidae (genus Echinoencrinus), Caryocystitidae (genera Caryocystites, Heliocrinus), and Echinosphaeritidae (genus Echinosphaera). Locations mentioned include Kweichou, Shih-tien, Pu-piao, and La-mêng.
Under the Silurian section:
- Crinoidea Class includes family Scyphocrinitidae with the genus Camarocrinus (species asiaticus) and an indeterminate Crinoidea entry. Modern identification for Camarocrinus asiaticus is Scyphocrinites asiaticus.
The final row indicates a total of 24 species and 9 genera identified.
Note: Bold dates indicate no illustration of Chinese specimens exists. Last column refers to date first recorded from China.
Results
Table 1 records the geographic bias in search effort by the mid twentieth century using all records in Bassler and Moodey (Reference Bassler and Moodey1943). Only 2.11% of 1,661 records came from areas outside North America and Europe. These included 28 records from Asia, six from Australia, and one from South America. Table 2 includes all the Chinese early Paleozoic echinoderms recorded by Bassler and Moodey (Reference Bassler and Moodey1943). There are nine identifiable genera and 24 records, all but two of which are Ordovician, and all can be referred to previously known families. The two Silurian genera are crinoids. Up to five species were previously described by Bather (Reference Bather1906) from Myanmar, but only two of them were illustrated by Reed (Reference Reed1917), so the status of the unillustrated taxa cannot be assessed. A sixth, “Sphaeronites” shihtiensis Reed, Reference Reed1917, was later recorded from the Karakorums according to Bassler and Moodey (Reference Bassler and Moodey1943, p. 191) and from Thailand (Paul et al., Reference Paul, Boucot, Donovan, Zhan and Tansathien2019).
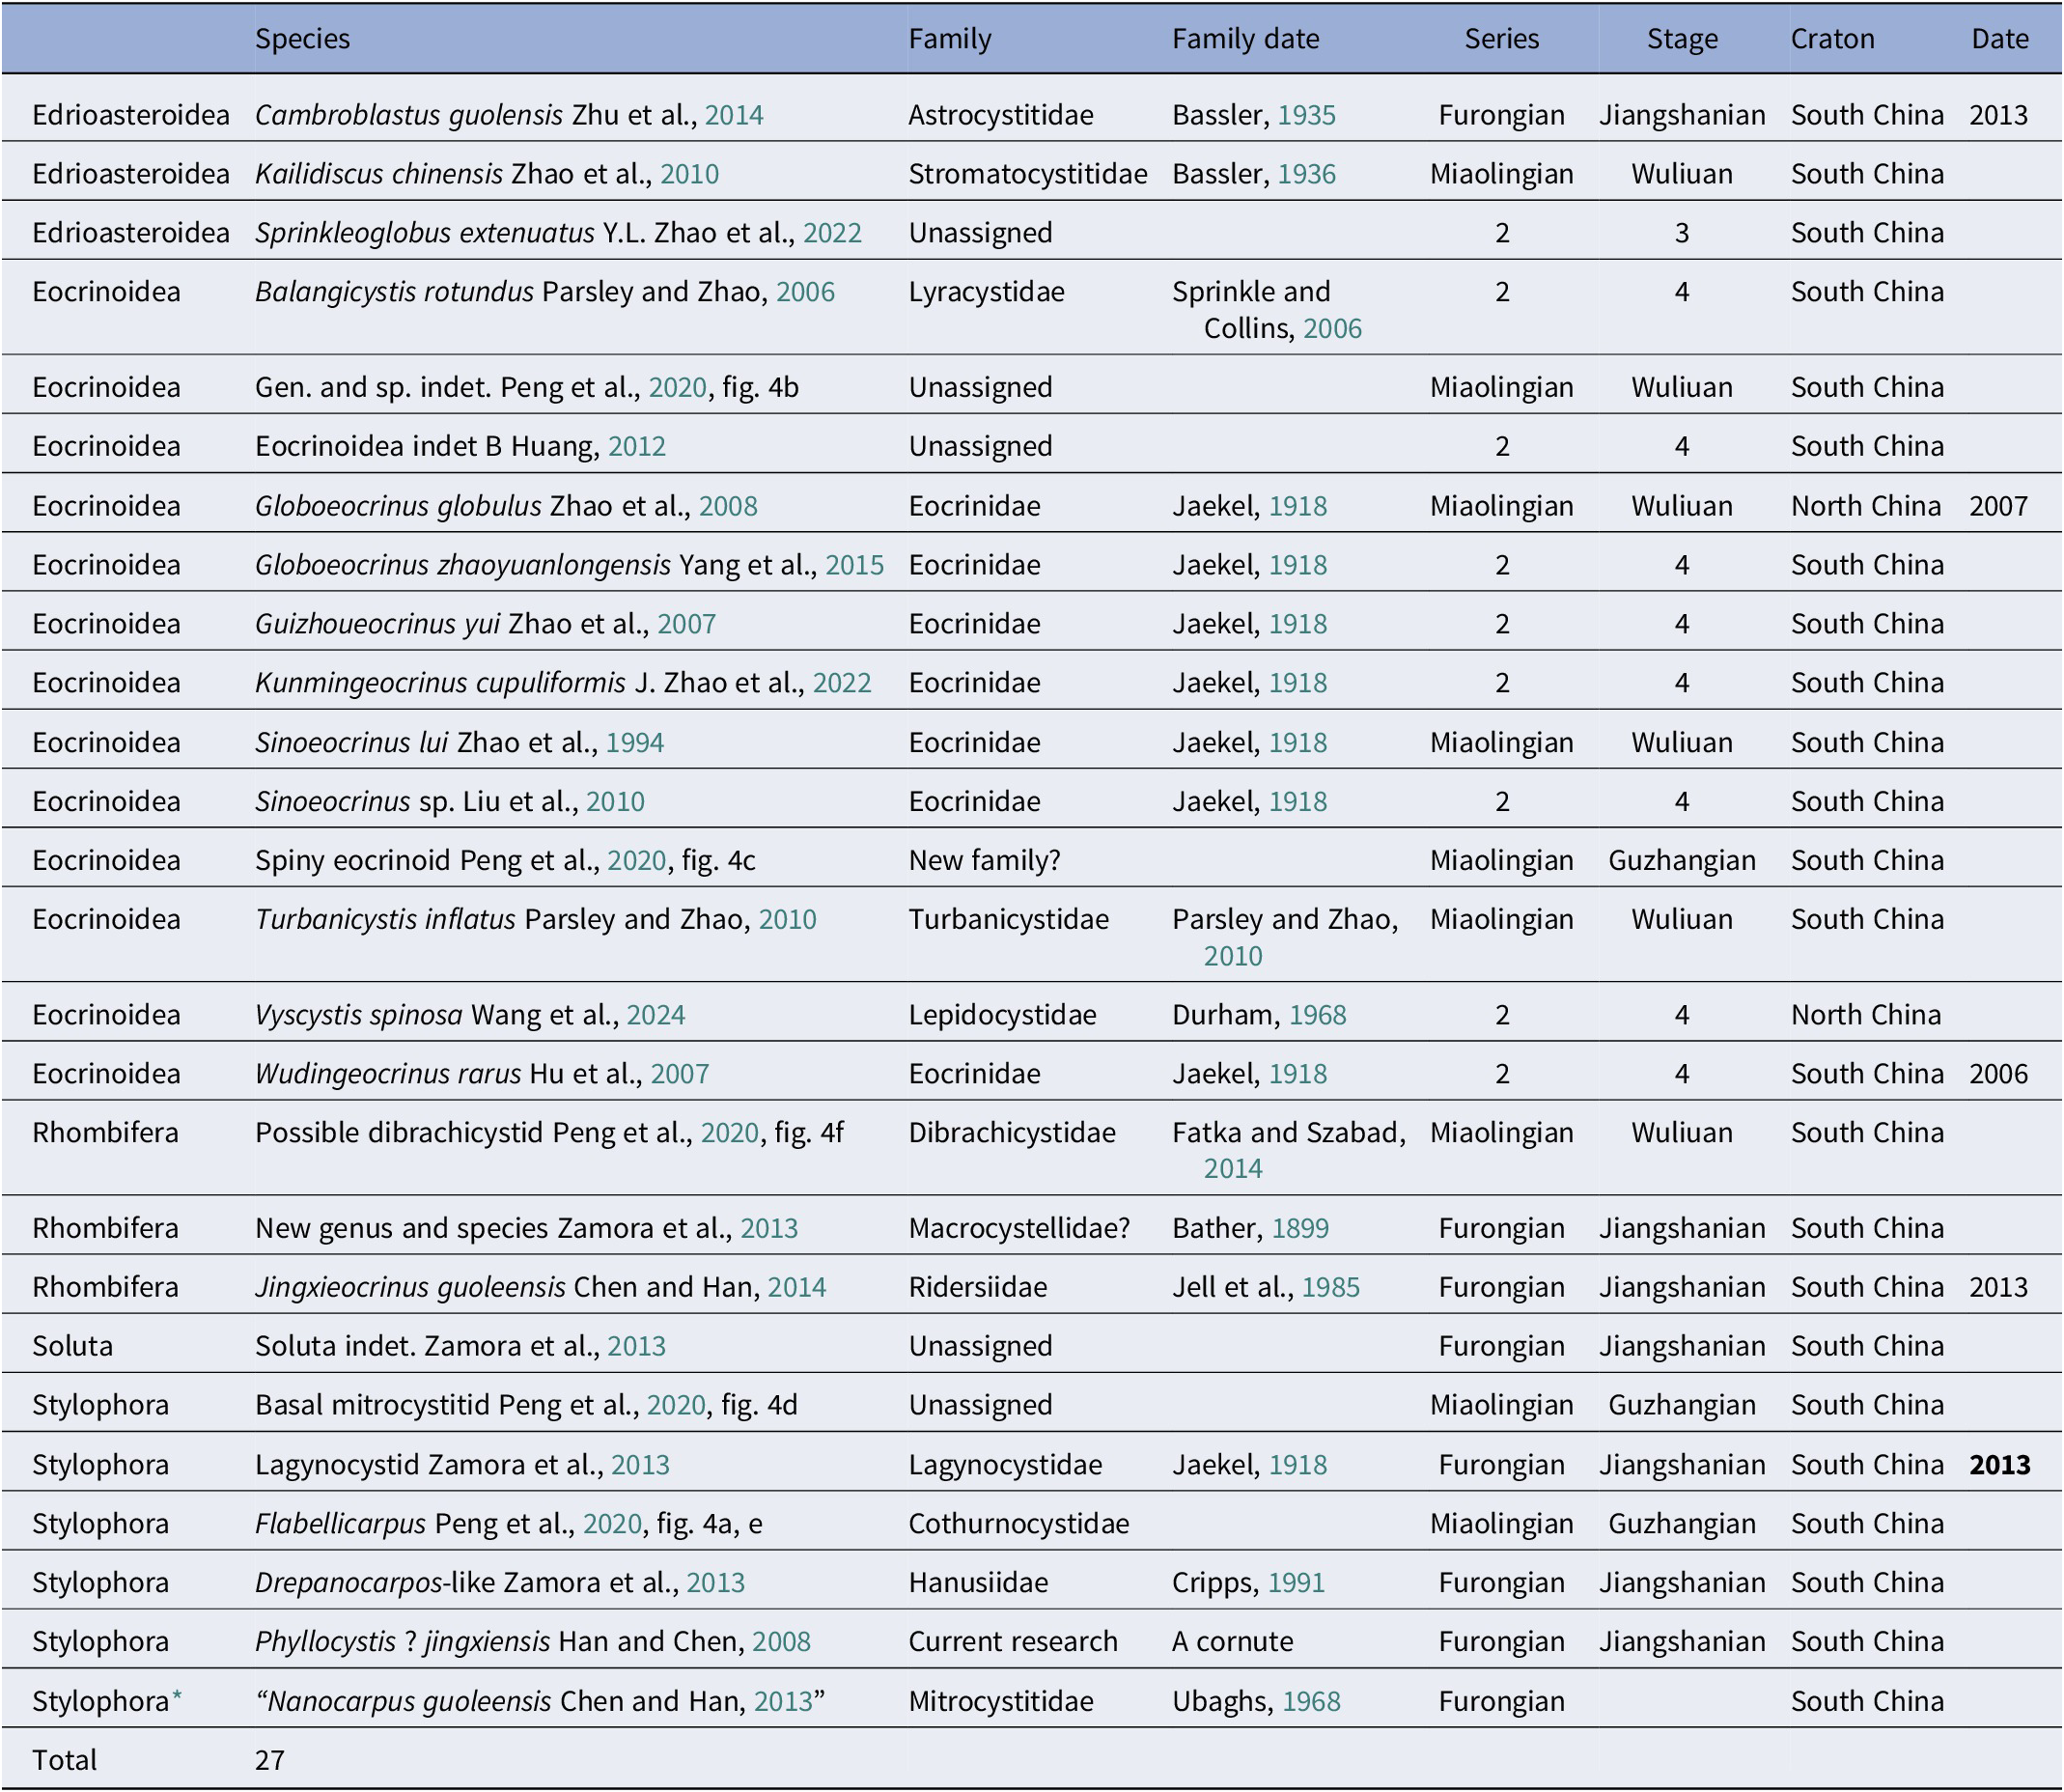
Tables 3–5 illustrate the current state (2026) of knowledge of Chinese early Paleozoic echinoderms. Taxonomically, the Chinese Cambrian (Table 3) includes 27 specific records, of which 13 are under open nomenclature or have been figured but not formally described. One species, Turbanicystis inflatus Parsley and Zhao, Reference Parsley and Zhao2010, was assigned to a newly created family, the Turbanicystidae Parsley and Zhao, Reference Parsley and Zhao2010, but it appears to us to be closely related to Gogia sensu lato. Seven taxa are unassigned to a family of which one, the eocrinoid with articulated spines on its thecal plates illustrated by Peng et al. (Reference Peng, Yang, Liu, Zhu, Sun, Zamora, Mao and Zhang2020, fig. 4c), could potentially be referred to a new family. No other eocrinoid that we know of has spines on thecal plates although Arthroacantha Williams, Reference Williams1883 is a Devonian crinoid with spines articulating on its cup plates. The Peng et al. (Reference Peng, Yang, Liu, Zhu, Sun, Zamora, Mao and Zhang2020) specimen, although unnamed, is clearly a significantly novel Chinese Cambrian echinoderm. In addition, the new genus and species illustrated by Zamora et al. (Reference Zamora, Zhu and Lefebvre2013, fig. 2B), here tentatively assigned to the Macrocystellidae, is a member of the lineage leading to dichoporite rhombiferans and closely related to Jingxieocrinus. All Chinese Cambrian echinoderms are endemic to China unless Kailidiscus is a junior synonym of Walcottidiscus Bassler, Reference Bassler1935.
Cambrian echinoderms known from China

Table 3. Long description
The table contains eight columns: Taxonomic Group, Species, Family, Family Date, Series, Stage, Craton, and Date.
Key entries include:
* Edrioasteroidea: Includes Cambroblastus guolensis (Furongian Series, Jangshanian Stage) and Kailidiscus chinensis (Miaolingian Series, Wuliuan Stage).
* Eocrinoidea: The largest group listed, including Balangicystis rotundus, Globoeocrinus globulus (found in North China), and Sinoeocrinus lui. Many are from Series 2, Stage 4 in South China.
* Rhombifera: Includes Jingxieocrinus guoleensis from the Furongian Series.
* Soluta: One indeterminate entry from the Furongian Series.
* Stylophora: Includes Flabellicarpus and Nanocarpus guoleensis (a basal mitrocystitid).
Geographical distribution is predominantly in South China, with only Globoeocrinus globulus and Vyscystis spinosa noted from North China. The Series range from Series 2 to Furongian, and Stages include Wuliuan, Guzhangian, and Jiangshanian. The total count of species listed is 27.
Note: Bold date indicates not illustrated. Date column indicates first record from China if earlier than formal description.
* This taxon is a basal mitrocystitid (Lefebvre and Ausich, Reference Lefebvre and Ausich2021, p. 939–940).
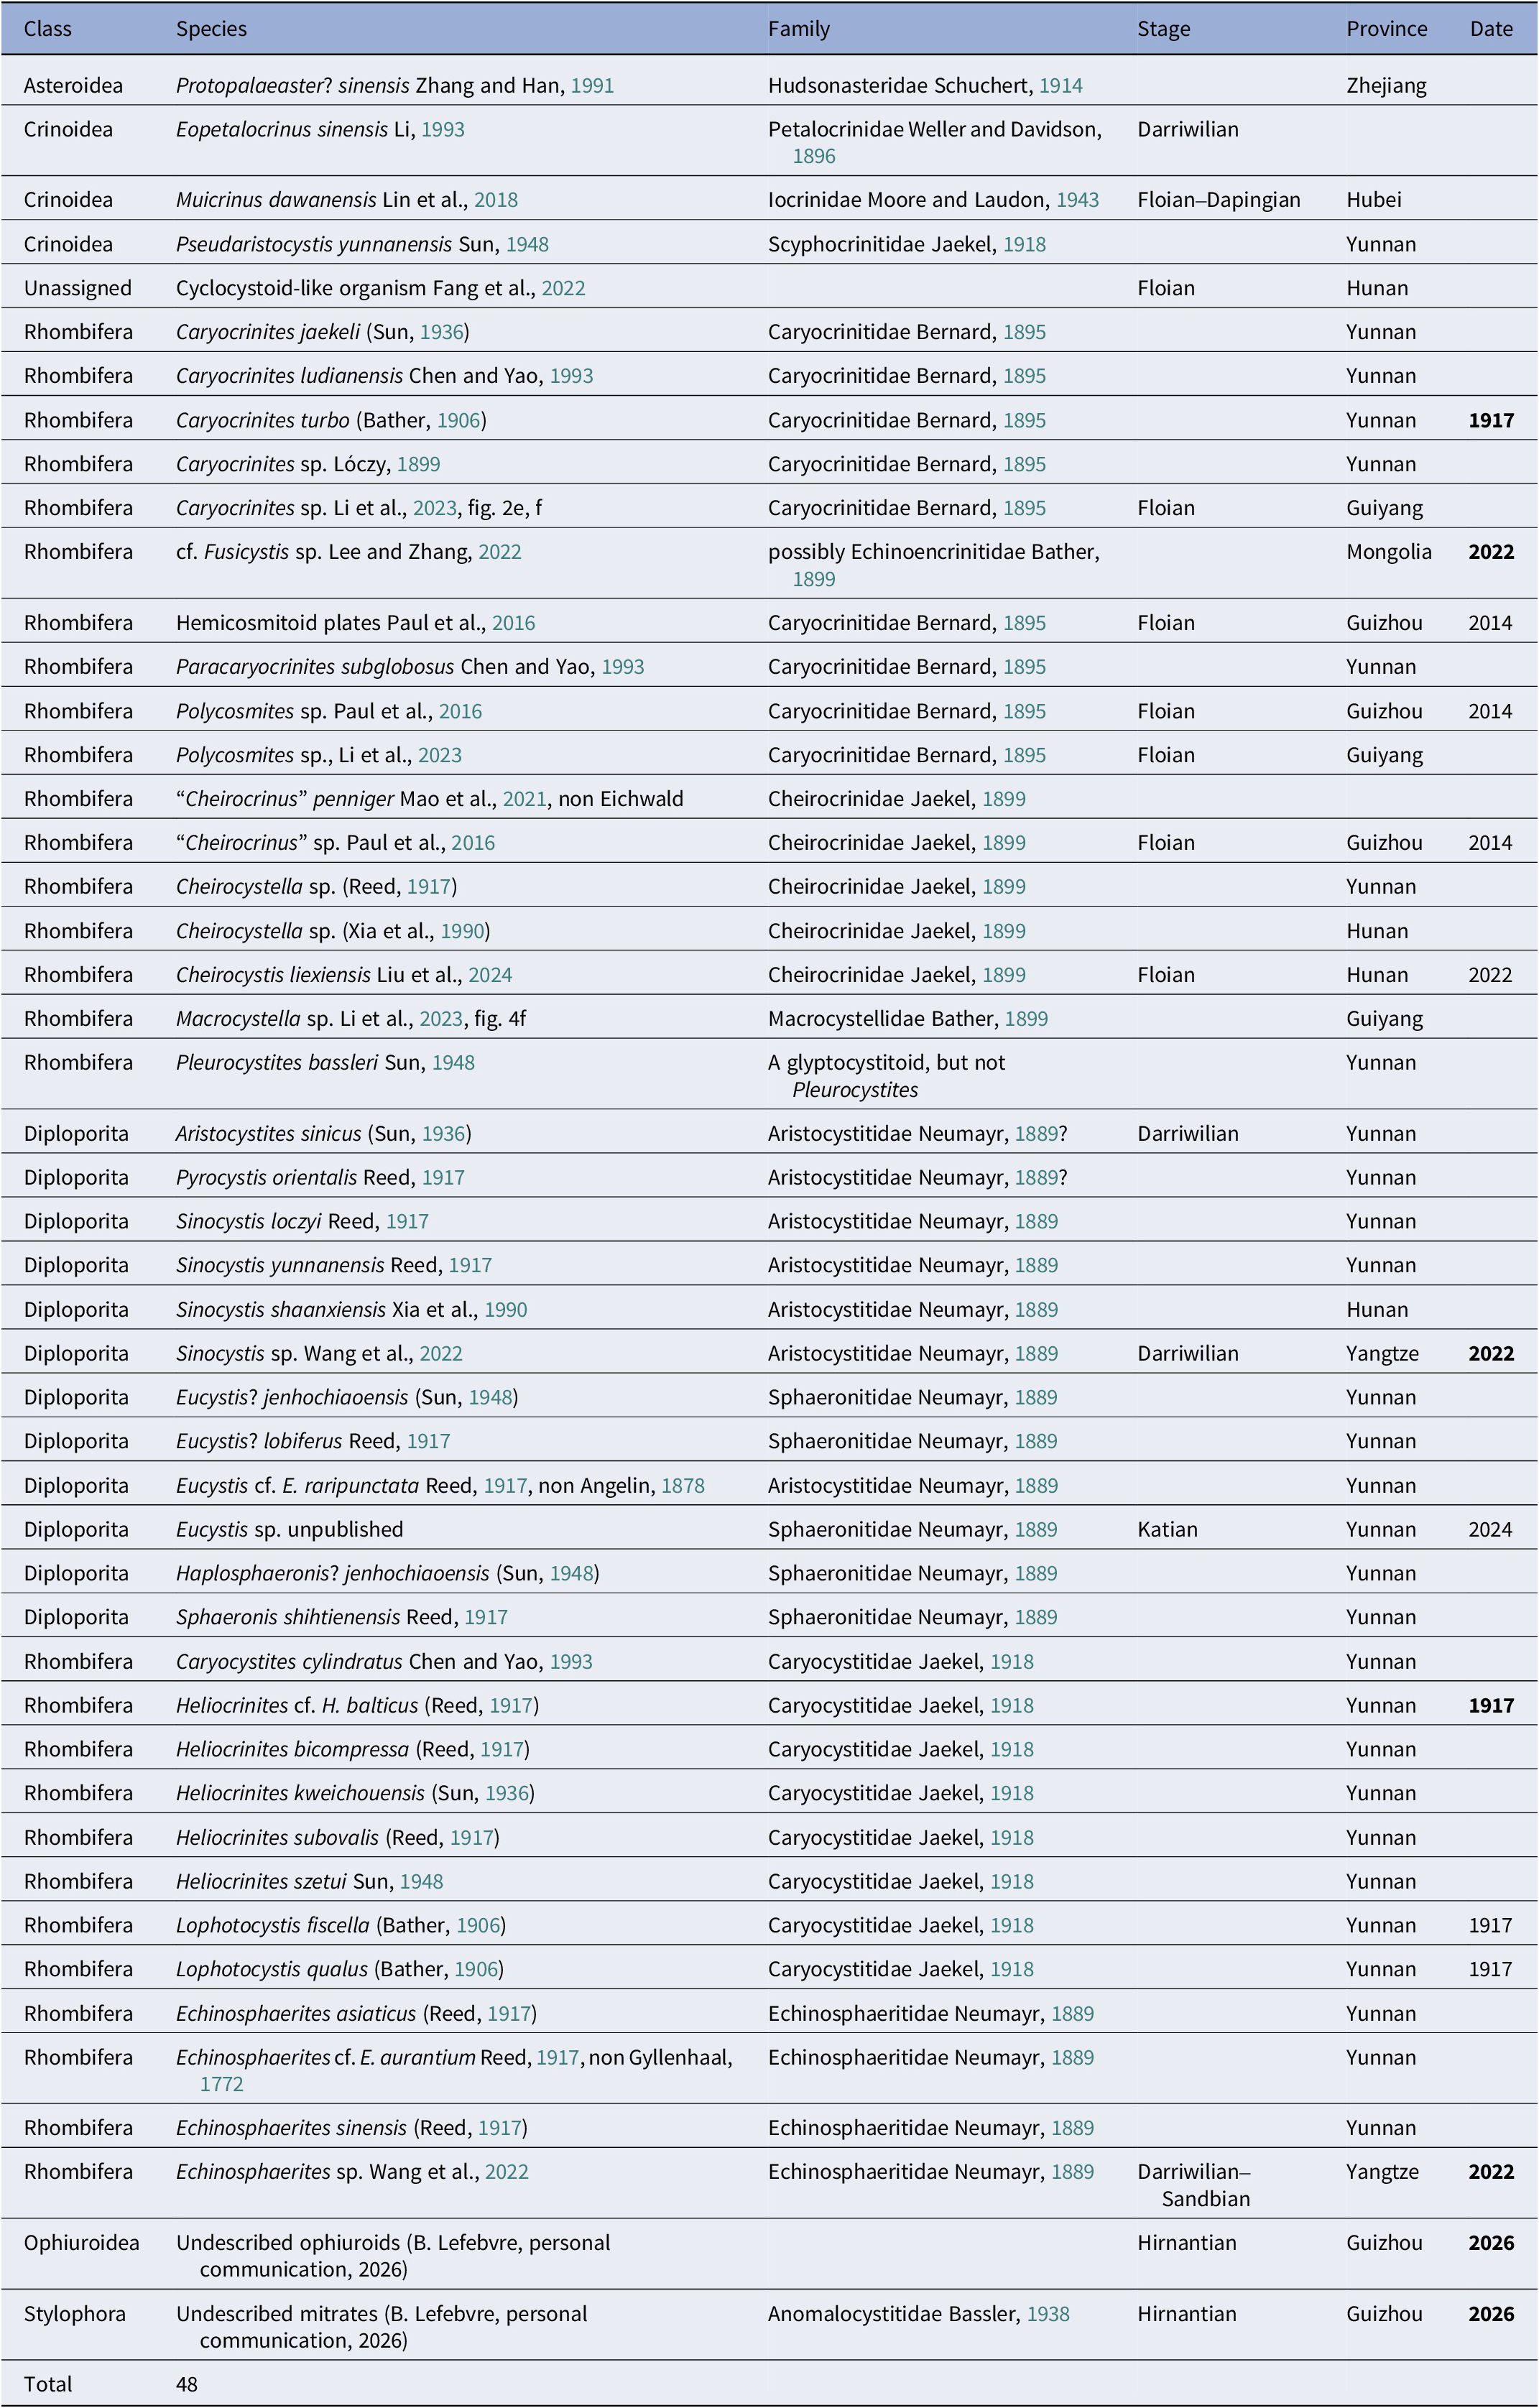
The Chinese Ordovician (Table 4) includes 48 taxa in total, including those in Bassler and Moodey (Reference Bassler and Moodey1943). All but one, Cyclocystoid-like organism Fang et al., Reference Fang, Mao, Liu, Yuan and Chen2022, can be assigned to known families. The exception differs too much from true cyclocystoids (Kolata et al., Reference Kolata, Frank, Haplan and Guensburg2023, Reference Kolata, Mooi, Guensburg and Koniecki2025) to be included within that class. Three species were described previously from Myanmar by Bather (Reference Bather1906). Otherwise, these Chinese taxa appear to be endemic.
Ordovician echinoderms known from China

Table 4. Long description
A table with six columns: Class, Species, Family, Stage, Province, and Date.
* Asteroidea: Protopalaeaster? sinensis (Hudsonasteridae) from Zhejiang.
* Crinoidea: Eopetalocrinus sinensis (Petalocrinidae) from Darriwilian stage; Muicrinus dawanensis (Iocrinidae) from Floian-Dapingian, Hubei; Pseudaristocystis yunnanensis (Scyphocrinitidae) from Yunnan.
* Unassigned: Cyclocystoid-like organism from Floian, Hunan.
* Rhombifera (Dichoporite): Includes multiple Caryocrinites species (C. jaekeli, C. ludianensis, C. turbo, C. sp.) primarily from Yunnan and Guizhou; cf. Fusicystis sp. from Mongolia; Hemicosmitoid plates and Polycosmites sp. from Floian, Guizhou and Guiyang; Cheirocrinus and Cheirocystella species from Guizhou, Yunnan, and Hunan; Macrocystella sp. from Guiyang; and Pleurocystites bassleri from Yunnan.
* Diploporita: Includes Aristocystites sinicus, Pyrocystis orientalis, and multiple Sinocystis species (S. loczyi, S. yunnanensis, S. shaanxiensis, S. sp.) from Yunnan, Hunan, and Yangtze; Eucystis species from Yunnan; and Sphaeronis shihtienensis from Yunnan.
* Rhombifera (Fistuliporite): Includes Caryocystites cylindratus, multiple Heliocrinites species (H. cf. balticus, H. bicompressa, H. kweichouensis, H. subovalis, H. szetui), Lophotocystis species, and Echinosphaerites species (E. asiaticus, E. cf. aurantium, E. sinensis, E. sp.) mostly from Yunnan and Yangtze.
* Ophiuroidea: Undescribed ophiuroids from Hirnantian, Guizhou.
* Stylophora: Undescribed mitrates (Anomalocystitidae) from Hirnantian, Guizhou.
The total count of species listed is 48.
Note: Bold date indicates no Chinese specimens were illustrated. “Cheirocrinus” is in quotes because the specimens can be attributed only to the family Cheirocrinidae, not the genus Cheirocrinus. Rhombifera listed before and after Diploporita represent dichoporite and fistuliporite Rhombifera, respectively.
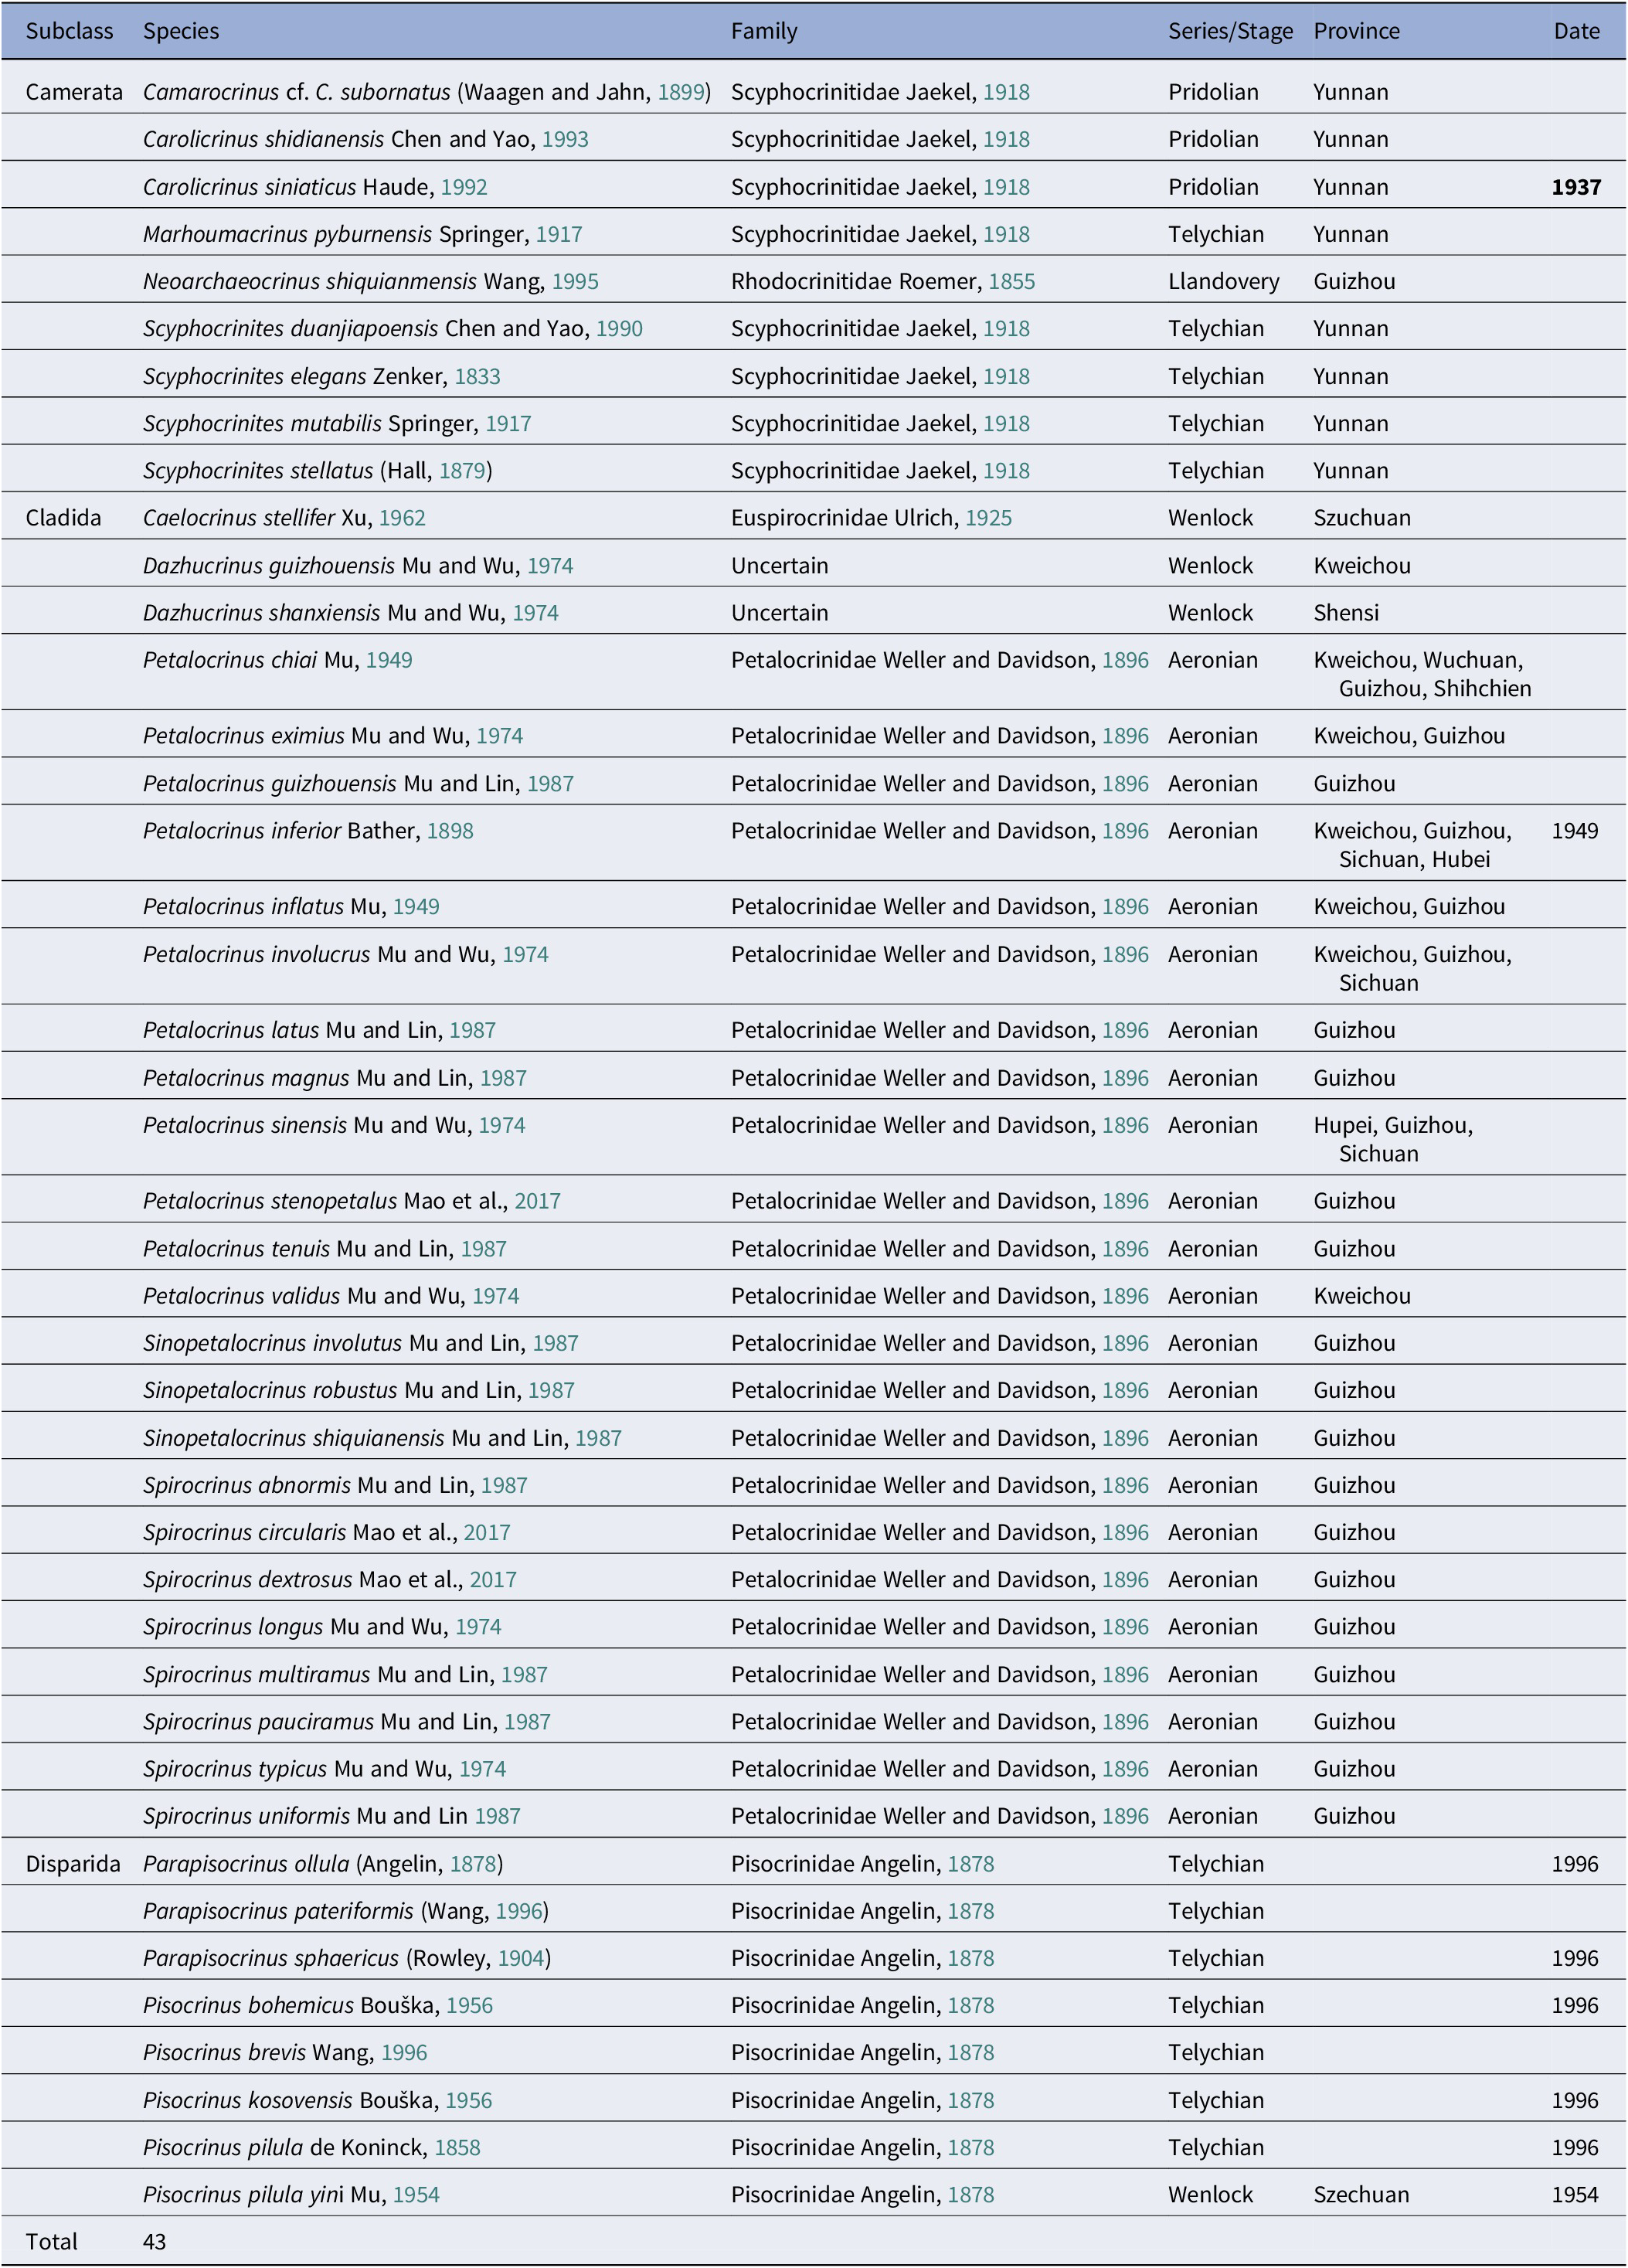
Finally, the Chinese Silurian (Table 5) includes 43 named species of crinoids, 12 of which were previously reported from elsewhere in the world. The scyphocrinitids were particularly cosmopolitan (Webster, Reference Webster2014; Webster and Webster, Reference Webster and Webster2019). All crinoid species are named, but two are of uncertain family. Several species have been reported from more than one Chinese province, which increases by 11 the total number of records from China.
Silurian echinoderms known from China

Table 5. Long description
The table is titled Silurian echinoderms known from China and contains six columns: Subclass, Species, Family, Series/Stage, Province, and Date.
* Subclass Camerata includes nine entries. Most belong to the family Scyphocrinitidae Jaekel, 1918, found in the Pridolian or Telychian stages of Yunnan. Species include Camarocrinus cf. C. subornatus, Carolicrinus shidianensis, Carolicrinus siniaticus (dated 1937), Marhoumacrinus pyburnensis, and several Scyphocrinites species (duanjiapoensis, elegans, mutabilis, stellatus). One species, Neoarchaeocrinus shiquianmensis, belongs to Rhodocrinitidae from the Llandovery of Guizhou.
* Subclass Cladida includes 26 entries. Caelocrinus stellifer (Euspirocrinidae) and two Dazhucrinus species (uncertain family) are from the Wenlock stage. The majority are from the family Petalocrinidae Weller and Davidson, 1896, found in the Aeronian stage of Guizhou, Kweichou, Sichuan, or Hupei. This group includes 12 Petalocrinus species (chiai, eximius, guizhouensis, inferior, inflatus, involucrus, latus, magnus, sinensis, stenopetalus, tenuis, validus), three Sinopetalocrinus species (involutus, robustus, shiquianensis), and eight Spirocrinus species (abnormis, circularis, dextrosus, longus, multiramus, pauciramus, typicus, uniformis).
* Subclass Disparida includes seven entries, all from the family Pisocrinidae Angelin, 1878. Six are from the Telychian stage, including Parapisocrinus (ollula, pateriformis, sphaericus) and Pisocrinus (bohemicus, brevis, kosovensis, pilula). Pisocrinus pilula yini is from the Wenlock of Szechuan, dated 1954.
The total number of species listed is 43. A note indicates all are crinoids and the bold date for Carolicrinus siniaticus (1937) signifies no illustration of Chinese examples.
Note: They are all crinoids. Bold date = no illustration of Chinese examples.
In summary, the Chinese early Paleozoic echinoderm fauna includes a total of 118 specific taxa, of which 105 (88.98%) can be referred with reasonable confidence to known families. Fifteen (12.71%) are species first described from elsewhere in the world. The currently known fauna is predominantly more of the same. Alternatively, only three taxa, Turbanicystis inflatus, an unnamed spiny eocrinoid, and the cyclocystoid-like organisms from the Liexi fauna, are potentially significantly new in the sense that they have been or could be assigned to new families unknown outside China. Even so, Gogia guntheri Sprinkle, Reference Sprinkle1973, from North America is very similar to Turbanicystis inflatus from China, and the spiny eocrinoid seems closely related to Eocrinidae. Only the cyclocystoid-like echinoderm (Fang et al., Reference Fang, Mao, Liu, Yuan and Chen2022, fig. 2f) appears to be a truly novel early Paleozoic echinoderm from China. The specimens differ too much from true cyclocystoids (Kolata et al., Reference Kolata, Frank, Haplan and Guensburg2023, Reference Kolata, Mooi, Guensburg and Koniecki2025) to be included within that class. The single photograph does not show enough detail to be sure what it is, but the preservation of apparently soft-tissue peripheral tentacles, but total lack of central plating, is difficult to interpret as a cyclocystoid. We suggest it might be a somasteroid, but it needs thorough description.
Finally, two crinoids, Eopetalocrinus sinensis and Muicrinus dawanensis, appear to be the only known Ordovician examples of their respective families, the Petalocrinidae and Iocrinidae. In addition, Chinese Petalocrinidae seem to be more diverse both taxonomically and morphologically than those known from elsewhere in the world.
Discussion
Significance of our results
At first sight, our results overwhelmingly suggest that the known Chinese early Paleozoic echinoderm fauna differs little from that already known from elsewhere in the world and therefore there is little evidence of geographic bias. This view is reinforced by the fact that six Silurian species have been reported from more than one province (Table 5). Treated as separate occurrences, these would add another 11 records to our database. In addition, the Geobiodiversity Database (https://geobiodiversity.com) records the genus Petalocrinus from six Chinese provinces and Pisocrinus from four. Furthermore, we have not identified even one significantly novel taxon at class level, such as the helicoplacoids or ctenocystoids. Nevertheless, our results should be regarded as preliminary for at least three reasons. First, they depend on how well known Chinese echinoderms are. Second, recently discovered new echinoderm classes are rare and not very diverse (see below); if randomly discovered they are likely to be the last taxa discovered. Finally, application of the test to other fossil groups might produce different results. We next consider how well known the Chinese echinoderm fossil record is.
Discovery curves
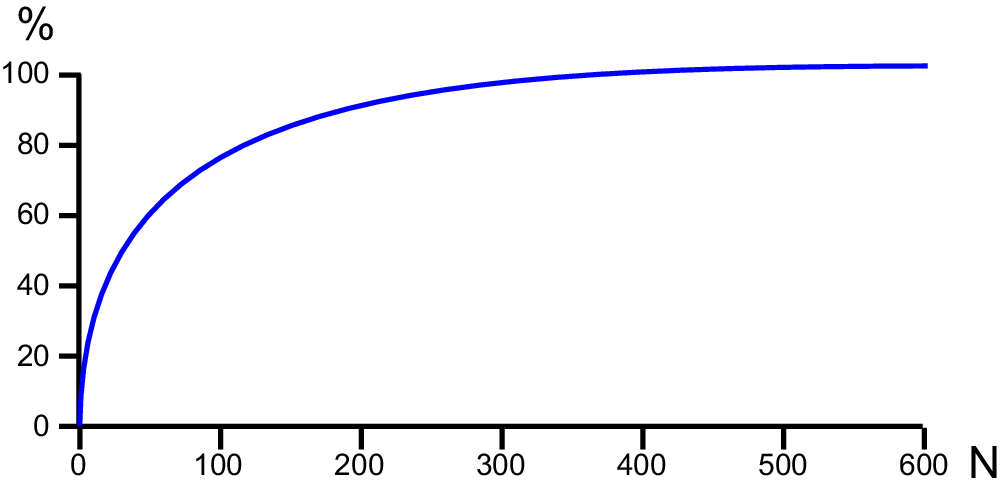
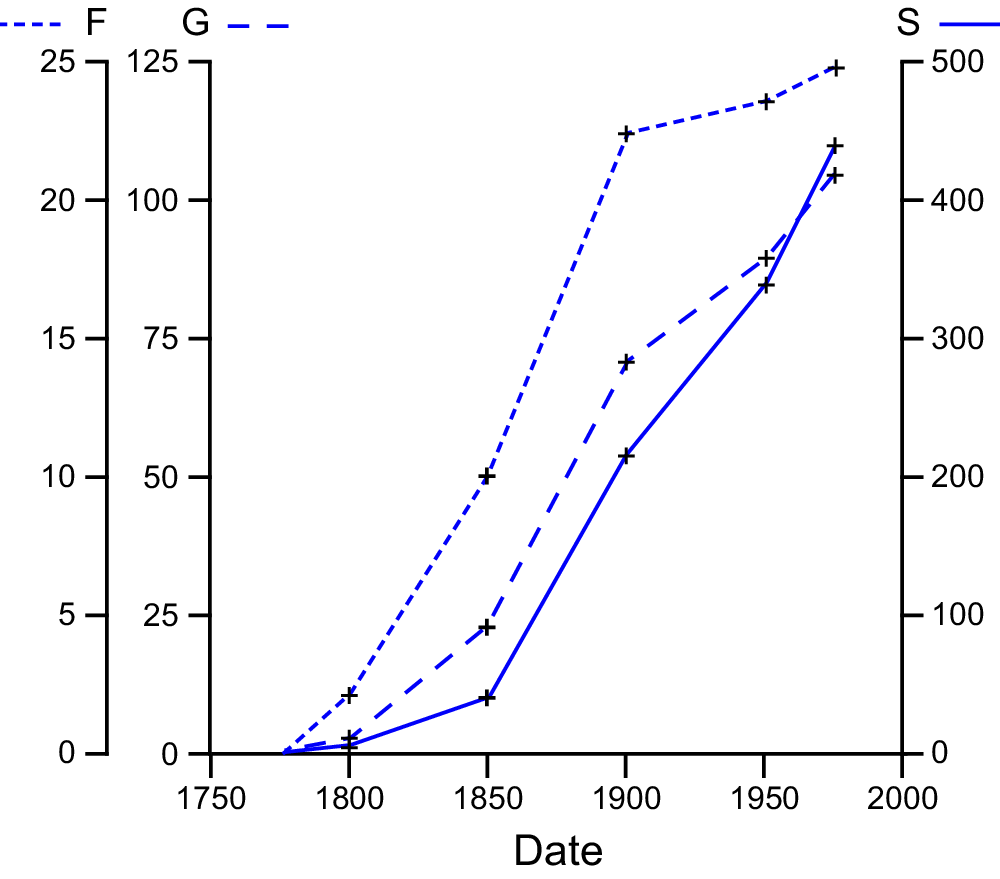
Chinese fossil echinoderms are just as much subject to “the law of diminishing returns” as are fossils from anywhere else. Experience shows that when searching for fossils, the common ones are soon discovered, but it takes increasing effort to add new species to the list of fossils found. If significantly new types of fossils were rare, only after thorough searches could we become confident that they were truly absent because the common fossils would be found first. Equally, the common Chinese fossils are more likely to have been common elsewhere and therefore already known. As used here, discovery curves (Fig. 2) provide a means of assessing how complete our knowledge of the local fossil record is (Paul, Reference Paul, Joysey and Friday1982, p. 102). In this context, discovery curves plot increasing taxonomic knowledge against search effort. Common examples are plots of number of species against number of specimens, or against area searched, or against time spent searching, all collectively called “effort.” So, if one plots the rate of discovery of taxa at various taxonomic levels, one can compare the shape of the resulting curve with a standard discovery curve (Fig. 2). The early part of the curve rises steeply and implies there is a lot more still to be discovered; the last part of the curve is nearly horizontal and implies that most of the fossil biota has been found. Paul (Reference Paul1980, fig. 67, p. 207, Reference Paul, Joysey and Friday1982, fig. 13, p. 103) compared global discovery curves for species, genera, and families of cystoids (Diploporita and Rhombifera) from 1772 to 1975. This showed that whereas both genuinely new species and genera were still being discovered at a rapid rate, the curve for families had flattened significantly since 1900 (Fig. 3). In 2026, the number of families is still 25, but genera have increased from 110 to 132. Raup (Reference Raup1972, p. 1067) discussed the theoretical basis for this relationship between lower- and higher-level taxa.
Generalized discovery curve. N = number of specimens; % = percentage of total biota known. In this case, even at 100 specimens, > 20% of the biota would be unknown but there would be no point in collecting beyond 600 as all the species would have been found. Redrawn from Paul (Reference Paul, Joysey and Friday1982, fig. 2).

In this context, counting the number of families, genera, or species is not adequate. Some may be synonyms, others homonyms, and in the case of families and genera, many will result from refined taxonomy. For example, the first two blastozoans known to science were described under the generic name Echinus by Gyllenhaal (Reference Gyllenhaal1772). Subsequently, one was recognized as the fistuliporite rhombiferan genus Echinosphaerites Wahlenberg, Reference Wahlenberg1818 and the other as the diploporite Sphaeronites Hisinger, Reference Hisinger1828. Each is now recognized as the type genus of its respective family, the Echinosphaeritidae Neumayr, Reference Neumayr1889 and Sphaeronitidae Neumayr, Reference Neumayr1889. The difficulties that changes in taxonomy introduce can be overcome by assigning all taxa to the best modern classification and then finding when the first species within any higher taxon was described. So, the first known fistuliporite and echinosphaeritid was Echinosphaerites aurantium (Gyllenhaal, Reference Gyllenhaal1772). The subclass Fistuliporita, family Echinosphaeritidae, and genus Echinosphaerites all date from 1772. Equally, the class Diploporita, family Sphaeronitidae, and genus Sphaeronites all date from 1772. Even this approach may not truly reflect when a taxon first became known to science. According to Regnéll (Reference Regnéll1945, p. 1) and Kesling (Reference Kesling and Moore1968, p. S152), both Echinosphaerites aurantium and Sphaeronites pomum were mentioned by Linnaeus (Reference Linnaeus1745) but were regarded as “crystal apples” and so thought to belong in the mineral kingdom. It could be argued that they were known to science from 1745. Kesling (Reference Kesling and Moore1968, p. S152–S159) discussed numerous previous classifications of cystoids (a taxon no longer recognized), but whichever classification is chosen, E. aurantium and S. pomum date from 1772. Similarly, however many or few species one may assign to the two genera, E. aurantium and S. pomum were still the first species described. Taxonomic synonymies allow the date of publication to be established and thus for historic discovery curves to be constructed easily.
Effort curves
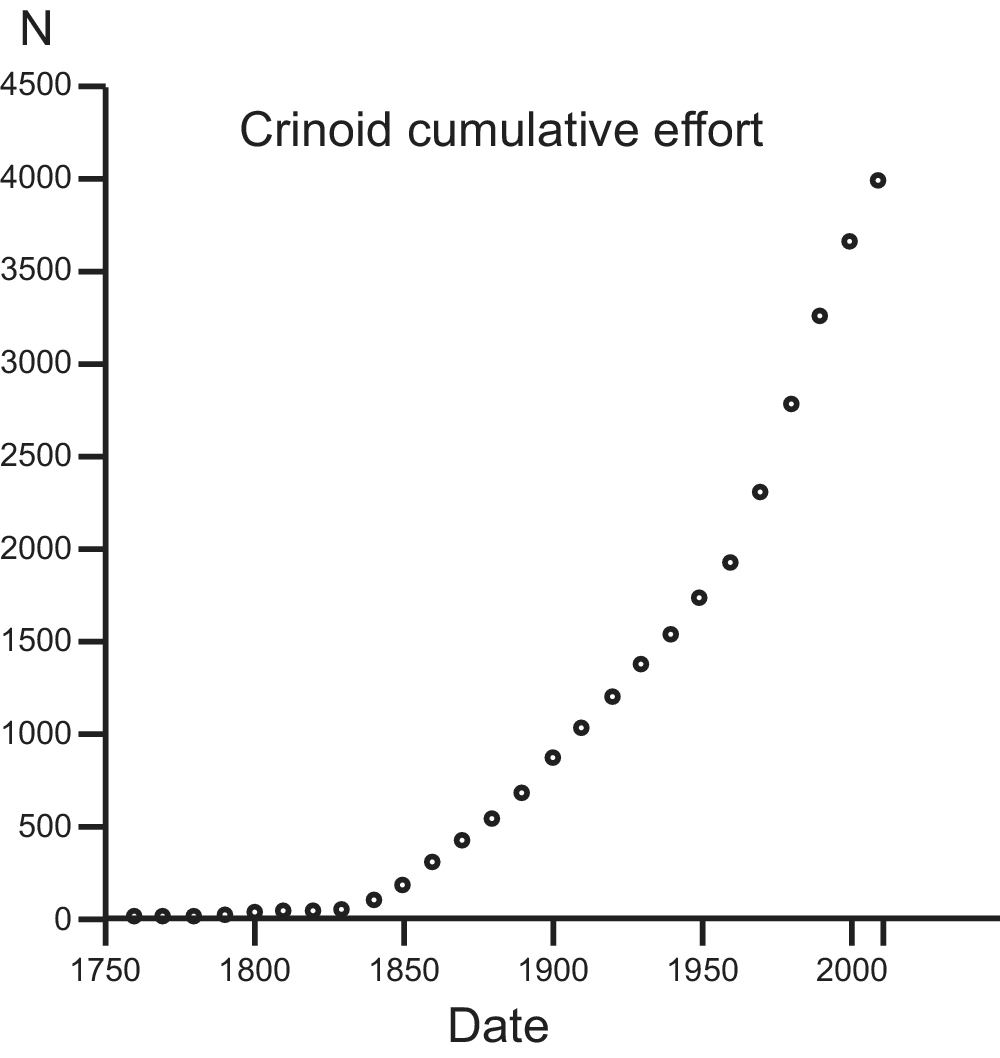
A related phenomenon is the effort involved in finding and describing fossils. This too can be analyzed historically, and typically such curves show an increase in effort through time. Webster (Reference Webster2014, appendix 1) provided a compilation of the number of publications dealing with Paleozoic crinoids annually from 1758 to 2012. Webster and Webster (Reference Webster and Webster2019) enable us to extend that to 2018 (Fig. 4). Although these will not all have been taxonomic papers, they give a sense of the growth in study of Paleozoic crinoids. Progress was very slow until the mid-nineteenth century then increased rapidly until the mid-twentieth century and even more rapidly since. The first period represents the era of gentleman scientists of independent means; the second represents the growth of practical state geological surveys and museums; the final part represents the increase in global wealth and geology departments in universities, all fueled by the dramatic increase of the global population. Nevertheless, if the rate of discovery declines despite the very significant recent increase in search effort, then we must be getting to know the fossil record quite well. Tarver et al. (Reference Tarver, Braddy and Benton2007, fig. 3, p. 180) present estimates for worker effort on trilobites (papers per year and number of authors per decade recorded in the ISI Web of Science, https://clarivate.com), showing a dramatic increase after World War II. Tarver et al. (Reference Tarver, Braddy and Benton2007, fig. 4, p. 180) also illustrate discovery curves for trilobite families and genera plotted against this worker effort. The generic curve is linear and almost entirely reflects effort, whereas the familial curve flattens out about halfway through the plot, despite the increase in effort. It would seem the trilobite fossil record is quite well known, at least at family level.
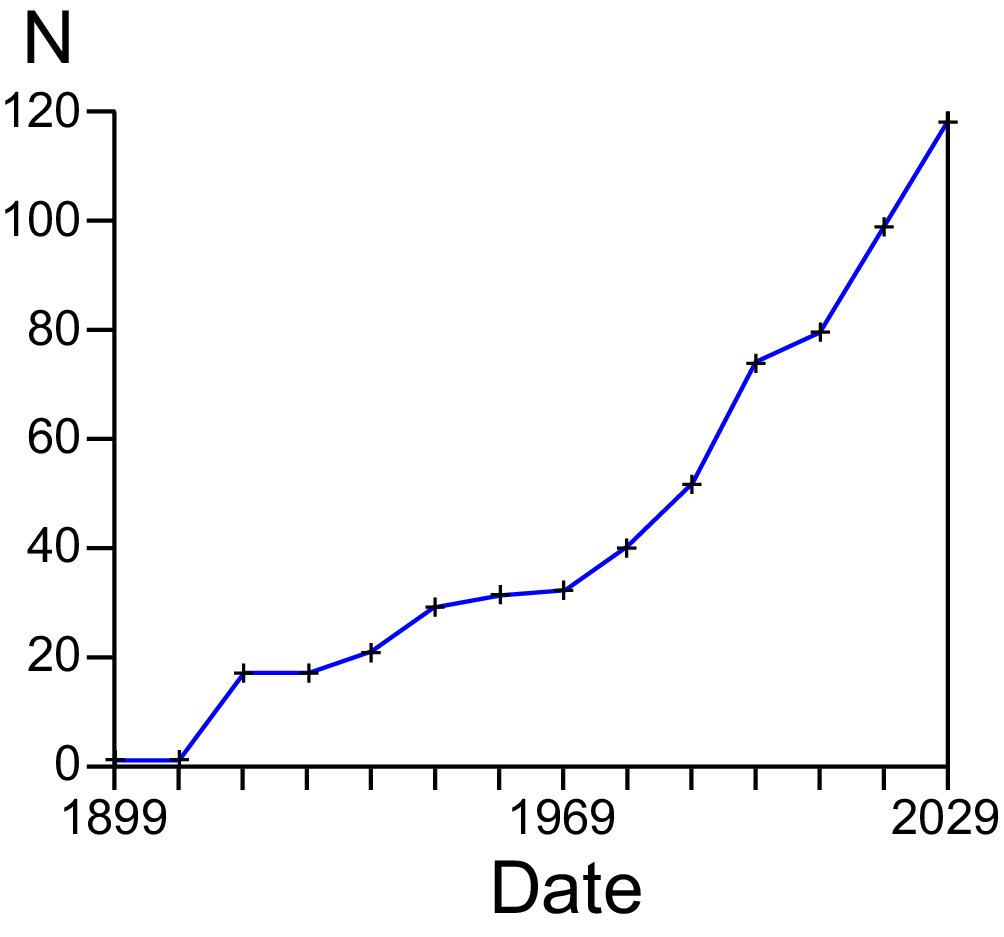
An historic discovery curve of Chinese early Paleozoic echinoderms (Fig. 5) may be compared with global cystoid discovery (Fig. 3) and global Paleozoic crinoid effort (Fig. 4) curves. Clearly, the Chinese discovery curve is concave-up and more like the global crinoid effort curve (Fig. 4) but only to the early part of the global cystoid species discovery curve (Fig. 3). At present, it would be wise to conclude that although there is very little evidence for geographic bias in the fossil record using the Chinese early Paleozoic echinoderm discovery curve, it is early still, and the situation may change in the future.
Historic discovery curves for F = families (leftmost scale), G = genera (left scale), S = species (right scale) of Rhombifera and Diploporita from 1772 to 1975. Note that most of the families were known by 1900, but both genera and species were still increasing rapidly after 1950. Redrawn from Paul (Reference Paul, Joysey and Friday1982, fig. 13, p. 103).

Figure 3. Long description
The X axis represents Date from 1750 to 2000. There are three vertical Y axes. The leftmost scale for F families ranges from 0 to 25. The middle scale for G genera ranges from 0 to 125. The rightmost scale for S species ranges from 0 to 500.
Three blue lines with plus sign markers track the data.
* Line F (short dashed line) represents families. It shows a steep increase from 1800 to 1900, reaching approximately 22 families, then plateaus significantly, ending near 25 by 1975.
* Line G (long dashed line) represents genera. It shows a steady upward trend from 1850, reaching about 70 by 1900, and continues to climb steeply to over 100 by 1975.
* Line S (solid line) represents species. It remains low until 1850, then shows the sharpest rate of increase of all three lines after 1900, rising from approximately 220 species to nearly 450 species by 1975.
Cumulative number of publications (N) on Paleozoic crinoids from 1758 to 2018. Data from Webster (Reference Webster2014, appendix 1; Webster and Webster, Reference Webster and Webster2019, supplement 1). Note the slow start followed by an exponential increase, especially since 1850.

Figure 4. Long description
The horizontal X axis is labeled Date and ranges from 1750 to 2018 with major tick marks every 50 years. The vertical Y axis is labeled N and ranges from 0 to 4500 with major tick marks every 500 units.
From 1750 to approximately 1850, the data points, represented by small open circles, remain very low and close to the X axis, indicating a slow start in publication volume.
Starting around 1850, the curve shifts from a nearly flat line to an exponential upward trajectory.
Key data points include:
* At 1850, N is approximately 200.
* At 1900, N reaches approximately 900.
* At 1950, N reaches approximately 1750.
* By 2018, the final data point reaches the 4000 mark on the Y axis.
The overall trend shows that the rate of publication on Paleozoic crinoids has accelerated significantly over the last 170 years.
Cumulative rate of discovery of Chinese lower Paleozoic echinoderm species. Note the curve starts at the very end of the nineteenth century and resembles an effort curve rather than a discovery curve. There are many more Chinese lower Paleozoic echinoderms still to be found. N = number of species; Date = time of first description.

Figure 5. Long description
The line graph plots the number of species N on the vertical Y axis against the Date on the horizontal X axis.
* The Y axis is labeled N and ranges from 0 to 120 in increments of 20.
* The X axis is labeled Date and features three major year markers: 1899 at the origin, 1969 in the center, and 2029 at the far right.
* The data is represented by a blue line connecting black plus-sign data points.
* The curve begins at 0 in 1899 and remains flat until approximately the second tick mark.
* It then shows a stepped increase, reaching approximately 20 species before 1969.
* After 1969, the curve exhibits a significant upward inflection, showing an exponential-like increase in the rate of discovery.
* The final data point near the year 2029 reaches just below the 120 mark on the Y axis.
Finally, we use class-level taxa as the ultimate example of significant new discoveries. Paleozoic echinoderms are well known for having several classes that are very distinct morphologically but very small (low biodiversity) and relatively rare. If yet unknown Chinese new classes of echinoderms were similarly rare, statistically they would be the last to be discovered. It is premature to take our results at face value.
Other tests
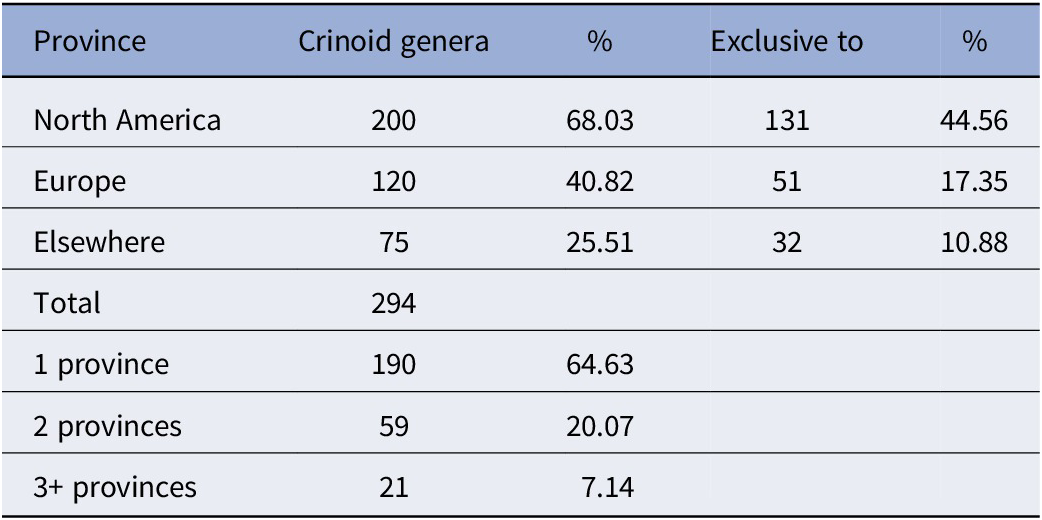
We chose to use a real example to illustrate a potential test of the geographic bias hypothesis. Other approaches are equally valid. It is not necessary to wait until another area of the globe yields significant numbers of new echinoderms or other fossils. One might, for example, degrade our existing knowledge by deleting the North American or European fossil record and comparing the resulting loss of information. To test this, we used a randomly chosen subsample of Webster and Webster’s (Reference Webster and Webster2019) crinoid data (all generic names beginning with A, B, and C). We assigned their occurrences to North America, Europe, and ‘Elsewhere’ (Table 6). As expected, most of the genera (68%) occur in North America, many (41%) in Europe, and the smallest proportion (25.5%) in the rest of the world. Nearly two-thirds (65%) occur in only one province, 20% in two provinces, and 7% in three or more provinces. If the North American fauna were unknown, just under half of the crinoid genera in the sample (44.56%) would be unknown. Loss of the European fauna would reduce known crinoid genera by 17.35%, and if the record were confined to just North America and Europe, only 10.88% of crinoid genera would be unknown. Another, perhaps more significant, effect of loss of the North American fauna would be that all Tremadocian (lowest Ordovician) crinoid genera would be unknown except for Aethocrinus Ubaghs, Reference Ubaghs1969, which is known from southern France and Morocco (Lefebvre et al., Reference Lefebvre, Allaire, Guensburg, Hunter and Kouraïss2016), and an undescribed genus from the USA and France.
Currently known geographic occurrence of a random sample of 294 Paleozoic crinoid genera

Table 6. Long description
The table is structured into five columns: Province, Crinoid genera, percentage, Exclusive to, and percentage.
* North America: 200 genera (68.03 percent), with 131 genera (44.56 percent) exclusive to this province.
* Europe: 120 genera (40.82 percent), with 51 genera (17.35 percent) exclusive to this province.
* Elsewhere: 75 genera (25.51 percent), with 32 genera (10.88 percent) exclusive to these regions.
* Total: 294 genera.
The bottom section of the table categorizes the genera by the number of provinces they inhabit:
* 1 province: 190 genera (64.63 percent).
* 2 provinces: 59 genera (20.07 percent).
* 3 plus provinces: 21 genera (7.14 percent).
Data is attributed to Webster and Webster 2019.
Note: Data from Webster and Webster (Reference Webster and Webster2019). See text for further explanation.
Webster and Webster (Reference Webster and Webster2019) list eight named Tremadocian crinoid genera, attributed to subclasses Aethocrinea, Disparida, Cladida, Camerata, and Hybocrinida, plus the order Protocrinoida, which is not assigned to a subclass. Thus, Tremadocian crinoids were already very diverse. All but one of the new genera were assigned to new families. Western North America appears to have been the cradle of the Crinoidea.
Another approach might be to consider where in the world recent new class-level discoveries have been made. For example, since the mid-twentieth century, Camptostroma Ruedemann, Reference Ruedemann1933, Helicoplacus Durham and Caster, Reference Durham and Caster1963, Ctenocystis Robison and Sprinkle, Reference Robison and Sprinkle1969, and Helicocystis Smith and Zamora, Reference Smith and Zamora2013 have been discovered or reinterpreted as echinoderms. All are significant new “class-level” discoveries only one of which, Helicocystis, came from outside North America. They also illustrate the previously mentioned point about rarity. Camptostroma and Helicocystis are still known from a single species. Helicoplacoids comprise three monotypic genera (Wilbur, Reference Wilbur2006). Only ctenocystoids are moderately diverse. Currently, seven genera and about 16 species are recognized although some taxa are still under open nomenclature. In addition, ctenocystoids have since been recorded from Europe (Fatka and Kordule, Reference Fatka and Kordule1985), Australia (Jell et al., Reference Jell, Burrett and Banks1985), and Africa (Smith et al., Reference Smith, Zamora and Alvaró2013), but the other taxa are still confined to the continent from which they were originally described.
Possible explanations
If novelty is an essential quality for geographic bias to exist, then bias is more likely to occur during periods of high endemicity in shallow continental seas. Despite deliberately choosing taxa and a stratigraphical interval that might be expected to increase the chances of discovering novelties, our results suggest the Chinese early Paleozoic echinoderm fauna is largely more of the same. One possible explanation of our results, especially in relation to early Paleozoic fossils, is plate tectonics. The parts of the global landmass that currently make up Europe and China, for example, were not always in the same geographic position; nor were they homogeneous regions. Waters et al. (Reference Waters, Marcus, Maples, Lane, Hou, Liao, Wang, Liu, Ausich and Webster2008, fig.16.1) divided modern China into at least seven named regions, one of which was labeled “composite” and all of which presumably had separate geologic histories. What is now China was part of at least three distinct provinces, just as early Paleozoic rocks in Europe include parts of North America, Baltica, Avalonia, and Gondwanaland. It seems likely that the better-explored parts of the world may well have sampled an adequate set of both latitudinal environments and longitudinally wide basins to provide a reasonable sample of early Paleozoic life, thus overcoming the effects of endemism.
By coincidence, the first paper published by one of us (Paul, Reference Paul1965) apparently recorded an enormous increase in paleogeographic range of comarocystitid paracrinoids, a small taxon of early echinoderms with very distinctive thecal plates. Previously, all comarocystitids had been found in rocks then thought to be of Middle Ordovician age from the Midwest of North America. The new specimens came from the Upper Ordovician of Girvan, Scotland. At the time, this appeared to be an increase in geographic range of several thousand kilometers, but that was before plate tectonics had been proposed, let alone accepted. Now, we know that all of Scotland north of the Southern Uplands was part of North America in the Ordovician. In addition, the American occurrences are now regarded as of early Late Ordovician age, so the increase in stratigraphic range has also been reduced. The tiny island of Britain contains early Paleozoic rocks from at least two major provinces. How much more diverse were the early Paleozoic faunas of Western Europe or North America?
Conclusion
The disproportionate number of fossils found in the scientifically better-explored parts of the globe (North America and Europe) may introduce a bias in the known fossil record. Recent increases in knowledge of the Chinese early Paleozoic echinoderm fauna have been used in a preliminary test of the geographic bias hypothesis. The basic approach designates newly discovered Chinese echinoderms as genuine novelties or more of the same. This test can be applied taxonomically, phylogenetically, or morphologically. Our preliminary results suggest that the Chinese early Paleozoic echinoderm fauna is predominantly more of the same. A potential explanation of our results is that areas such as Europe and China are composed of several different early Paleozoic provinces, and each alone may provide an adequate sample on which to build global diversity curves. This suggestion will be tested by future discoveries. Nevertheless, historic discovery curves show that the rate of new Chinese fossil echinoderm discoveries is rising sharply and therefore that the Chinese early Paleozoic echinoderm fauna is still relatively poorly known.
Acknowledgments
Comments from an anonymous reviewer, E. Nardin, Geosciences Environnement Toulouse, France, and M. Nohejlová, Czech Geological Survey, plus the editor, B. Lefebvre, greatly improved the original draft of the manuscript, not only by drawing our attention to additional records, but in sharing details of current research. Y.M. was financially supported by the National Natural Science Foundation of China (Grant number 42202019).
Competing interests
The authors declare none.

 Open access

