I. Introduction
This article examines the survival rates of cooperatives in France. The French wine industry is worthy of investigation because it has been exposed to various shifts throughout the 20th century and 21st century. Since the 1950s, French wine consumption has decreased from more than 140 liters per capita to approximately 40 liters per capita in 2015. The decline in domestic consumption was accompanied by a decline in exports, mainly due to rising competition from New World countries. French companies had to adapt their strategies (Stoeberl, Parker, and Joo, Reference Stoeberl, Parker and Joo1998) and focus on two policies: (1) differentiation through vertical integration (Cadot, Reference Cadot2015), and (2) massive production- and cost-reduction strategies. Whatever the choice, the entire industry evolved and underwent irreversible transformations in its competitive dynamics (Agarwal, Barniv, and Leach, Reference Agarwal, Barniv and Leach2002). We suggest that it is not necessarily the fittest but the most adaptable player that may survive. Thus, while most studiesFootnote 1 try to highlight relevant strategies to create value and better performance under changing conditions, we examine the adaptability of French wineries through survival analysis.
Survival analysis is generally defined as a set of methods for analyzing data in which the outcome variable is the time until the occurrence of the event of interest (e.g., the failure of a business). Survival models examine the hazard rate, which is the conditional probability that an event will occur within a particular time interval. In other words, survival analysis examines whether and why some firms have a better chance to continue operating than others. Among the determinants of survival listed in the literature, two are particularly important, firm ownership structure and its governance (Burdín, Reference Burdín2014; Iwasaki, Reference Iwasaki2014). Applied to the wine sector, these determinants reflect the traditional distinction between cooperatives and corporations. As cooperatives are owned by their members, some crucial differences exist between them and corporations: (1) voting power is distributed through the rule of “one member, one vote”; (2) benefits are proportional to patronage, not investment; and (3) while corporations seek only maximum profitability, cooperatives pursue the dual objective of providing member benefits and seeking firm profitability.
Our survival analysis results suggest that the survival function of cooperatives differs significantly from that of corporations, that is, the survival probability at any given point in time is greater for cooperatives than for corporations. Moreover, we find some evidence suggesting that cooperatives have been able to absorb part of the impact of the wine crisis at the expense of their members, which, in turn, may explain their higher survival rate.
The remainder of this article is organized as follows. Section II focuses on the theoretical foundations and hypothesis concerning the survival of cooperatives versus corporations. Section III deals with procedures: data and methods are presented. The results are given in Section IV. Section V offers some extensions and possible explanations for the survival of cooperatives, while Section VI proposes robustness tests to validate the results before concluding remarks.
II. Literature Review
The existing property right constraints of cooperatives have long been regarded as a major economic issue (Nilsson, Reference Nilsson2001). Generally, cooperative studies focus on the concepts of ownership and governance and employ property rights theory (PRT) and agency theory (AT) as conceptual frameworks. Within this framework, traditional cooperative models can be defined as having the following property rights (Chaddad and Iliopoulos, Reference Chaddad and Iliopoulos2013): ownership is restricted to members, and residual claims are nontransferable and non-appreciable but redeemable at fair value. These ill-defined property rights (Cook and Iliopoulos, Reference Cook, Iliopoulos and Ménard2000) may lead to incentive problems, such as free-rider, horizon, and portfolio problems (Cook, Reference Cook1995). Moreover, cooperatives also incur high governance costs. First, as cooperatives have a large number of members and apply the rule “one member, one vote,” people can be discouraged to engage in costly monitoring, because doing so will not bear the full cost of their investment. Second, cooperatives cannot rely on external mechanisms, such as hostile takeovers or market valuation, to place pressure on management (Staatz, Reference Staatz1987). Third, cooperatives suffer from collective-decision problems. In particular, member heterogeneity can result in divergent interests (Hansmann, Reference Hansmann1996; Hind, Reference Hind1999) and reconciling all interests may be time-consuming and costly.
Although PRT and the AT often conclude that cooperatives are inefficient, recent analyses suggest that the specific advantages of their “organizational architecture” (resource pooling and decentralization) seem to outweigh the disadvantages (vaguely defined property rights and high-monitoring costs) (Frick, Reference Frick2017). Few works have however focused on cooperatives’ survival, and even less on agricultural cooperatives. Núñez-Nickel and Moyano-Fuentes (Reference Núñez-Nickel and Moyano-Fuentes2004) evaluate the survival of oil mill in Spain and find that incorporating suppliers as members, cooperative enjoy some benefits of vertical integration—reducing the probability of failure. Monteiro and Stewart (Reference Monteiro and Stewart2015) confirm this result on producer cooperatives in Portugal. Although none of these two studies refer to the wine industry, they find higher survival rates for cooperatives than for corporations.
In addition, some analysts argue that cooperatives are more resilient particularly in times of crisis (Birchall, Reference Birchall2013; Birchall and Ketilson, Reference Birchall and Ketilson2009; Roelants et al., Reference Roelants, Dovgan, Hyungsik and Elisa2012) for the following reasons: (1) cooperatives can use abundant capital to absorb shocks; (2) democratic control ensures the involvement of members and leads to faster reaction times; (3) each member's capital investment creates responsibility and strengthens his or her commitment; and (4) the involvement of members creates opportunities to pursue aims beyond immediate business success (e.g., ethical goals), which in turn contributes to the cooperative's durability. Moreover, Cechin et al. (Reference Cechin, Bijman, Pascucci and Omta2013) find that cooperatives reduce market risk by maintaining prices paid to producers even in times of crisis. We, therefore, will test hypothesis
H1:
Cooperatives have better survival rates than corporations.
The literature describes the long-term success and survival of a firm in the wine industry as dependent mainly on a firm's ability to become market-oriented and to invest in intangibles. In a study on the French wine industry, Amadieu and Viviani (Reference Amadieu and Viviani2011) find that a high level of intangible expenses has a positive impact on performance by increasing the expected profit and reducing variance risk and vice versa. In a recent study, Benos et al. (Reference Benos, Kalogeras, Verhees, Sergaki and Pennings2016) confirm that strategic attributes of cooperatives (i.e., market and brand orientation) increase their performance. Exports are also frequently seen as a solution to increase the performance of wineries (Maurel, Reference Maurel2009) and even as a necessity to survive (Duval, Reference Duval2015).
However, cooperatives are often less engaged in intangible investments and export efforts than are corporations. Hanf and Schweickert (Reference Hanf and Schweickert2014) highlight the fact that cooperatives are created by winegrowers who want to produce and market wine together. Consequently, the main objective of a cooperative is to support its members’ businesses. Therefore, as the members are grape producers, cooperatives have a clear production orientation. Nevertheless, due to recent changes in the wine market, client orientation is the key to success, as is some understanding of consumers’ buying behavior (Lewis and Zalan, Reference Lewis and Zalan2014). Hanf and Schweickert (Reference Hanf and Schweickert2014) conclude that cooperatives have a lot of work to do to convey the benefits of intangible investments to their members. Amadieu, Maurel, and Viviani (Reference Amadieu, Maurel and Viviani2013) examine the relationship between exports and intangibles on the one hand, and company performance in the French wine industry on the other hand. However, they find no significant results for cooperatives due to their low level of exports. These results square with those of an analysis by Maurel (Reference Maurel2009). Due to their member-focused orientation, cooperatives only invest little in intangibles and exhibit only low levels of exports, which by itself should lower its survival rates. However, the fact that cooperatives exhibit higher survival rates than corporations suggests that cooperatives possess other specific survival-relevant traits which may be linked to their organizational form.
Simon-Elorz, Castillo-Valero, and Garcia-Cortijo (Reference Simon-Elorz, Castillo-Valero and Garcia-Cortijo2015), who analyze changes in winery strategies, highlight the importance of suppliers’ negotiating power in the wine industry. This is particularly important for cooperatives, as the main suppliers are also members (Declerck and Viviani, Reference Declerck and Viviani2012); corporation have only limited pass-on possibilities. We thus hypothesize that the survival of cooperative relies on its capacity to absorb market fluctuations by adjusting the price it pays to its members. The second hypothesis we will test is, therefore,
H2:
The determinants of survival in the French wine industry differ between corporations and cooperatives.
III. Method and Measures
This section presents samples and data used in this empirical but exploratory study, measurements of different variables, and the survival analysis approach.Footnote 2
A. Sample and Data
Our sample draws on data from a collaborative project of the Confederation of French Wine Cooperatives (CCVF), the General Association of French Wine Firms (AGEVE), and France Agrimer (i.e., the French Ministry of Agriculture). The collaboration began in 1998 and has been financed by Crédit Agricole SA, the largest agricultural bank in France.
We draw on ALTARÈSFootnote 3 data on French companies (producers, wine merchants, wholesalers, and cooperatives) with a turnover of more than €2 m. The wholesaler segment is ambiguous since they can buy and sell packaged wines or blend and package bulk wine they bought. Only the latter category fits the “wine trade” definition, as “pure” wholesalers belong to the “distribution sphere.” Drawing on expert opinion, we determine the main business purpose of each wholesaler and remove those that only focus on “distribution.” Finally, as a consistency check, we compared the sum of exports of the selected 1,000 firms with the French customs wine export statistics. At the end of this process, we obtain a sample of 951 enterprises that includes 365 cooperatives and 586 corporations.
We know each firm's birth date and, in case of discontinuation, its exit from the database between 2009 and 2014. During our observation period, a total of 53 firms disappeared—24 cooperatives and 29 corporations. Information on the reason of their closure is not available in the database. Therefore, for each disappearance, we collect information from the Bulletin officiel des annonces civiles et commerciales (BODACC). Firms in our sample disappear for one of three reasons: dissolution, liquidation,Footnote 4 or merger.
B. Descriptive Statistics and Variables
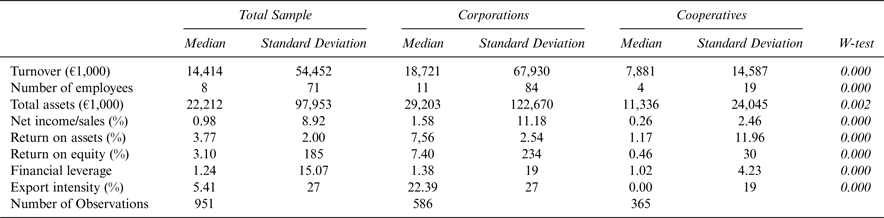
We report descriptive sample statistics in Table 1. In our sample, most companies are relatively small. Nearly 90% of our sample consists of small and medium enterprises (SMEs) with fewer than 50 employees. Cooperatives are, on average, smaller than corporations, whether their size is measured by number of employees, turnover, or total assets. They also have a lower profitability (net income/sales) ratio than corporations. As expected, the return on assets and the return on equity of cooperatives are significantly lower than for corporations. This is coherent with the differences in the property rights structure: cooperatives do not aim to maximize profits. More surprisingly, cooperatives are less indebted (financial leverage) than corporations and they export significantly less (export intensity). We also note that despite the high dispersion for each ratio or indicator calculated, the difference between cooperatives and corporations is always statistically significant (Wilcoxon test).
Sample Descriptive Statistics, 2008–2014

Source: The authors.
We denote the dependent variable, that is, disappearance from the database, firm failure. The treatment denotes whether the firm is a cooperative or not; we introduce a dummy variable with a value of 1 for cooperatives and 0 otherwise. We augment this approach with various control variables. Size is measured as the natural logarithm of total assets. As export is identified in the literature as a determinant of wine companies’ success, we introduce the variable in our model. We choose one of the most frequently used export performance measures: export intensity, given by the ratio of exports to total sales (Maurel, Reference Maurel2009). We then introduce some financial metrics. Profitability is measured by the ratio of net income to total sales, and financial leverage is given by the ratio of financial debt to equity. We then measure the return on assets and the return on equity. All these variables are calculated by taking mean values over the period considered (2009–2014). We also include fixed effects for the French wine regions Alsace, Bordeaux, Bourgogne, Champagne, Loire, and South (which comprises Languedoc, Provence, Rhône, and Sud-Ouest).
C. Method: Survival Analysis
Considering the impact of time on failure is a methodological issue. Ordinary regression models do not allow for “censoring” and time-varying covariates, justifying the use of survival analysis. Unlike other techniques, this approach not only focuses on the outcome but also analyzes the time it takes for an event to occur.
In survival analysis, the dependent variable is the hazard rate, which is the conditional probability that an event will occur within a particular time interval. Explanatory variables assess the impact of certain characteristics (e.g., being a cooperative or a corporation) on the dependent variable. The time it takes before an event occurs (in our case, the exit of a firm from the database) is referred to as survival time. Thus, the variable of interest in the analysis of firm survival is the time elapsed between entry and exit (i.e., the period from the foundation of the company to the end of its activities) (Manjon-Antolin and Arauzo-Carod, Reference Manjon-Antolin and Arauzo-Carod2008). If this period is incomplete the data are censored.
We begin our survival analysis by defining the survival time T as a positive random variable. The probability distribution of T could be defined by different functions. The core concept in survival models is the survival function at time t, specified as:
 $$S\left( t \right) = P\left( {T \gt t} \right)\; \; \; \; \; {\rm with}\; t \ge 0. $$
The survival function expresses the probability of surviving until t. At the beginning of the observation period t = 0, S(0) = 1, which means that all subjects in the study have already survived up to t = 0.
At the opposite end, the cumulative distribution function represents, for any given t, the probability of dying before t:
 $$F\left( t \right) = P\left( {X \lt t} \right) = 1 - S\left( t \right). $$
The probability density function is given by:
 $$f\left( t \right) = \displaystyle{{dF\left( t \right)} \over {dt}}. $$
It represents, for any given t, the probability to fail within a small time interval after t. This implies:
 $$ f\left( t \right) = {\lim \limits_{\Delta t \to 0}} \displaystyle{{P\left( {t \le T \le t + \Delta t} \right)} \over {\Delta t}}, $$
which expresses the unconditional instantaneous probability that a firm's exit occurs within the time interval $\; \left( {t,t + \Delta t} \right)$.
The possibility of exit and survival are related and are captured by the hazard rate (also called hazard function or instantaneous risk):
 $$h\left( t \right) = \displaystyle{{\,f\left( t \right)} \over {S\left( t \right)}}. $$
The hazard function indicates the rate at which a subject fails at t, given that it has survived until t and can be described as
 $${h\left( t \right) = \lim \limits_{\Delta t \to 0}} \displaystyle{{P\left( {t \lt {T \le t + \Delta t} \vert T \ge t} \right)} \over {\Delta t}}. $$
The hazard function is the most commonly used one. Note that the hazard function focuses on failing (i.e., experiencing the event), whereas the survivor function focuses on surviving (i.e., not experiencing the event). Because of their interrelation, by specifying only one of either the probability function, the density function, the survival function, or the hazard function, one can infer the others.
IV. Econometric Estimation and Results: Who Survives Better?
Our first objective is to analyze the difference between corporations’ and cooperatives’ survival functions. We will then assess whether ownership is a key determinant of survival.
A. Preliminary Results: Cooperatives’ versus Corporations’ Survival Functions
The nonparametric Kaplan–Meier (KM) estimator is based on the historical survival of all businesses and gives the probability of survival within a given period t. It is based on the following idea: to survive after a time t is to be alive just before t and to not die at time t.
It is defined as follows:
 $$\hat S\left( t \right) = \prod \nolimits_{t_i \le t} \displaystyle{{n_{i -} d_i} \over {n_i}}, $$
where d i is the number of exiting firms at time t i, and n i is the number of survivor firms prior to time t i.
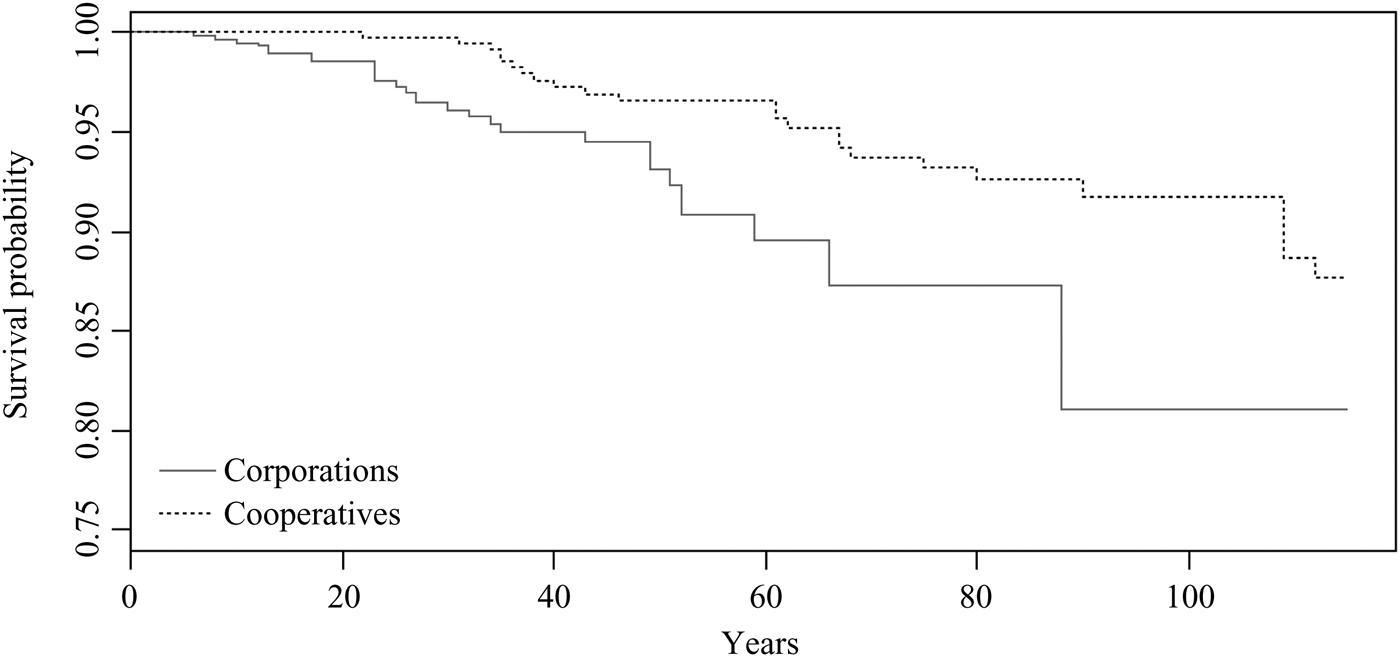
The nonparametric approach does not make any assumptions about the shape of the hazard function or about how covariates may affect that shape. Figure 1 shows that the survival functions of cooperatives and corporations are different. The fact that the line for cooperatives lies above the one of corporations indicates that cooperatives survive longer.
Kaplan–Meier Estimate of Survival in the French Wine Industry

Although Figure 1 is useful for visual comparison and the expression of results, we need to examine whether there is a statistically significant difference between the two survival curves. The most commonly used test is the log-rank test. The general rule is that a p-value of less than 0.05 based on the log-rank test indicates a difference in the survival curves. Here, we obtain a p-value of 0.0038, confirming that being a cooperative raises the survival probability.Footnote 5 However, all these analyses remain highly descriptive and do not allow for the introduction of control variables. Thus, it is necessary to employ a semiparametric approach to assess whether the ownership structure still affects the survival odds in the presence of control variables.
B. Cox Model: The Effect of Ownership Structure on the Hazard Rate
A commonly applied model is the Cox model, which explores the relationship between risk of a firm's failure and various explanatory variables. The Cox model has the advantage of not estimating the risk function and thus not making any assumptions about it. This model uses the risk–proportionality hypothesis to account for the effect of various covariates on the survival time. The basic Cox model with fixed covariates is expressed as:
 $$h_i \left( t \right) = h_0 \left( t \right).\exp \left( {\beta _1 {x_{i1}} + \cdots + \beta _k x_{ik}} \right),$$
where the hazard for individual i at time t is the product of two factors: x representing the covariates and h 0(t) the unspecified baseline hazard function, which can be interpreted as the hazard function for a subject whose covariates all have a value of 0.
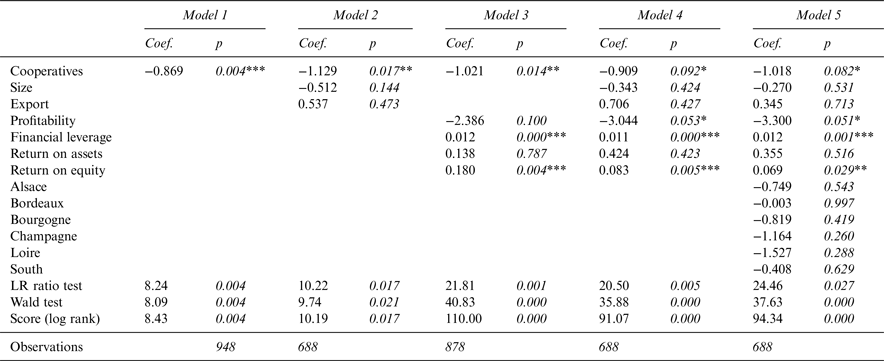
We want to find out whether being a cooperative influences the survival probability even in the presence of various control variables. We begin by estimating the time until failure with only the ownership variable (cooperative versus corporation), and then augment this approach with various control variables. Our results are reported in Table 2.
Determinants of Firm Survival (Cox Model)

*** significant at 1% level, ** significant at 5% level, * significant at 10% level.
Source: The authors.
The likelihood ratio, Wald test, and score log-rank (chi-square) statistics test the null hypothesis that all coefficients (β) are 0. The significance of the overall model is given by the p-values. Here, all models yield very small p-values suggesting that we can reject the null hypothesis, that is, at least one of the covariates contributes significantly to the explanation of the duration leading up to the event (i.e., failure).
As reported in Table 2, the estimated coefficients of the ownership treatment variable, size, and profitability are all negative, exerting a negative effect on the hazard function (i.e., the probability of failure). However, only the ownership structure is significant in all model versions suggesting that being a cooperative decreases the hazard rate even in the presence of control variables. The control variable for size is insignificant, suggesting that the size of a firm does not affect its survival. More surprisingly, exports are not correlated with the probability of failure. However, this may be explained by the fact that the export rates of cooperatives are very small per se. We explore this hypothesis in greater depth in the following section, where we compare the determinants of corporations’ and cooperatives’ survival. Concerning the financial criteria, profitability is only significant at the 10% level in the two last models. In contrast, financial leverage is highly significant and indicates, as expected, that the more leveraged firms are, the more likely they are to disappear. The return on assets does not affect a firm's survival. The coefficient of the return on equity variable seems counterintuitive as it suggests a positive correlation between profitability and probability of failure. All these financial results are quite surprising and hard to interpret. We believe that they are due to a misspecification because we do not distinguish the different causes of demise.
Our database distinguishes between the following reasons of a firm's disappearance, dissolution, liquidation, and merger. However, while corporations experience all three types of demise, cooperatives almost always disappear in mergers (see Table 3).
Descriptive Statistics About Causes of Demise

Source: The authors.
To avoid a potential bias, we need to compare cooperatives and corporations that fail for the same reason. Since our sample size is too small to include fixed effects or even various interactions, we redesign our sample to focus exclusively on firms that disappear because of financial or economic difficulties. However, it is not a priori evident what failure reason this includes.
While we can assume that liquidations are due to financial difficulties, reasons for mergers and dissolution may be ambiguous. We choose not to apply the traditional way of dealing with mergers (i.e., determining between the two firms involved which is the “survivor” by taking size into account), because this approach does not seem pertinent in the wine industry. Mergers are not simply absorptions of the smaller by the bigger firms. Mergers and acquisitions always reflect strategic choices when they are implemented by large groups, but in the case of small cooperatives, they can also be defensive, hazardous, or opportunistic (Saïsset and Cheriet, Reference Saïsset and Cheriet2012). In fact, in the wine industry, many mergers are rescue operations of financially distressed cooperatives. Thus, the key determinant to distinguish “offensive” and “defensive” mergers of cooperatives is the presence (or lack) of economic and financial difficulties (Bélis-Bergouignan and Corade, Reference Bélis-Bergouignan and Corade2008).
Therefore, we decide to build a score that is able to distinguish distressed firms from others, among those that disappear in mergers. In the French wine industry, the main reason for economic difficulties is linked to a decline in sales. Financial difficulties also arise when firms have trouble accessing capital for their investments (i.e., when they are highly leveraged); these firms are often characterized by damaged repayment ability. In the particular case of cooperatives (which are mostly affected by mergers), financial constraints also stem from difficulties obtaining capital from members. Thus, our score is based on firm activity (turnover), financial constraints (leverage and coverage ratios), and ownership of resources (capital stock).
Details about our methodology are provided in Appendix B. We calculate all indicators for the entire sample for the five years preceding the exit. Whenever a firm scores in the lowest decile for any indicator it will receive a “distress point.” We assign higher weights to years closer to the firm's exit and impose a linear depreciation scheme (see Appendix B). The larger the overall score, the more financially distressed the firm is assumed to be. We choose the mean score to be the discriminant between economically and financially distressed firms and the remaining firms. We then verify whether this choice is pertinent by comparing the score of liquidated firms to this threshold. We find that all liquidated firms exhibit scores equal or higher than the threshold suggesting that they exited because of economic and/or financial problems. We then calculate the score for the 53 firms that exit through dissolution and kept only 29 firms (9 cooperatives and 20 corporations) for which the score suggests they failed due to financial distress as well.
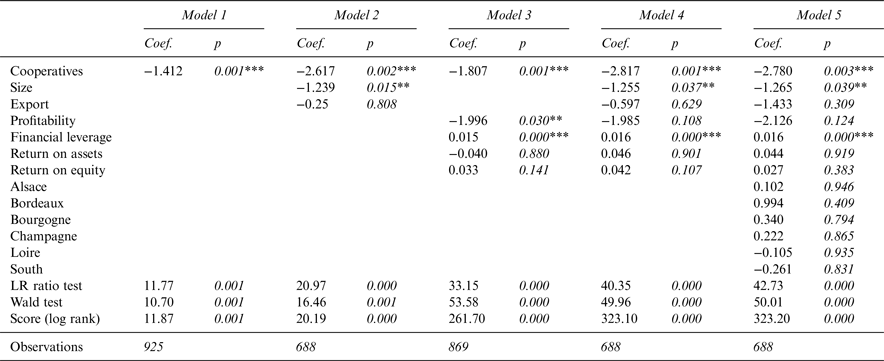
We then run our analyses with this new sample to check the robustness of our results. The Kaplan–Meier estimate still distinguishes two distinct survival probability functions for cooperatives and corporations, and the cooperatives’ curve is above that of the corporations. The results are statistically significant for all tests for differences between the two groups (see Appendix A for details of p-value). We then implement a Cox model with this new sample (see Table 4).
Determinants of Firm Survival (Cox Model) for Redesigned Sample

*** significant at 1% level, ** significant at 5% level, * significant at 10% level.
Source: The authors.
The coefficient for ownership structure (i.e., being a cooperative) remains positive and is highly significant at the 1% level, even when all control covariates are introduced. The variables export, return on assets, and region remain insignificant. However, in this new sample, size becomes a determinant of survival. As the coefficient is negative, we can conclude that the bigger the firm, the higher its probability of survival. Financial leverage is still significant at the 1% level with a positive coefficient. Finally, for this sample, profitability and return on equity do not seem to have any impact on survival.
V. Extension: What Are the Differences between Cooperatives and Corporations?
Having demonstrated that cooperatives are more likely to survive than are corporations, we now analyze the reason(s) for this phenomenon. First, we compare the determinants of survival for cooperatives and corporations. Then, we try to explain why cooperatives have better odds of survival.
A. Different Determinants of Survival
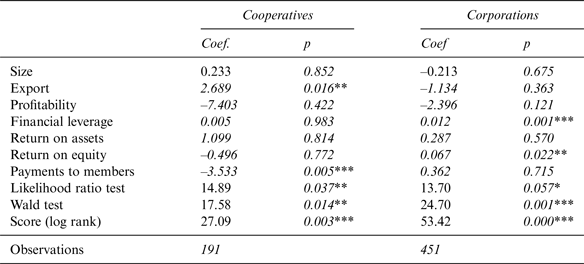
To test the differences between the determinants of survival for corporations and cooperatives, we run two different Cox models, one for each sub-population (see Table 5). Each model contains the same covariates used previously.Footnote 6
Comparison of Survival Determinants of Cooperatives and Corporations

*** significant at 1% level, ** significant at 5% level, * significant at 10% level.
Source: The authors.
The results suggest that the determinants of survival are different for cooperatives and corporations. For corporations, we observe that financial leverage is an important determinant of survival: the more indebted firms are, the more likely they are to fail. Surprisingly, the variable return on equity is positively associated with failure. This phenomenon could be explained by considering that the ratio return on equity can be increased by either raising returns or by reducing equity. French wine companies with higher returns on equity could be forced to reduce their equity when facing financial difficulties. Consequently, this variable may be positively linked to failure.
As shown in Table 5, the results are different for cooperatives. We find that exports have a positive effect on the hazard rate, indicating that cooperatives that export large fractions of their production are also the ones with the worst survival probability. Concerning profitability, our results show that neither return on assets nor return on equity influence the survival of cooperatives. Even the profitability ratio of net income to total sales does not have any impact.
These results should be put in perspective with the specific context of cooperations. A cooperative has a dual objective: being profitable but also satisfying its members (Soboh et al., Reference Soboh, Lansink, Giesen and van Dijk2009; Staatz, Reference Staatz1989). Our results suggest that profitability is not directly linked to survival. Thus, we need to investigate the effect of maximizing the value for members.
In French financial statements, cooperative members’ remuneration is noted through the raw materials purchases (“Achats de matières premières et autres approvisionnements”) entry. Members are paid for the grapes they deliver. Consequently, we create a new variable called Payments to members, given by the ratio of raw material purchases to total sales. This new variable is highly significant as reported in Table 5 and exhibits a negative correlation between payments to members and a cooperative's chances of survival. This result indicates that profitability is not the only survival determinant of cooperatives; instead, more attention should be paid to members’ remuneration.
So far, our analysis appears to support our two hypotheses, that is, cooperatives (1) survive longer than corporations and (2) possess survival determinants that are different from corporates’; particularly, member remuneration seems to play an important role. In what follows, we will assess cooperatives’ survival determinants in greater detail.
B. Why Do Cooperatives Survive Longer?
We assume that value creation within a cooperative is captured by members. Therefore, we suppose that an increase in activity not necessarily translates into higher earnings but results in a higher remuneration of members. We could simplify the value allocation and give the following equation:
 $$Sales = {raw \; material\; purchases + fixed \; costs + operating \; income}.$$
Sales serve to remunerate suppliers of raw materials and to cover fixed costs necessary to produce and sell wine. Any residuals are considered profit.
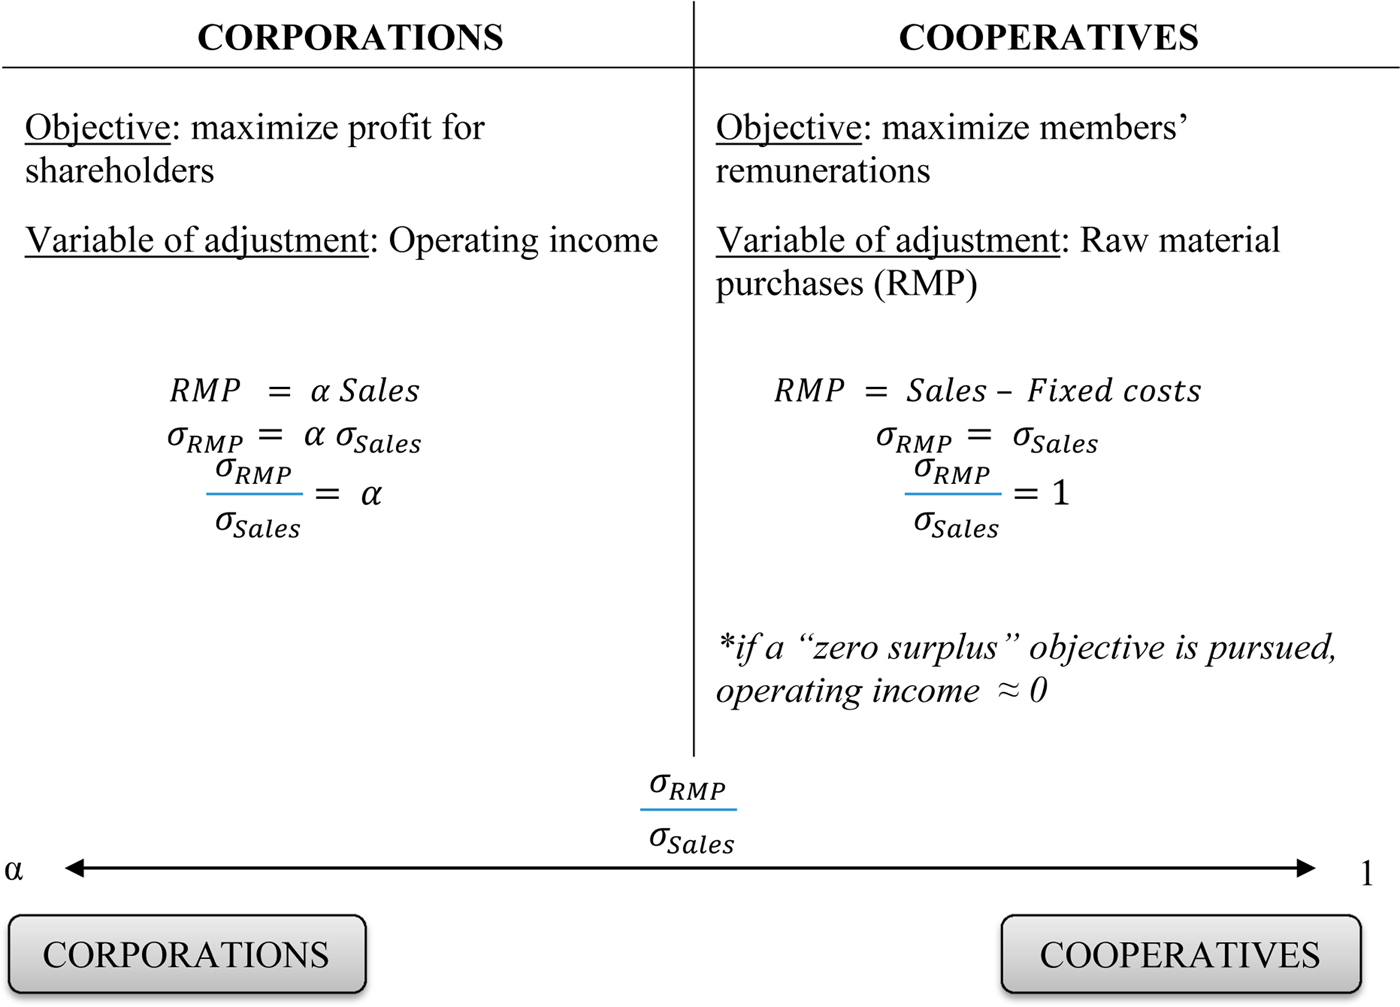
We hypothesize that cooperatives and corporations have different objectives, so that when business activity fluctuates, the adjustment variable is different for each group. Corporations aim to maximize profits for their shareholders. Thus, raw material purchases are proportional to sales, and operating income reflect this variation. In contrast, cooperatives aim to maximize their members’ remuneration, with an objective of “zero surplus.” The adjustment variable is then raw material purchases entry (see also Figure 2).
Test of Different Behaviors of Corporations and Cooperatives to Absorb Business Activity Fluctuations

Based on these assumptions, we examine the amount of variation of raw material purchases in proportion to the variation of sales for both corporations and cooperatives.
If our hypothesis is true, the ratio  $\sigma _{RMP}/\sigma _{Sales}$ should be equal to α for corporations,Footnote 7 and close to 1 for cooperatives (see Figure 2).
We first compare cooperatives and corporations by calculating the mean for each sub-group (see Table 6). As the data do not follow a normal distribution, we are not able to use parametric tests to analyze the statistical difference between the two groups. We, therefore, employ the Wilcoxon test.
Capacity to Shift Fluctuations of Activity to Members: Cooperatives versus Corporations

The ratio  $\sigma _{RMP} /\sigma _{Sales} $ represents the variation in raw material purchases over the variation in sales and reflects whether business fluctuations were passed on to members.
Source: The authors.
This first result supports our hypothesis that cooperatives and corporations behave differently, as the  $\sigma _{RMP} /\sigma _{Sales} $ ratios, reported in Table 6, are 0.81 (cooperatives) and 0.37 (corporations), respectively. The difference is statistically significant at the 1% level, suggesting that cooperatives pursue the maximization of member remunerations rather than profits. In other words, an increase (decrease) of turnover is automatically reflected in an increase (decrease) in raw material purchases (i.e., member remunerations); members absorb business fluctuations through their remunerations.
We then test whether the ability of shifting fluctuations to members is related to survival by calculating the ratios for surviving and failing cooperatives (see Table 7).
Capacity to Shift Fluctuations of Activity to Members: Surviving versus Failed Cooperatives

The ratio  $\sigma _{RMP} /\sigma _{Sales} $ represents the variation in raw material purchases over the variation in sales and reflects whether business fluctuations were passed on to members.
Source: The authors.
Again, there is a significant difference between the mean of the ratio for surviving and failing cooperatives (0.82 versus 0.55, respectively), suggesting that cooperatives that pass fluctuations on to their members are more likely to survive.
VI. Robustness Checks
We now perform some robustness test to examine the validity of our results and to address a few potential issues. First, we employ a parametric approach to model a firm's survival time. Since our sample may suffer from left-truncated bias, we then suggest some adjustments.
A. Parametric Models
Although the Cox model minimizes specification errors by not making any predetermining assumptions about the distribution of failure, its estimates are less-efficient compared to the “correct” parametric model (Burdín, Reference Burdín2014). The estimation of the model parameters is then performed following the maximum likelihood method. If the postulated distribution is correct, the estimators are more efficient than nonparametric and semi-parametric estimators.
We draw on two specifications to model the relationship between the covariates and survival. In the proportional hazards model (PH), covariates have a multiplicative effect on the hazard function:
 $$h\left( {t_j} \right) = h_0 \left( t \right)\exp \left( {x_j \beta} \right),$$
where h 0(t) is the baseline hazard, x j represents the vector of covariates, and β the corresponding regression coefficients. If we leave h 0(t) unspecified, we will estimate a Cox model. In parametric models, we assume that h 0(t) follows a specific distribution.
The second model is the accelerated failure time (AFT) model. Here, the natural logarithm of the survival time, ln t, is expressed as a linear function of the covariates:
 $$\ln t_j = x_j \beta + z_{\,j,} $$
where x j represents the vector of covariates, β the vector of regression coefficients, and z j the error with density f( ). The distributional form of the errors determines the regression model.
The most commonly parametric survival distributions used are the exponential form, where the hazard function is presumed to be constant over time; the Weibull model, where the hazard function is supposed to be monotonous over time; and the log-normal and log-logistic specification, where the hazard function is supposed to be non-monotonous. The exponential and Weibull models can be estimated as both PH and AFT models, but the log-normal and log-logistic models work only in the AFT metric.
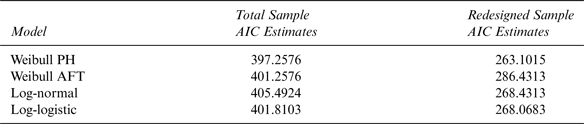
The literature on firm survival indicates that the risk of failure is not constant over time. Numerous studies show that older firms have lower hazard rates than younger ones (Manjon-Antolin and Arauzo-Carod, Reference Manjon-Antolin and Arauzo-Carod2008). Thus, the exponential distributions will not be appropriate. In the organizational ecology literature, aside from “liability of newness” (Stinchcombe, Reference Stinchcombe and March1965), some authors also suggest “liability of adolescence” (Fichman and Levinthal, Reference Fichman and Levinthal1991) or “liability of senescence” (Barron, West, and Hannan, Reference Barron, West and Hannan1994); thus, both monotonous and non-monotonous models could be used. To choose the model that best fits the data, we calculate the Akaike Information Criterion (AIC); the smaller its value, the better the model's fit. Our results are presented in Table 8.
AIC Comparison of Various Parametric Survival Distributions

We use the Akaike Information Criterion (AIC) to select the model of best fit.
Source: The authors.
The AIC for the two samples indicate that the Weibull PH distribution best fits our model. Thus, we use it to run our parametric models (see Table 9).
Robustness Checks with Parametric Models

*** significant at 1% level, ** significant at 5% level, * significant at 10% level.
Source: The authors.
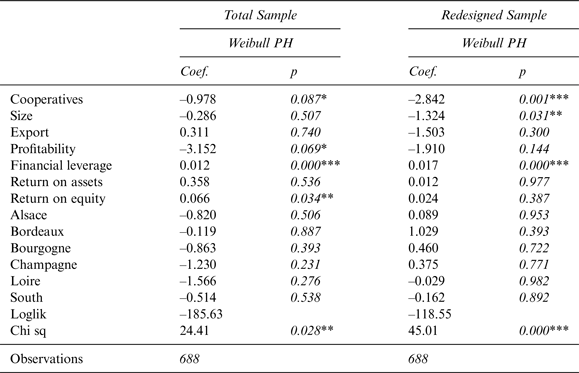
Once again, we observe a significant impact of the ownership structure (cooperatives versus corporations) on the probability of failure in the two models, and the effects of other variables are confirmed. Thus, the parametric tests again lend support to our initial hypothesis.
B. Left-Truncated Bias
There are two methods of obtaining data for a survival analysis. In the first method, called flow sampling, researchers collect observations that enter the particular state of interest (i.e., being in business or close down) during a particular interval (Wooldridge, Reference Wooldridge2010). In the case of business survival rates, this method corresponds to cohort studies: a year is chosen, and all firms launched at this time are studied until their deaths or the end of the period of observation.
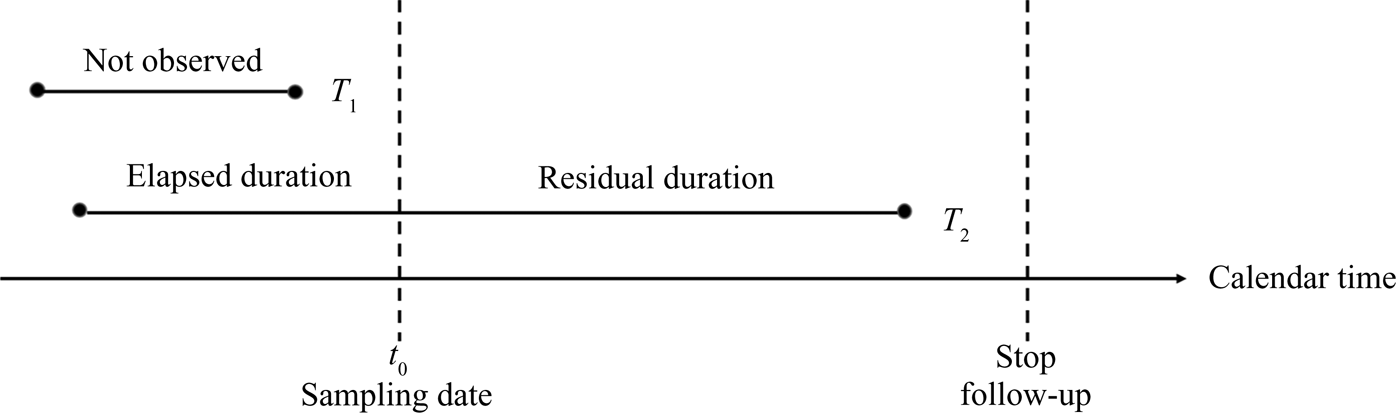
Alternatively, the researcher can draw on stock sampling and consider individuals who are already in the state of interest at the beginning of the observation period (Wooldridge, Reference Wooldridge2010). In our case, there are only two states: being in business or close down. Thus, at the beginning of our observation period, all the enterprises are already in the state of interest. This kind of sampling (see Figure 3) leads to left-truncated data and could introduce some bias: the firms in our sample have survived sufficiently long enough to be sampled, and the ones that shut down prior to the truncation time are not observed (Klein and Moeschberger, Reference Klein and Moeschberger2003). As a result, the remaining firms may be more prone to survival. To address this issue, the likelihood function must incorporate the fact that long-surviving firms are sampled systematically more often, that is, a firm's entrance into the observation window at time t must be modeled conditional on the fact that the firm has survived until the stock sampling date Y i (Wooldridge, Reference Wooldridge2010).
Left-Truncated Data Bias

Mathematically, this yields
 $$P\left[ {T \gt t{\rm \vert} T \gt Y} \right] = S\left( t \right)/S\left( Y \right).$$
That is, we analyze failures that have occurred between 2009 and 2014 conditional on firm-survival until 2008 (date of sampling) by adding the variable age which denotes the firm's age at the sampling date.
Graphically, the results of KM estimate and Cox model remain the same: the curve of cooperatives is above the one of corporations, suggesting that they survive longer. However, the results are no longer significant, which is unsurprising. Addressing the left-truncated bias by adding the age variable, we study a firm's total lifetime to assess its probability of survival. This is consistent with our previous results, that is, cooperatives survive longer than corporations and are, therefore, older.
VII. Discussion and Conclusion
We analyze the survival of French wine cooperatives and find that they survive longer than corporations, suggesting a greater ability to endure various challenges over time. These results are robust over various model specifications. Our results also do not change when we reduce our sample size to only consider firm exits that are due to financial difficulties. Our findings are in line with previous studies dealing with survival analysis and cooperatives for various non-wine industries.
When we consider all firms (cooperatives and corporations), we find that size positively affects survival, presumably due to greater market power and benefits from economies of scale. We further find that financial leverage is also linked to survival: the more indebted firms are, the more likely they are to fail.
In addition, we find that exports do not improve the survival probability of cooperatives. This is surprising as previous analyses suggest that exporting is a way to increase a firm's performance (e.g., Maurel, Reference Maurel2009). However, French wine cooperatives mainly adopt a “price/volume” strategy (Duval, Reference Duval2015) and are relatively small and developing and maintaining a sizeable export market requires substantial efforts from a small firm. Consequently, cooperatives’ export performance remains low. Amadieu, Maurel, and Viviani (Reference Amadieu, Maurel and Viviani2013) suggest that cooperatives have a “defensive” vision of exporting and do not invest many resources into it. Our results support these previous findings.
The following question arises: How and why are wine cooperatives able to survive longer than corporations? Our findings suggest that the higher endurance of cooperatives is linked to their ability to pass economic fluctuations on to their members (see also Declerck and Viviani, Reference Declerck and Viviani2012). We use the ratio of standard deviation of raw material purchases over sales to study and compare the behavior of cooperatives and corporations. We find that cooperatives adjust their raw material purchases. In other words, when business activity fluctuates, changes are absorbed by members through their remunerations for the grapes they deliver. In times of crisis, this implies that cooperatives survive at the expense of their members. In times of prosperity, cooperatives can allocate a higher percentage of cash flow toward current payments to members (or accelerate equity redemption) at the expense of retained earnings (Iliopoulos and Hendrikse, Reference Iliopoulos and Hendrikse2009). However, such a policy, although profitable to members, can threaten the sustainability of the cooperative, which will use its cash reserves and therefore mortgage its investment capacity. This reflects the traditional short-term versus long-term issue in wine cooperatives, which has to balance the maximization of value for their members with the creation and conservation of value inside the firm to allow investment and development. Further research is necessary to analyze the value allocation within cooperatives to determine an optimal level of distribution between members and firms.
This study makes three contributions to the understanding of long-term survival in the French wine industry and our theoretical knowledge of cooperatives. First, we find that wine cooperatives survive longer than corporations, underlining their ability to adapt to various shifts and mutations in their environments. Second, the survival determinants of cooperatives and corporations are different. Profitability (in the traditional sense) does not drive the survival of cooperatives. Third, we provide a possible explanation for the greater survival rate of cooperatives. Our results indicate that cooperatives are more likely than corporations to pass the burden of unfavorable business climates on to members who also function as input (i.e., grape) suppliers.
Appendix A: Testing Differences between Two Groups
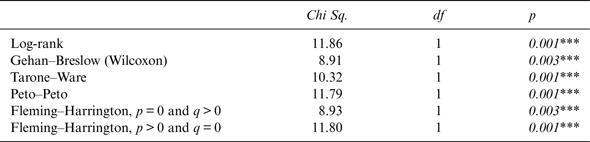
Most commonly used to determine whether there is a statistically significant difference between two survival curves is the log-rank test (or Mantel–Haenszel Test). It is calculated on contingency tables for particular groups (e.g., cooperatives versus corporations) and by status (e.g., dead or alive) within a certain time period. The contribution to each test statistic at each observed survival time is obtained by calculating the expected number of events in each group (Mills, Reference Mills2011). We run different tests to obtain statistical differences between curves obtained with KM estimates in the total sample (Table 10) and in the redesigned sample (Table 11).
Statistical Differences for Curves Obtained with KM Estimates: Total Sample

Statistical Differences for Curves Obtained with KM Estimates Redesigned Sample

All tests are significant at the 1% level, except for the first Fleming–Harrington test for the total sample. The Fleming–Harrington test belongs to the family of “weighted logrank tests” that assign different weights to early and late exits. For each test, we choose the weights p (early exits) and q (late exits). If p > q, the test puts more weight on shorter survival times (i.e., earlier failures). In contrast, if p < q, more weight is given to longer survival times (i.e., later failures). In the log-rank test, p = q = 0. In the Gehan–Breslow, Tarone–Ware, and Peto–Peto tests, statistics apply more weight to early failures. In the second Fleming–Harrington test, as p > q, more weight is put on earlier failures. Finally, only in the first Fleming–Harrington test is weight put on later failures. The fact that the results are less significant are consistent with our hypotheses and indicates that differences between the survival rates of cooperatives and corporations increase with time (i.e., cooperatives survive longer than corporations).
Appendix B: Details about Score Calculation
We want to construct a financial difficulty score that is able to distinguish firms that exit due to economic and financial difficulties from others. We are mainly interested in differentiating between offensive and defensive mergers, and calculate a score for each firm that exits the database between 2008 and 2014 due to mergers.
We focus on three criteria, measured by four ratios:
– Activity: percentage change in sales
– Financial constraints: debt/equity and debt/cash-flow
– Own resources: percentage change in equity
First, each ratio is computed for the total sample. We then calculate the first and last deciles (D1, D9).
Second, we assign to each firm a score of 1 if the firm is in the lowest decile for any of the ratios for each of five years preceding its demise, and 0 otherwise.
Third, to give more weight to the last years before a firm's exit, we assign linear weights and depreciate the past. In particular, if t e denotes the time of exit, we multiply the score by five for t e – 1 (one year before the exit), by four for t e – 2 (two years for the exit), etc.
Each firm now has four scores, in addition to the sum of the five annual scores (t e – 5 to t e – 1). These scores are included between 0 and 15:
– Score 1 is related to the variation of turnover.
– Score 2 is related to leverage.
– Score 3 is related to repaying ability.
– Score 4 is related to the variation of capital stock.
The final score is given by:
 $$Final\; score = score\; 1 + score\; 2 \times \; 0.5 + score\; 3 \times 0.5 + score\; 4.$$
Consequently, the final score for each firm could vary between 0 and 45, with 45 signaling the most distressed firms.
The fourth and last step consists of determining a discriminant score. We calculate the mean score (15) and define it as the threshold. As this step could be arbitrary, we use information about demises to validate our choice. We know the reason for each firm's demise and especially are able to identify firms that disappeared in a liquidation process (i.e., firms that were in economic and financial distress before their demise). Thus, we validate this choice by comparing the score of liquidated firms to this threshold. All the liquidated firms have a score equal to or higher than 15.
Finally, we calculate the score for the 53 exiting firms and remove from our sample all exiting firms that obtain a score lower than 15, as we cannot be sure that these firms disappeared because of economic and financial difficulties. This redesigned sample contains 29 exiting firms (20 corporations and 9 cooperatives).