
1. Introduction
Here, we examine the near-wall scaling behaviour of canonical turbulent flows on smooth surfaces. These flows include two-dimensional zero-pressure gradient boundary layers, and fully developed pipe and channel flows. The focus is on the region  $y^+<100$, which includes the peaks in the streamwise and spanwise turbulent stresses. Here,
 $y$ is the distance from the wall, and the superscript
 $+$ denotes non-dimensionalization using the fluid kinematic viscosity
 $\nu$ and the friction velocity
 $u_\tau =\sqrt {\tau _w/\rho }$, where
 $\tau _w$ is the mean wall shear stress and
 $\rho$ is the fluid density.
For isothermal, incompressible flow, it is commonly assumed that for the region close to the wall
 \begin{equation} [U_i,\overline{u_i u_j}] = f(y, u_\tau, \nu, \delta), \end{equation}
where  $U_i$ and
 $u_i$ are the mean and fluctuating velocities in the
 $i$th direction. The overbar denotes time averaging and the outer length scale
 $\delta$ is, as appropriate, the boundary layer thickness, the pipe radius or the channel half-height. That is,
 \begin{equation} [U_i^+,\overline{({u_i u_j})^+}] = f(y^+, Re_\tau),\end{equation}
where the friction Reynolds number  $Re_\tau =\delta u_\tau /\nu$.
By all indications, the streamwise mean velocity  ${U}$ in the region
 $y/\delta \lessapprox 0.15$ is a unique function of
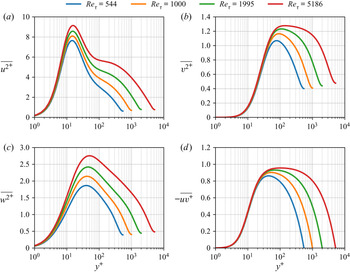
 $y^+$ that is independent of Reynolds number (e.g. Zagarola & Smits Reference Zagarola and Smits1998; McKeon et al. Reference McKeon, Li, Jiang, Morrison and Smits2004). In contrast, the Reynolds stresses in the near-wall region exhibit a significant dependence on Reynolds number, as illustrated in figure 1 for channel flow. Here,
 $\overline {u^2}$,
 $\overline {v^2}$ and
 $\overline {w^2}$ are in the streamwise, wall-normal and spanwise directions, respectively, and
 $-\overline {uv}$ is the Reynolds shear stress.
(a–d) Profiles of turbulent stresses in channel flow, as computed by DNS by Lee & Moser (Reference Lee and Moser2015).

The behaviour of the streamwise component  $\overline {{u^2}^+}$ has been a particular focus of attention, especially its peak value
 $\overline {{u_p^2}^+}$ located at
 $y^+ \approx 15$. By experiment, Samie et al. (Reference Samie, Marusic, Hutchins, Fu, Fan, Hultmark and Smits2018) showed that in a boundary layer for
 $6123 \le Re_\tau \le 19\,680$,
 $\overline {{u_p^2}^+}$ follows a logarithmic variation given by
 \begin{equation} \overline{{u^2_p}^+} = \beta + \alpha \ln(Re_\tau),\end{equation}
with  $\alpha =0.646$ and
 $\beta =3.54$. Lee & Moser (Reference Lee and Moser2015) found a very similar result from direct numerical simulation (DNS) of a channel flow (using only the data for
 $Re_\tau \ge 1000$) with
 $\alpha =0.642$ and
 $\beta =3.66$, very much in line with the result reported by Lozano-Durán & Jiménez (Reference Lozano-Durán and Jiménez2014), also obtained by DNS of channel flow, who found
 $\alpha =0.65$ and
 $\beta =3.63$. Finally, Pirozzoli et al. (Reference Pirozzoli, Romero, Fatica, Verzicco and Orlandi2021) found
 $\alpha =0.612$ and
 $\beta =3.75$ from DNS for pipe flow at
 $Re_\tau$ up to 6000.
We now examine the scaling of all four stress components in the near-wall region using DNS for channel flows (Lee & Moser Reference Lee and Moser2015), pipe flows (Pirozzoli et al. Reference Pirozzoli, Romero, Fatica, Verzicco and Orlandi2021) and boundary layers (Sillero et al. Reference Sillero, Jiménez, Moser and Malaya2011; Sillero, Jiménez & Moser Reference Sillero, Jiménez and Moser2013; Wu et al. Reference Wu, Moin, Wallace, Skarda, Lozano-Durán and Hickey2017). Couette flows were also considered but it turns out that their behaviour is very different from that of the other canonical flows (Pirozzoli, Bernardini & Orlandi Reference Pirozzoli, Bernardini and Orlandi2014; Lee & Moser Reference Lee and Moser2017, Reference Lee and Moser2018), and therefore they will be considered separately in a future study. Earlier work that was focused on channel flow was presented by Smits & Hultmark (Reference Smits and Hultmark2021) and Hultmark & Smits (Reference Hultmark and Smits2021), as referenced by Monkewitz (Reference Monkewitz2021).
2. Taylor series expansions
We begin by writing the Taylor series expansions for  $u_i$ in the vicinity of the wall. Instantaneously (Pope Reference Pope2000; Bewley & Protas Reference Bewley and Protas2004),
 $$\begin{gather} \underline u^+{=} \underline a_1 + \underline b_1 y^+{+} \underline c_1{y^+}^2 + \underline d_1{y^+}^3+ O({y^+}^4), \end{gather}$$
 $$\begin{gather}\underline v^+{=} \underline a_2 + \underline b_2 y^+{+} \underline c_2{y^+}^2 + \underline d_2{y^+}^3+ O({y^+}^4), \end{gather}$$
 $$\begin{gather}\underline w^+{=} \underline a_3 + \underline b_3 y^+{+} \underline c_3{y^+}^2 + \underline d_3{y^+}^3+ O({y^+}^4), \end{gather}$$
where  $\underline u=U+u$, etc. The no-slip condition gives
 $\underline a_1 = \underline a_2 = \underline a_3=0$, and by continuity
 $\partial \underline v /\partial y|_w = \underline b_2 = 0$. Also
 $$\begin{gather} \underline b_1 = (\partial \underline u^+{/} \partial y^+)_w, \end{gather}$$
 $$\begin{gather}\underline b_3 = (\partial \underline w^+{/} \partial y^+)_w, \end{gather}$$
 $$\begin{gather}\underline c_2 = {\tfrac{1}{2}} (\partial^2 \underline v^+{/} \partial {y^+}^2)_w ={-}{\tfrac{1}{2}} (\partial \underline b_1/ \partial x^+{+} \partial \underline b_3/ \partial z^+). \end{gather}$$
For the corresponding time-averaged quantities
 $$\begin{gather} {\overline{{u^2}^+}}/{{y^+}^2} = F_{u^2} = f_{u^2} + 2\overline{b_1 c_1} y^+{+} O({y^+}^2), \end{gather}$$
 $$\begin{gather}{\overline{{v^2}^+}}/{{y^+}^4} = F_{v^2} = f_{v^2} + 2\overline{c_2 d_2} y^+{+} O({y^+}^2), \end{gather}$$
 $$\begin{gather}{\overline{{w^2}^+}}/{{y^+}^2} = F_{w^2} = f_{w^2} + 2\overline{b_3 c_3} y^+{+} O({y^+}^2), \end{gather}$$
 $$\begin{gather}{\overline{uv^{+}}}/{{y^+}^3} = F_{uv} = f_{uv} + (\overline{b_1 d_2} + \overline{c_1 c_2}) y^+{+} O({y^+}^2), \end{gather}$$
where we use the notation  $f_{u^2} = \overline {b_1^2}$,
 $f_{v^2} = \overline {c_2^2}$,
 $f_{w^2} = \overline {b_3^2}$ and
 $f_{uv} = \overline {b_1c_2}$.
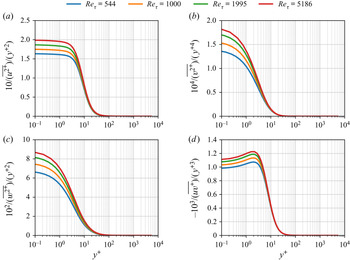
These functions all become constant as the wall is approached, and the values of  $f_{u^2}$,
 $f_{v^2}$,
 $f_{w^2}$ and
 $f_{uv}$ are given by their intercepts at
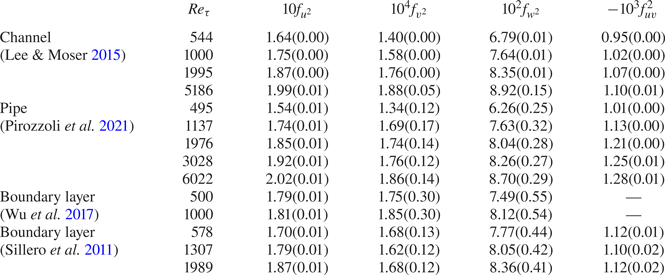
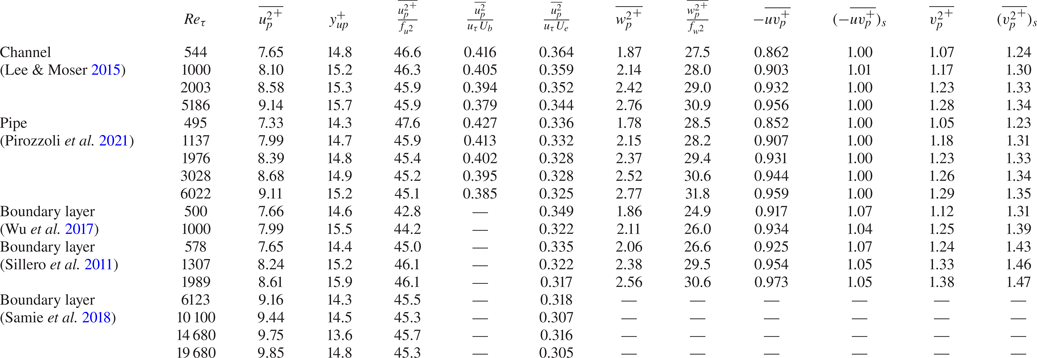
 $y^+=0$, as illustrated in figure 2 for channel flow. Similar results are obtained for the other flows, and they are listed in table 1.
Profiles of (a)  $\overline {{u^{+}}^2}/{{y^+}^2}$, (b)
 $\overline {{v^{+}}^2}/{{y^+}^4}$, (c)
 $\overline {{w^{+}}^2}/{{y^+}^2}$ and (d)
 $(-\overline {uv^+})/{y^+}^3$. From DNS of channel flow (Lee & Moser Reference Lee and Moser2015).

Flow and Reynolds number dependence of the functions  $f$. Data only for
 $Re_\tau > 200$. Estimated uncertainty in parentheses. For the data of Wu et al. (Reference Wu, Moin, Wallace, Skarda, Lozano-Durán and Hickey2017),
 $f_{uv}$ could not be retrieved due to limited resolution very close to the wall.

Computing the functions using the definitions in (2.4)–(2.6) requires expensive computations that depend on the dataset. Instead, we use (2.7)–(2.10) and employ the Richardson extrapolation method, where the linear approximation of  $f_{u^2}$ (
 $=\tilde {f}_{u^2}$) is given by
 \begin{equation} f_{u^2} \approx \tilde{f}_{u^2} = F_{u^2}|_{y = y_1^+} - (F_{u^2}|_{y = y_2^+} - F_{u^2}|_{y = y_1^+} )\frac{y_1^+}{{y_2^+{-} y_1^+}}, \end{equation}
where  $y_1^+$ and
 $y_2^+$ are the distances from the wall of the first two data points. The estimated error is given by the magnitude of the second term on the right-hand side. For the channel flow the differences between results from the direct computation or the Richardson extrapolation are smaller than the estimated error bounds.
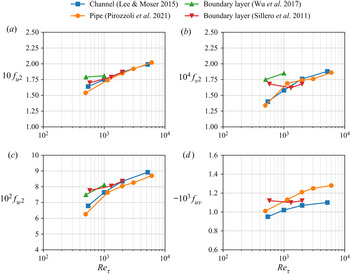
The Reynolds number dependencies of the functions  $f$ are shown in figure 3. They all increase with Reynolds number, but at a given Reynolds number there are differences among the values for channel, pipe and boundary layer flows. These trends are discussed further in § 4.
Reynolds number variations of functions  $f$: (a)
 $f_{u^2}$, (b)
 $10^3 f_{v^2}$, (c)
 $f_{w^2}$ and (d)
 $10^2 f_{uv}$. Lines are for visual aid only. The values with uncertainty estimates are listed in table 1.

3. Scaling the streamwise stress profiles
Scaling each  $\overline {{u^+}^2}$ profile with the value of
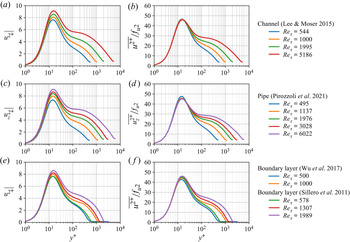
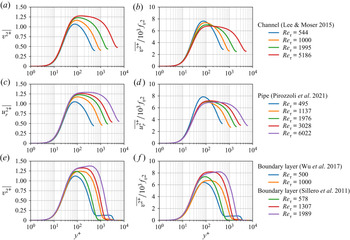
 $f_{u^2}$ at the same Reynolds number yields the results shown in figure 4. For all three flows, the collapse of the data for
 $y^+<20$ is impressive, including the almost exact agreement on the scaled inner peak value. In fact, from table 2 it is evident that with increasing Reynolds number
 $f_{u^2}$ and
 $\overline {{u_p^+}^2}$ for all three flows approach a constant ratio to each other such that
 \begin{equation} \overline{{u_p^+}^2} \approx 46\,f_{u^2}.\end{equation}
A similar observation was made previously by Agostini & Leschziner (Reference Agostini and Leschziner2018) and Chen & Sreenivasan (Reference Chen and Sreenivasan2021). In other words, the magnitude of the peak at  $y^+ \approx 15$ tracks almost precisely with
 $f_{u^2}$, a quantity that is evaluated at
 $y^+=0$.
Profiles of streamwise stresses. (a,c,e) Conventional scaling and (b,d, f)  $f$-scaling. (a,b) Channel flow (Lee & Moser Reference Lee and Moser2015). (c,d) Pipe flow (Pirozzoli et al. Reference Pirozzoli, Romero, Fatica, Verzicco and Orlandi2021). (e, f) Boundary layer flow (Sillero et al. Reference Sillero, Jiménez, Moser and Malaya2011; Wu et al. Reference Wu, Moin, Wallace, Skarda, Lozano-Durán and Hickey2017).

Scaling the inner peak maximum values  $\overline {{u^+_p}^2}$,
 $\overline {{w^+_p}^2}$,
 $-\overline {uv^+_p}$ and
 $\overline {{v^+_p}^2}$. Here,
 $(-\overline {uv^+_p})_s=-\overline {uv^+_p}/(1-2/\sqrt {\kappa Re_\tau })$ and
 $(\overline {{v^2}^+_p})_s=\overline {{v^2}^+_p}/(1-2/\sqrt {\kappa Re_\tau })$ with
 $\kappa = 0.384$. For the boundary layer experiments,
 $f_{u^2}$ was estimated using (3.2). For the pipe and channel flows,
 $U_{CL}$ was used instead of
 $U_e$ in the mixed scaling.

What about the scaling of  $\overline {{u_p^+}^2}$ at higher Reynolds numbers? Although the collapse of the data shown in figure 4 is encouraging, the DNS data only cover a small Reynolds number range. We can use high-Reynolds-number experimental data instead, but we need to know what values of
 $f_{u^2}$ should be used. The highest-Reynolds-number experiments that are fully resolved are those by Samie et al. (Reference Samie, Marusic, Hutchins, Fu, Fan, Hultmark and Smits2018), but even then data are not available for
 $y^+<5$, so the values of
 $f_{u^2}$ cannot be obtained directly from the data. In this respect, we note that for pipe and channel flows the variation of
 $f_{u^2}$ for
 $Re_\tau >1000$ is close to logarithmic, so that
 \begin{equation} f_{u^2} = 0.08 + 0.0139 \ln{Re_\tau}.\end{equation}
For boundary layers a similar relationship appears to fit the data for  $Re_\tau >3000$, but the Reynolds number range is too small to make any definite conclusions. If we simply assume that the pipe and channel flow relationship given by (3.2) can be used to find the right values of
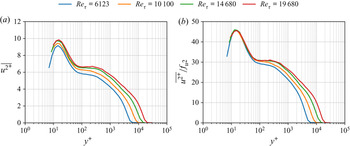
 $f_{u^2}$ for high-Reynolds-number boundary layers, then we obtain the results shown in figure 5. We see a clear collapse of the data for
 $y^+<20$, and so it appears that the near-wall profiles of
 $\overline {{u^2}^+}$ for boundary layers, pipes and channel flows all collapse in this scaling.
Experimental streamwise stress profiles in boundary layers for  $Re_\tau = 6123$ to 19 680 (Samie et al. Reference Samie, Marusic, Hutchins, Fu, Fan, Hultmark and Smits2018). (a) Conventional scaling and (b)
 $f$-scaling.

What about the inverse? Figure 6 shows the variation of the peak streamwise turbulence intensity  $\overline {u_{p}^{2^{+}}}$ with
 $Re_{\tau }$ for boundary layers at lower Reynolds numbers. It is seen that the correlation developed by Samie et al. (Reference Samie, Marusic, Hutchins, Fu, Fan, Hultmark and Smits2018) based on experimental data for
 $6000< Re_{\tau }<20\,000$ agrees very well for the DNS data, at least for
 $Re_{\tau }>400$. It is thus reasonable to expect that the channel flow DNS correlation developed by Lee & Moser (Reference Lee and Moser2015) for
 $544< Re_{\tau }<5186$ can be used to predict the behaviour of
 $\overline {u_{p}^{2^{+}}}$ in turbulent channel flows at much higher Reynolds numbers.
Variation of  $\overline {u_{p}^{2^{+}}}$ with Reynolds number in boundary layers. Blue line: DNS (Wu et al. Reference Wu, Moin, Wallace, Skarda, Lozano-Durán and Hickey2017). Orange line: equation (1.3) (Samie et al. Reference Samie, Marusic, Hutchins, Fu, Fan, Hultmark and Smits2018).

We can also make some observations on mixed-flow scaling. DeGraaff & Eaton (Reference DeGraaff and Eaton2000) proposed that  $\overline {u^2}$ in the wall region of boundary layers collapses when scaled with
 $u_\tau U_e$ versus
 $y^+$, where
 $U_e$ is the mean velocity at the edge of the layer (hence the term mixed scaling). If this is correct, then
 $\overline {u_p^2}/(u_\tau U_e)$ should be invariant with Reynolds number. The boundary layer data in table 2 support this proposition at the higher Reynolds numbers. There is a broad implication here that
 $f_u^2$ is related in some way to
 $u_\tau U_e$, but it is not clear what that connection is.
For pipe and channel flows, to apply mixed scaling we could use either  $U_b$ or
 $U_{CL}$ in the place of
 $U_e$, where
 $U_b$ is the bulk velocity and
 $U_{CL}$ is the centreline velocity. Table 2 indicates that the centreline velocity is a better choice, and the high-Reynolds-number values of
 $\overline {{u^+_p}^2}/(u_\tau U_{CL})$ for pipe flow are similar to those seen for
 $\overline {{u^+_p}^2}/(u_\tau U_e)$ in boundary layers. However, the values of
 $\overline {{u^+_p}^2}/(u_\tau U_{CL})$ in channel flow are considerably higher than those seen in the other flows. This behaviour is not seen for
 $\overline {{u^+_p}^2}/f_u^2$ which is more or less constant for all flows, and so the scaling with
 $f_u^2$ seems to be more general than that offered by mixed scaling. We would not expect universality across different flows for mixed scaling, primarily because
 $U_{CL}^+$ is flow-specific.
Finally, we note that the position of the peak in the streamwise stress, denoted by  $y^+_{up}$, is invariant with Reynolds number for all the flows considered here, is shown in table 2. For all flows, including the high-Reynolds-number experiments, the value is constant at
 $15 \pm 0.8$ (the uncertainty is similar to that set by the resolution of the data in this region). This value is in accord with most previous estimates.
4. Scaling the other stress profiles
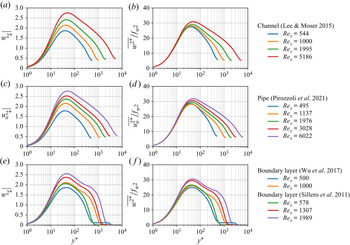
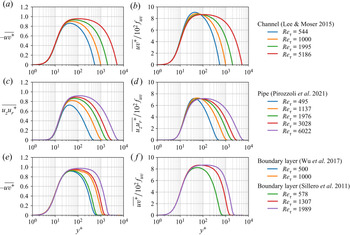
When the  $\overline {{w^+}^2}$ profiles are scaled with the value of
 $f_{w^2}$ at the same Reynolds number, we obtain the results shown in figure 7. The data collapse well for
 $y^+<20$, but the scaling does not capture the peak value. From table 2 we see that the ratio between
 $\overline {{w^+_p}^2}$ and
 $f_{w^2}$ is a slowly increasing function of Reynolds number, and no asymptotic behaviour is apparent, at least over this Reynolds number range. In addition, the location of the peak moves away from the wall with increasing Reynolds number for all three flows. Thus, for the streamwise and spanwise stresses, the scaling is appropriate only for
 $y^+<20$ (hence it can capture the peak for
 $\overline {{u^+}^2}$ but not for
 $\overline {{w^+}^2}$).
Profiles of spanwise stresses. (a,c,e) Conventional scaling and (b,d, f)  $f$-scaling. (a,b) Channel flow (Lee & Moser Reference Lee and Moser2015). (c,d) Pipe flow (Pirozzoli et al. Reference Pirozzoli, Romero, Fatica, Verzicco and Orlandi2021). (e, f) Boundary layer flow (Sillero et al. Reference Sillero, Jiménez, Moser and Malaya2011; Wu et al. Reference Wu, Moin, Wallace, Skarda, Lozano-Durán and Hickey2017).

As for the  $\overline {{v^+}^2}$ profiles shown in figure 8, scaling by
 $f_{v^2}$ yields modest improvement over the unscaled data, if the lowest-Reynolds-number cases are disregarded. An explanation for this behaviour is advanced in § 5. It is clear, however, that the profiles develop a plateau with increasing Reynolds number. The height of this plateau for the unscaled data may be characterized by the peak value of
 $\overline {{v^+}^2}$, and these values are given in table 2 as
 $\overline {{v_p^+}^2}$.
Profiles of wall-normal stresses. (a,c,e) Conventional scaling and (b,d, f)  $f$-scaling. (a,b) Channel flow (Lee & Moser Reference Lee and Moser2015). (c,d) Pipe flow (Pirozzoli et al. Reference Pirozzoli, Romero, Fatica, Verzicco and Orlandi2021). (e, f) Boundary layer flow (Sillero et al. Reference Sillero, Jiménez, Moser and Malaya2011; Wu et al. Reference Wu, Moin, Wallace, Skarda, Lozano-Durán and Hickey2017).

The shear stress profiles shown in figure 9 display a similar behaviour to the normal stress distributions, in that the proposed scaling offers some improvement over the unscaled data, and that a broad plateau appears with increasing Reynolds number. However, for the pipe and channel flows the extent of the plateau must be bounded at its outer limit by the linear decrease in shear stress dictated by the streamwise pressure gradient. Its maximum value also cannot exceed one. However, it is rather satisfying to see that the scaling for the peak value proposed for channel flow (Lee & Moser Reference Lee and Moser2015; Orlandi, Bernardini & Pirozzoli Reference Orlandi, Bernardini and Pirozzoli2015), that is,  $(-\overline {uv^+_p})_s=-\overline {uv^+_p}/(1-2/\sqrt {\kappa Re_\tau })$ with
 $\kappa = 0.384$, works very well for both channel and pipe flows, as shown in table 2.
Profiles of shear stresses. (a,c,e) Conventional scaling and (b,d, f)  $f$-scaling. (a,b) Channel flow (Lee & Moser Reference Lee and Moser2015). (c,d) Pipe flow (Pirozzoli et al. Reference Pirozzoli, Romero, Fatica, Verzicco and Orlandi2021). (e, f) Boundary layer flow (Sillero et al. Reference Sillero, Jiménez, Moser and Malaya2011; Wu et al. Reference Wu, Moin, Wallace, Skarda, Lozano-Durán and Hickey2017).

We now return to the behaviour of the peak value of the wall-normal stress,  $\overline {{v_p^+}^2}$. For the channel and pipe flows, the peak level appears to approach a level
 $>1.3$ with increasing Reynolds number. For
 $y^+<100$, the ratio
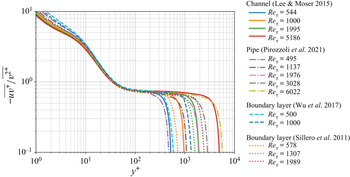
 $-\overline {uv}/\overline {v^2}$ displays an almost universal behaviour, as illustrated for all three flows in figure 10, so that
 $\overline {{v_p^+}^2}$ should scale like
 $-\overline {uv_p^+}$. The values of
 $(\overline {{v^2}^+_p})_s=\overline {{v^2}^+_p}/(1-2/\sqrt {\kappa Re_\tau })$ are given in table 2, and they indeed tend to approach an asymptotic value of about 1.38 at high Reynolds number, for both channel and pipe flows. The asymptotic value for boundary layers appears to be closer to 1.5, although the experiments by DeGraaff & Eaton (Reference DeGraaff and Eaton2000) at Reynolds numbers up to 10 070 suggest a level more like 1.4. This number corresponds to the constant
 $A_2$ in Townsend's scaling of the wall-normal fluctuations in the logarithmic region, as derived from the attached eddy hypothesis (Townsend Reference Townsend1976).
Profiles of  $-\overline {uv}/\overline {v^2}$ in channel flow (Lee & Moser Reference Lee and Moser2015), pipe flow (Pirozzoli et al. Reference Pirozzoli, Romero, Fatica, Verzicco and Orlandi2021) and boundary layer flow (Sillero et al. Reference Sillero, Jiménez, Moser and Malaya2011; Wu et al. Reference Wu, Moin, Wallace, Skarda, Lozano-Durán and Hickey2017).

5. What does it all mean?
The Taylor series expansion revealed that
 $$\begin{gather} f_{u^2} = \overline{b_1^2} = \overline{\left( \frac{\partial u^+}{\partial y^+} \right)^2_w} = \frac{\overline{{\tau_{wx}}^2}}{\underline{\tau}_w^2}, \end{gather}$$
 $$\begin{gather}f_{w^2} =\overline{b_3^2} = \overline{\left( \frac{\partial w^+}{\partial y^+} \right)^2_w} = \frac{\overline{{\tau_{wz}}^2}}{\underline{\tau}_w^2}. \end{gather}$$
For wall-bounded flows, therefore, the controlling parameter in the near-wall scaling for  $u$ is the mean square of the fluctuating wall stress in the
 $x$ direction
 $\tau _{wx}$, and for
 $w$ it is the mean square of the fluctuating wall stress in the
 $z$ direction
 $\tau _{wz}$. For the other two functions, the Taylor series expansion gives
 $$\begin{gather} f_{v^2} = \overline{c_2^2} = {\frac{1}{4}} \overline{ \left( \frac{\partial^2 \underline v^+}{ \partial {y^+}^2} \right)^2_w } ={-}{ \frac{1}{2}} \overline{ \left( \frac{\partial b_1 } {\partial x^+} + \frac{ \partial b_3} {\partial z^+} \right)^2 }, \end{gather}$$
 $$\begin{gather}f_{uv} = \overline{b_1 c_2}, \end{gather}$$
where  $b_1$,
 $b_3$ and
 $c_2$ are the fluctuating parts of
 $\underline b_1$,
 $\underline b_3$ and
 $\underline c_2$, as given in (2.4)–(2.6). The functions
 $f_{v^2}$ and
 $f_{uv}$ therefore express correlations between spatial gradients of the instantaneous wall stress fluctuations, as well as the fluctuating wall stress itself, and so it is more difficult to give a precise meaning to
 $f_{v^2}$ and
 $f_{uv}$, although they are clearly more connected to the small-scale motions than either
 $f_{u^2}$ or
 $f_{w^2}$. Also, by continuity, we see that it is essentially the gradients of the fluctuating shear stress (
 $b_1$ and
 $b_2$) that give rise to the wall-normal motion through continuity.
This connection with the fluctuating wall stress helps to explain the Reynolds number dependence of the functions  $f$ shown in figure 3. With increasing Reynolds number the large-scale (outer-layer) motions contribute more and more to the fluctuating wall stress by modulation and superimposition of the near-wall motions (Marusic, Mathis & Hutchins Reference Marusic, Mathis and Hutchins2010; Örlü & Schlatter Reference Örlü and Schlatter2011; Mathis et al. Reference Mathis, Marusic, Chernyshenko and Hutchins2013; Agostini & Leschziner Reference Agostini and Leschziner2016; Yang & Lozano-Durán Reference Yang and Lozano-Durán2017; Agostini & Leschziner Reference Agostini and Leschziner2018; Lee & Moser Reference Lee and Moser2019) (see also § 6). Of course, it is the turbulence that controls the wall stress, and not vice versa, but the main point is that the whole of the region
 $y^+ < 20$ (including the peak in
 $\overline {{u^2}^+}$) scales with the velocity scale
 $u_s=u_\tau \sqrt {f_{u^2}}$, which can be determined by measuring the fluctuating wall stress, a clear indication of the increasingly important contribution of the large-scale motions to the near-wall behaviour as the Reynolds number increases. Because
 $f_{v^2}$ and
 $f_{uv}$ are more connected to the small-scale motions than either
 $f_{u^2}$ or
 $f^2_{w}$, it might be expected that they feel the effects of modulation more than the effects of superimposition by the large-scale motions (Marusic et al. Reference Marusic, Mathis and Hutchins2010).
An interpretation based on dissipation scaling rather than wall stress scaling was offered by Chen & Sreenivasan (Reference Chen and Sreenivasan2021). By using the energy budget for  $\overline {{u^2}^+}$, they noted that
 $\sqrt {f_u^2}$ is equal to the dissipation rate for
 $\overline {{u^2}^+}$ at the wall,
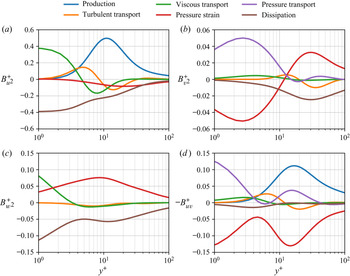
 $\large \epsilon _{u_w}^+$. What is more, close to the wall, the dissipation is balanced by viscous transport, and all other terms are small, as illustrated for channel flow in figure 11. According to Chen & Sreenivasan (Reference Chen and Sreenivasan2021), this leads to two conclusions. The first is that the order of the peak value of
 $\overline {{u^2}^+}$ can be estimated as
 ${\large \epsilon _{u_w}^+} y^+_p$, which yields the same result as that given by (3.1). The second is that, because the dissipation is proposed to be bounded at infinite Reynolds number, the logarithmic increase in
 ${f_u^2}$ (equation (3.2)), and by extension the logarithmic increase in
 $\overline {{u_p^2}^+}$ (equation (1.3)), need to be reconsidered. They then suggest an alternative formulation for the peak magnitude that approaches a finite limit at infinite Reynolds number, based on the proposed Reynolds number dependence of the dissipation.
Energy budgets for turbulent stresses in channel flow at  $Re_\tau =5186$ (Lee & Moser Reference Lee and Moser2015): (a)
 $\overline {{u^2}^+}$, (b)
 $\overline {{v^2}^+}$, (c)
 $\overline {{w^2}^+}$ and (d)
 $-\overline {{uv}^+}$.

However, figure 11 shows that the energy balance for  $\overline {{u^2}^+}$ changes rapidly with distance from the wall, so that by
 $y^+=10$ the production dominates and the viscous transport has actually changed sign. It is not clear, therefore, why a dissipation scaling should persist all the way to
 $y^+=20$. One of the assumptions made by Chen & Sreenivasan (Reference Chen and Sreenivasan2021) is that the production balances the dissipation at the location where the production is maximum, which is close to the point where
 $\overline {u^2}$ has its peak value. However, Lee & Moser (Reference Lee and Moser2015) showed the largest imbalance of the production and dissipation actually occurs at that particular location. Our interpretation, based on the wall stress signature, has the benefit of reflecting more directly the influence of the large-scale motions in the near-wall region, and so may offer a more robust explanation for the near-wall scaling.
The energy budget for  $\overline {{w^2}^+}$ also indicates that very close to the wall the viscous transport is balanced by dissipation
 $\epsilon _{w_w}^+$. However, by about
 $y^+ \approx 3$, the balance changes so that now pressure strain balances the dissipation and all other terms are small. Again, it seems more natural therefore to build a scaling argument on the behaviour of the wall stress fluctuations rather than the dissipation.
Finally, the energy budgets for  $\overline {{v^2}^+}$ and
 $-\overline {{uv}^+}$ very close to the wall indicate that for both stresses pressure strain is balanced by pressure transport, which must both go to zero at the wall (figure 11). For
 $\overline {{v^2}^+}$, the balance changes rapidly with distance from the wall so that by
 $y^+>10$ the pressure strain/dissipation balance dominates. Even more interestingly, for
 $-\overline {{uv}^+}$ the dissipation is not important anywhere in the near-wall region and for
 $y^+>10$ the pressure strain/production balance dominates.
6. Two-dimensional spectral density of  $f_{u^2}$, $f_{v^2}$, $f_{w^2}$, $f_{uv}$


To help understand the influence of the large-scale motions on the fluctuations in the wall stress, we now examine the spectral structure of the proposed scaling parameters. The spectral densities of the functions  $f$ are given by
 $$\begin{gather} E_{f_{u^2}}(k_x, k_z) = 2\mathrm{Re} \{ \overline{ \widehat{b_1} \widehat{b_1^*}} \} , \end{gather}$$
 $$\begin{gather}E_{f_{v^2}}(k_x, k_z) = 2\mathrm{Re} \{ \overline{ \widehat{c_2} \widehat{c_2^*}} \}, \end{gather}$$
 $$\begin{gather}E_{f_{w^2}}(k_x, k_z) = 2\mathrm{Re} \{ \overline{ \widehat{b_3} \widehat{b_3^*}} \}, \end{gather}$$
 $$\begin{gather}E_{f_{uv}}(k_x, k_z) = 2\mathrm{Re} \{ \overline{ \widehat{b_1} \widehat{c_2^*}}\}, \end{gather}$$
where  ${\hat {\cdot }}$ denotes Fourier transformation in the
 $x$ and
 $z$ directions and
 ${\hat {\cdot }^*}$ denotes the complex conjugate of
 ${\hat {\cdot }}$. Also,
 $k_x$ and
 $k_z$ are the wavenumbers in the
 $x$ and
 $z$ directions, respectively. We use the polar-log coordinate system introduced by Lee & Moser (Reference Lee and Moser2019) to investigate the spectral structure in terms of length scales and anisotropy. In this approach, the two-dimensional spectral densities in Cartesian coordinates
 $(k_x, k_z)$ are mapped to the polar-log coordinates
 $(k_x^\sharp , k_z^\sharp )$ with corresponding Jacobians. For example,
 \begin{equation} f_{u^2} = \iint E_{f_{u^2}} \,\mathrm{d} k_x \,\mathrm{d} k_z = \iint \frac{|k|^2}{\xi} E_{f_{u^2}} \,\mathrm{d}k_x^\# \,\mathrm{d}k_z^\# \end{equation}
and
 \begin{equation} k_x^\# = \frac{k_x}{|k|} \xi , \quad k_z^\# = \frac{k_z}{|k|}\xi, \end{equation}
where
 \begin{equation} |k| = \sqrt{k_z^2 + k_z^2} \quad\mathrm{and}\quad \xi = \log_{10} \frac{|k|}{k_{ref}}, \end{equation}
where we choose the reference wavenumber  $k_{ref} = Re_\tau / 50\,000$. In this form, the anisotropy of the spectral density and the contributions of
 $k_x = 0$ and
 $k_z = 0$ are clearly represented. The more commonly used premultiplied two-dimensional spectral density
 $k_x k_z E(\log k_x, \log k_z)$ suppresses the contribution to the spectral density when either
 $k_x$ or
 $k_z$ is small, thereby masking the influence of the large-scale motions. More details of the representation of two-dimensional spectral densities in the polar-log coordinate system are given by Lee & Moser (Reference Lee and Moser2019).
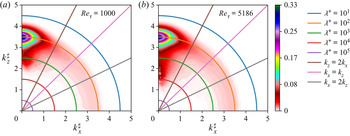
The spectral densities of  $f_{u^2}$, shown in figure 12, indicate that streamwise-elongated motions (
 $2k_x < k_z$) dominate the energy content. Also, motions with
 $\lambda ^+ \approx 100$ make the largest contributions, which is consistent with the spectral density of
 $u'^2$ which has a peak at
 $\lambda _z^+ = 100$ in near-wall flows, corresponding to the spacing of the near-wall streaks. Furthermore, with increasing Reynolds number the contributions by the large-scale motions increase; compare, for example, the contributions by motions with
 $\lambda ^+ > 1000$, a trend that is consistent with previous work (Örlü & Schlatter Reference Örlü and Schlatter2011; Cimarelli et al. Reference Cimarelli, De Angelis, Schlatter, Brethouwer, Talamelli and Casciola2015; Lee & Moser Reference Lee and Moser2019).
Two-dimensional spectral density of  $f_{u^2}$ in channel flow, using the DNS of Lee & Moser (Reference Lee and Moser2015): (a)
 $Re_\tau = 1000$ and (b)
 $Re_\tau = 5186$.

To quantify the contributions of large-scale motions and small-scale motions to  $E_{f_{u^2}}$, we use a high-pass filter according to
 \begin{equation} f^2_{u,SS} = \int_{|\boldsymbol{k}|> k_{c}} E_{f_{u^2}} \,\mathrm{d} \boldsymbol{k}, \end{equation}
where  $k_{c}$ is the cut-off frequency. For the high-Reynolds-number case shown in figure 12(b), a convenient demarcation between small-scale and large-scale motions occurs at
 $\lambda ^+ \approx 1000$, and so we choose
 $k_{c}^+ = 2{\rm \pi} /1000$. The results are given in figure 13(a). Whereas
 $f_{u^2}$ increases with Reynolds number, as shown earlier in figure 3, the small-scale contribution
 $f^2_{u,SS}$ is almost invariant. Because the small-scale motions (
 $\lambda ^+ < 1000$) are universal in the near-wall region (Lee & Moser Reference Lee and Moser2019), we conclude that
 $f_{u^2}$ is the correct scaling parameter for the streamwise velocity fluctuations in the near-wall region of flows at high Reynolds number since it properly measures the contributions by large-scale motions. Given the strong connection that exists between
 $f_{u^2}$ and
 $\overline {u_p^2}$, it is not surprising that a similar split between large- and small-scale motions is found for
 $\overline {u_p^2}$, as shown in figure 13(b). Given that the wall stress fluctuations are often difficult to measure experimentally, it seems possible therefore to use the behaviour of
 $\overline {u_p^2}$ as a proxy for
 $f_{u^2}$.
Contribution by small-scale motions to (a)  $f^2_{u}$ and (b)
 $\overline {{u_p^2}^+}$. Results for channel flow using the DNS of Lee & Moser (Reference Lee and Moser2015).

The spectral densities of  $f_{v^2}$,
 $f_{w^2}$ and
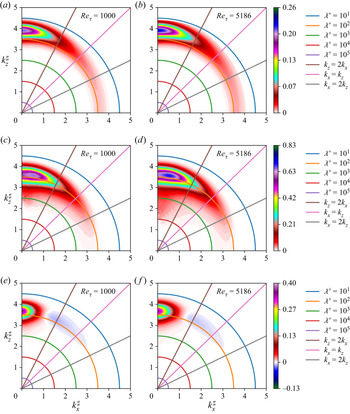
 $f_{uv}$ are shown in figure 14. Only
 $f_{w^2}$ shows an increasing contribution of large-scale motions as the Reynolds number increases but it is weak relative to what was seen for
 $f_{u^2}$. The peak values of both
 $f_{v^2}$ and
 $f_{w^2}$ increase with Reynolds number at fixed length scales, but the peak in
 $E_{f_{w^2}}$ occurs at a smaller length scale than the peak in
 $E_{f_{u^2}}$ and the peak of
 $E_{f_{v^2}}$ is at an even smaller length scale, independent of Reynolds number. Also,
 $E_{f_{u^2}}$ and
 $E_{f_{w^2}}$ show a streamwise-elongated structure, whereas
 $E_{f_{vv}}$ has a more isotropic structure. Unique among these functions,
 $f_{uv}$ has a negative contribution where
 $2 k_x > k_z$. Similar features are seen in the spectral densities of
 $-u'v'$ (Lee & Moser Reference Lee and Moser2019), but the underlying mechanism of this negative contribution is not clear.
Two-dimensional spectral density of  $f$ in channel flow (Lee & Moser Reference Lee and Moser2015) for (a,c,e)
 $Re_\tau = 1000$ and (b,d, f)
 $Re_\tau = 5186$: (a,b)
 $10^3f_{v^2}$, (c,d)
 $10f_{w^2}$ and (e, f)
 $-10^2f_{uv}$.

7. Conclusions
By expanding the velocity in a Taylor series with distance from the wall, the Reynolds number dependence of the near-wall distributions of the Reynolds stresses was traced to the magnitude of the fluctuating wall shear stress and its spatial gradients, which are increasingly affected by the superimposition and modulation of the near-wall motions due to large-scale, outer-layer motions as the Reynolds number increases.
The Taylor series expansion also suggests a separate scaling for each component of the Reynolds stress. For the streamwise and spanwise components, the scaling collapses the data for  $y^+ < 20$, a region that includes the near-wall peak in
 $\overline {{u^2}^+}$ but not that in
 $\overline {{w^2}^+}$. For the wall-normal component and the Reynolds shear stress, the proposed scaling offers a modest improvement in the collapse of the data over traditional scaling, one that appears to get better at higher Reynolds numbers.
Revisiting the dimensional analysis given in (1.2), we can now be more precise and write for the Reynolds stresses in a two-dimensional wall-bounded flow, for the region  $y^+<20$,
 \begin{equation} \overline{(u_i u_j)^+} = f(Re_\tau) g(y^+).\end{equation}
That is, it is possible to separate the dependence on Reynolds number from the dependence on wall distance.
It may also be remarked that because the scaling is different for each component of the stress, any isotropic definition of eddy viscosity will obviously fail in the near-wall region. In this respect, Hultmark et al. (Reference Hultmark, Vallikivi, Bailey and Smits2013) noted that in the overlap region, where both the mean velocity  $U$ and the streamwise stress
 $\overline {{u^2}^+}$ follow a logarithmic distribution,
 $\overline {{u^2}^+}$ depends on
 $U$ rather than its gradient.
More generally, there are many similarities among the three flows considered here. For example, within the uncertainty limits, the values for  $f_{u^2}$,
 $f_{v^2}$ and
 $f_{w^2}$ are similar for all three flows, at least for
 $Re_\tau > 1000$, at which point they show almost identical growth with further increases in Reynolds number. As to
 $f_{uv}$, the differences between pipe and channel flows grow with Reynolds number. A contributing factor may be that the large-scale motions are subject to different geometric constraints (Chung et al. Reference Chung, Marusic, Monty, Vallikivi and Smits2015). In terms of the energy budget, the key factor appears to be the pressure, in that pressure strain and transport in this region near the wall are the dominant terms in the budget of
 $-\overline {uv}$.
Acknowledgements
The authors would like to thank M. Fu and L. Ding for their comments on an earlier draft.
Funding
This work was supported by ONR under grant N00014-17-1-2309 (A.J.S., M.H.); PRACE Research Infrastructure Grant 2019204979 (S.P.); and Sandia (INCITE) programme and DOE Office of Science Contract DE-AC02-06CH11357 (M.L). Sandia National Laboratories is a multimission laboratory managed and operated by National Technology and Engineering Solutions of Sandia, LLC, a wholly owned subsidiary of Honeywell International, Inc., for the US Department of Energy's National Nuclear Security Administration under contract DE-NA0003525. This paper describes objective technical results and analysis. Any subjective views or opinions that might be expressed in the paper do not necessarily represent the views of the US Department of Energy or the United States Government.
Declaration of interests
The authors report no conflict of interest.