Introduction
In March 2001 State Politics and Policy Quarterly (SPPQ) launched with the mission of providing scholars a peer-reviewed publication outlet featuring works focused on subnational American politics. In doing so, the founders hoped this act of intentional focus and support would “greatly enhance both our understanding of political behavior and policymaking and our appreciation of the diversity, complexity, and substantive importance of the American states” (Mooney Reference Mooney2001, 4). Recognizing the glaring gap in both publication and mentorship support among scholars of state politics, the editors believed a lack of attention had “caused the field to be less coherent, less attractive to younger scholars, and less progressive than it could be” (Mooney Reference Mooney2001, 2). Through the creation and curation of SPPQ, the original 14 members of the organizing committee – and all those that have served as editors or committee members in the quarter-century since – have worked tirelessly to show us; when a subject matters, it matters how we as a discipline engage it.
It is equally important to situate SPPQ within the broader discipline. Let us be frank: the field of Political Science undeniably has white supremacist origins with some of the leading founders rooting our early understandings of government and the governed around the false “truth” that racial minorities were inferior to whites (see McClain Reference McClain2021). Relatedly, the study of racial and ethnic politics (REP) has been contested since its emergence as a subfield. In fact, the hesitancy to embrace the study of REP was one reason the National Conference of Black Political Scientists (NCOBPS) was founded in 1969, and why some 26 years later, the REP section was created with the American Political Science Association (APSA) (see Masuoka and O’Brien Reference Masuoka and O’Brien2026). Like the founding members of SPPQ, these scholars recognized the vital need for intentional institutional place-making to support a burgeoning, but vitally important, subfield.
In the 1980s, the National Black Election Study was first conducted, in part because the American National Election Study lacked a sufficient Black sample to provide scholars with confidence about the contours of Black public opinion (see Simien Reference Simien2013). In that same decade, the Latino National Political Survey was launched, allowing the discipline to learn more about the views of that group (see Garcia et al. Reference Garcia, Garcia, Falcon and de la Garza1989). Adding to these complications, the study of whiteness has evolved over time. Increasingly, scholars are recognizing that whiteness is not merely a default category, but a racial category itself, and that whiteness is critical for understanding the erosion and sustainability of democratic institutions (see Shilliam and Spence Reference Shilliam and Spence2025).
Moreover, the discipline’s emphasis on quantitative methods may not necessarily align with the experiences of racial minorities in the US states. As Wilson (Reference Wilson1985, 61) wrote in an essay in which he wrestled with why Political Science studied Black politics less so than cognate disciplines:
Political science, compared to the sister disciplines of sociology and history, has failed to generate sustained interest and scholarly breakthroughs in the study of Black life. There is a disciplinary ‘mismatch’ between the central substantive concerns and current methodological orientations of the discipline, and the most salient and interesting features of Afro-American political life.
In other words, not only did scholars interested in REP who employed quantitative methods need to design separate surveys to conduct their work – which were not easy to create – but also, if REP scholars were not utilizing quantitative data, then they were at a disadvantage when it came to publishing in top outlets. In this sense, state-level REP scholarship has often required methodological innovation not as a choice, but as a necessity. Importantly, these constraints do not simply shape what scholars are able to study; they also present real limits to the kind of normative claims we can make about representation and inequality.
As we show below, only a small share of articles in the journal’s history have meaningfully engaged racial and ethnic politics as a central focus (11.6%), while a smaller but notable portion incorporates race primarily as a control or contextual variable (3.4%). Our main conclusion is twofold. On the one hand, we have gleaned important insights from published works in SPPQ. On the other hand, there remains much to learn about the manner in which race shapes state politics and policy.
Over the past quarter-century, the more than 500 articles published by SPPQ have deepened the theoretical and empirical foundations of state politics as a field and illuminated how institutions, identities, and inequalities shape governance and representation across the American states. Given this expansive legacy, the opportunity to review the treatment of racial and ethnic politics across the archive is both an immense responsibility and a necessary undertaking. It demands an intentional reflection on how questions of race, power, and belonging have been centered, sidelined, or transformed in the study of American state politics.
We do not intend to disparage, discredit, or dismiss extant scholarship. Instead, we hope to follow in the footsteps of this publication’s founders, showing enough care to dedicate the time needed to make a full assessment, enough courage to face up to our shortcomings if present, and importantly, enough conviction to call the discipline to action if necessary.
Methodology
We first collected all articles published by SPPQ from March 2001 to March 2025. Our goal was to compile the volume and issue number of each publication, along with complete records of article titles, author(s), abstracts, and page length. We proceeded with a hand-scrape approach, accessing each issue individually and recording all relevant information in a shared dataset, while also downloading the articles into a shared drive. In total, we collected 532 articles, with abstracts available for all but six.
The first and most consequential methodological challenge of any review of this kind is corpus identification, that is, determining which pieces meaningfully engage with racial and ethnic politics. This is not a straightforward task. Race and ethnicity appear in the journal’s abstracts in vastly different ways. At times as the central object of inquiry, and other only as a demographic control variable. Race is sometimes considered a contextual factor shaping some other outcome, or, in some instances, it is not considered at all. Casting too wide of a net risks inflating the corpus with articles that mention race only in passing. Conversely, casting too narrow of a net risks missing scholarship that engages substantively with race without foregrounding known keywords. When also considering that the language scholars use to discuss race has shifted considerably over 25 years, it only compounds the challenge of properly classifying articles.
Because no single method can capture the full complexity of political texts, large-N content analyses benefit greatly from drawing on multiple approaches. In other words, no matter how far computational approaches advance, they will never be a substitute for a close read of research, accompanied by a modicum of expertise (see also Grimmer and Stewart Reference Grimmer and Stewart2013). This review therefore embraces multiple strategies in tandem, leveraging the scale of computational tools while also providing a close read of a subset of articles. The following sections outline how these principles guided our approach to identifying, classifying, and analyzing REP scholarship.
Approach one: Traditional computational text analysis
Our first approach employed computational text analysis methods (CTAM) across the full corpus of 526 article abstracts. Rather than relying on a fixed keyword search – which risks missing scholarship that engages race without foregrounding it in the abstract – we use text-as-data techniques that treat words as quantitative units for systematic analysis (Grimmer and Stewart Reference Grimmer and Stewart2013). This approach allowed us to identify both surface-level lexical patterns and deeper, underlying topics across the journal’s full publication history, offering a breadth of coverage that a traditional “close read” may miss.
Pre-processing was an essential first step. Steps such as removing encoding errors, standardizing tokens, and addressing incomplete or malformed abstracts were necessary to reduce noise and prevent distortions in results. By establishing a clean and reliable corpus, we were able to move confidently from data preparation to the identification of substantive patterns, allowing the findings to reflect the intellectual development of the field rather than artifacts of the text itself. By tokenizing the abstracts into unigrams, we generated an initial frequency list of 76,033 words for analysis.
While advancements in the field have allowed for the use of text-as-data, this review – and other future REP scholarship – must be careful to maintain a “human in the loop” to avoid mechanical misclassifications. More often than not, programs employ dictionaries that are too blunt for a subject as nuanced as political science, and, most certainly, the study of racial and ethnic politics. Take, for instance, the stemming program in R available in the “SnowballC” package. It attempts to solve the issue of past and present tense agreement, stemming each observation to the most likely root of the word as a token for later aggregation (Schütze, Manning, and Raghavan Reference Schütze, Manning and Raghavan2008). Through this process words like “influence,” “influenced,” and “influences” all become the token “influence.” However, this stemming program, struggles with more complicated words and concepts, which can cause problems when interpreting data.
Recognizing that existing stemming programs often risk oversimplifying the subtle distinctions that matter for research on race and ethnicity, we pursued a mixed strategy. Starting with the original dataframe of all 76,032 tokens, we removed stopwords, punctuation, and numerics. We then proceeded with a supervised lemmatization process. Like stemming, lemmatization reduces surface variation in terms, but instead of chopping off the endings of words, it uses vocabulary and morphology to map each token to its canonical dictionary form. So “legislator” and “legislators” become “legislator,” while “legislation” and “legislative” are maintained as unique terms these can always be collapsed later to fine-tune categorization, but unlike stemming, this approach ensures concept validity.
We then constructed a dictionary of terms common to the discipline but conceptually inconsequential.Footnote 1 This consisted of boilerplate academic language such as “findings” that appear across abstracts regardless of topic. The resulting dictionary was implemented in R as a set of coding rules, ensuring consistency across the full corpus. Following preprocessing, we were left with a final corpus of 33,095 tokens, with 3,889 unique unigrams across all 526 abstracts.
Unigrams
The initial unigram analysis allowed us to identify which terms explicitly relating to racial and ethnic politics occurred most frequently across abstracts. REP-related terms were defined as those referencing racial or ethnic groups, identities, or processes of racialization, as well as terms commonly used in the literature to capture inequality, representation, and political behavior along racial and ethnic lines. Inclusion was determined through contextual review to ensure that terms reflected substantive engagement rather than incidental usage. While the term “minority” appeared most in the corpus (85 mentions, 42 unique abstracts), it is excluded here as the unigram analysis alone cannot reliably distinguish between racial and ethnic minorities and legislative minority parties – precisely the ambiguity that motivates a multi-method approach.
Additionally, while unigram analysis carries inherent ambiguity risk – for example, terms like “white” or “black” could in principle refer to non-racial concepts – spot checks of all abstracts containing these terms confirmed they were used almost exclusively in a racial context.Footnote 2 Several terms were collapsed prior to analysis to ensure conceptually equivalent references were counted together. Specifically, “latino” and “hispanic” are combined into a single Latino/Hispanic category, “black” and “african” are combined into a single Black/African American category – with “african” treated as a reference to African Americans given that the unigram almost exclusively precedes “american” as a bigram in this corpus – and immigration-related terms including “immigration,” “immigrant,” “undocumented,” and “migrant” are combined into a single Immigration/Immigrant category given their conceptual overlap in the state politics literature.
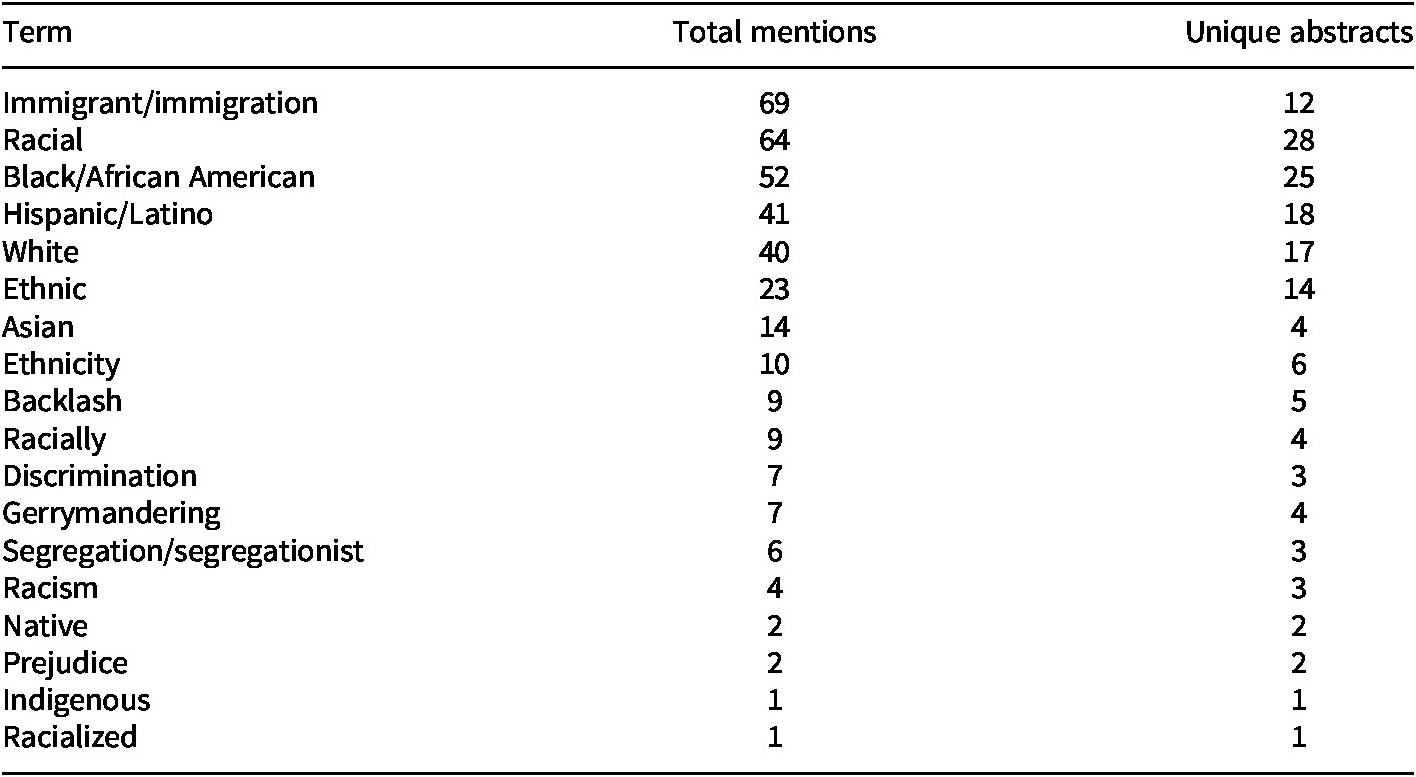
Table 1 presents both the total mentions and unique abstract counts for all race-related terms identified through the unigram analysis of the corpus.
Race-related term frequency in SPPQ abstracts, 2001–2025

Table 1. Long description
The table consists of 18 rows of data categorized by Term, Total mentions, and Unique abstracts.
* Immigrant/immigration: 69 total mentions in 12 unique abstracts.
* Racial: 64 total mentions in 28 unique abstracts.
* Black/African American: 52 total mentions in 25 unique abstracts.
* Hispanic/Latino: 41 total mentions in 18 unique abstracts.
* White: 40 total mentions in 17 unique abstracts.
* Ethnic: 23 total mentions in 14 unique abstracts.
* Asian: 14 total mentions in 4 unique abstracts.
* Ethnicity: 10 total mentions in 6 unique abstracts.
* Backlash: 9 total mentions in 5 unique abstracts.
* Racially: 9 total mentions in 4 unique abstracts.
* Discrimination: 7 total mentions in 3 unique abstracts.
* Gerrymandering: 7 total mentions in 4 unique abstracts.
* Segregation/segregationist: 6 total mentions in 3 unique abstracts.
* Racism: 4 total mentions in 3 unique abstracts.
* Native: 2 total mentions in 2 unique abstracts.
* Prejudice: 2 total mentions in 2 unique abstracts.
* Indigenous: 1 total mention in 1 unique abstract.
* Racialized: 1 total mention in 1 unique abstract.
The most striking finding is the gap between “racial” (64 total mentions, 28 unique abstracts) and “racism” (four mentions, three abstracts), representing a 16-to-1 ratio in total mentions suggesting that while scholars frequently position race as a descriptive or structural category, abstracts rarely frame race in terms of systemic discrimination or structural racism. We return to this point later.
Among group specific terms, “Black/African American” emerges as the most broadly engaged racial group with 52 total mentions across 25 unique abstracts, followed closely by “Latino/Hispanic” (41 mentions, 18 abstracts) and “white” (40 mentions, 17 abstracts). The “Immigration/Immigrant” category, while high in total mentions (69), is concentrated in only 12 unique abstracts, suggesting that immigration scholarship in the journal tends to cluster in focused bursts rather than representing a sustained thread of engagement. Notably, “Asian” appears 14 times but is concentrated in only four abstracts, suggesting focused rather than diffuse engagement with Asian American politics. Most strikingly, “Indigenous” appears in only a single abstract across the journal’s entire 25-year history. While the term “Native” appears in two abstracts, spot checks reveal these instances refer to studies regarding the inclusion of “native language” in education and governmental communication.
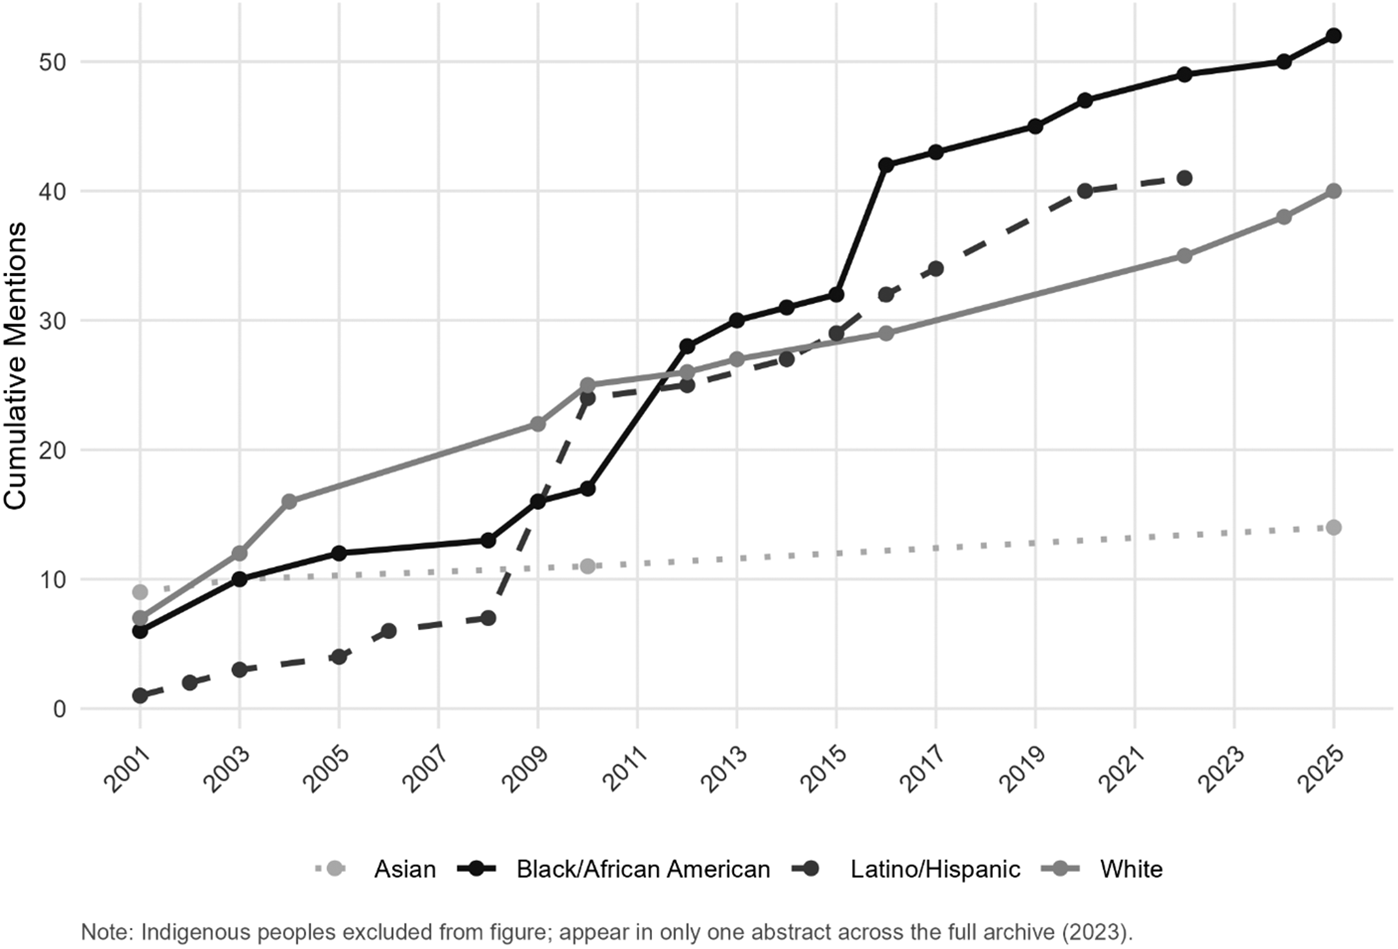
Figure 1 traces cumulative mentions of racial and ethnic group terms across all abstracts from 2001 to 2025, revealing patterns that unigram frequencies alone obscure. Black Americans see their sharpest cumulative increase around 2012, the year President Obama sought reelection, and again around 2016 as the first Black executive exited office. This reveals how national moments drive scholarly attention to race in state politics. Latino mentions rise steeply between 2009 and 2011, tracking the passage of Arizona’s SB1070 – an act which allowed police to racially profile anyone they thought might be in the country illegally – and a wave of other state-level immigration efforts.
Cumulative mentions of racial/ethnic groups in SPPQ abstracts, 2001–2025.

Figure 1. Long description
The X axis represents years from 2001 to 2025 in two-year increments. The Y axis represents Cumulative Mentions from 0 to 50. Four distinct lines track the data.
* Black or African American: Represented by a solid black line with circles. It starts at 6 mentions in 2001, shows a sharp vertical increase between 2015 and 2016, and ends as the highest category with 52 mentions in 2025.
* Latino or Hispanic: Represented by a dashed dark gray line with circles. It starts at 1 mention in 2001, shows a significant jump between 2008 and 2010, and ends at 41 mentions by 2022.
* White: Represented by a solid light gray line with circles. It starts at 7 mentions in 2001 and maintains a steady linear increase throughout the period, ending at 40 mentions in 2025.
* Asian: Represented by a dotted light gray line with circles. It starts at 9 mentions in 2001 and shows the flattest growth of all groups, ending at 14 mentions in 2025.
A note at the bottom states that Indigenous peoples are excluded from the figure as they appear in only one abstract across the full archive in 2023.
Outside of these episodic bursts, growth across minority groups is slow and uneven, while conversely, scholarly engagement with white Americans as a racial group has increased more consistently over the journal’s 25-year history. Asian American mentions, despite an early spike in 2001, flatline almost entirely for the remainder of the archive. Most strikingly, Indigenous peoples do not appear in Figure 1 above at all – their exclusion is not a visualization choice but a reflection of the data itself as only one article in the corpus engaged the population explicitly (DeHart and Mamet Reference DeHart and Mamet2023).
While unigrams provided a useful entry point into the data, they also offer limited insight into how the journal engaged with questions of race. Single-word counts reveal overall frequency patterns, such as the relative prominence of terms like “racial” compared to “racism,” but they strip words from the contexts that give them meaning. As a result, unigrams risk flattening nuance, treating terms as isolated units rather than parts of phrases. With this in mind, we turn to more context-sensitive approach by analyzing bigrams (e.g., “descriptive representation,” “racial diversity”) to identify the contexts in which race appears, assessing whether these bursts reflect sustained or episodic attention.
Bigrams
Bigrams retain phrase-level context, so simple frequency counts offer a useful first pass for mapping how ideas are framed across the corpus. That said, raw frequencies can outweigh a handful of abstracts that repeat the same phrase or reflect boilerplate language. So, we complemented these findings with an exploration of breadth (presence across unique abstracts) to separate concentrated repetition from genuine widespread usage.
We constructed bigrams using the “tidytext” package in R (Silge and Robinson Reference Silge and Robinson2016), which allows tokenization of text into contiguous word pairs. Abstracts were first split into bigrams with the unnest_tokens() function and then preprocessed through a similar mixed-methods approach as employed in unigram analysis. We once again applied a supervised, dictionary-based approach to text analysis, with the automated application of a dictionary of industry-specific bigrams like “findings suggest” and “political scientist.”Footnote 3 This pre-processing resulted in 11,505 unique bigrams for analysis.
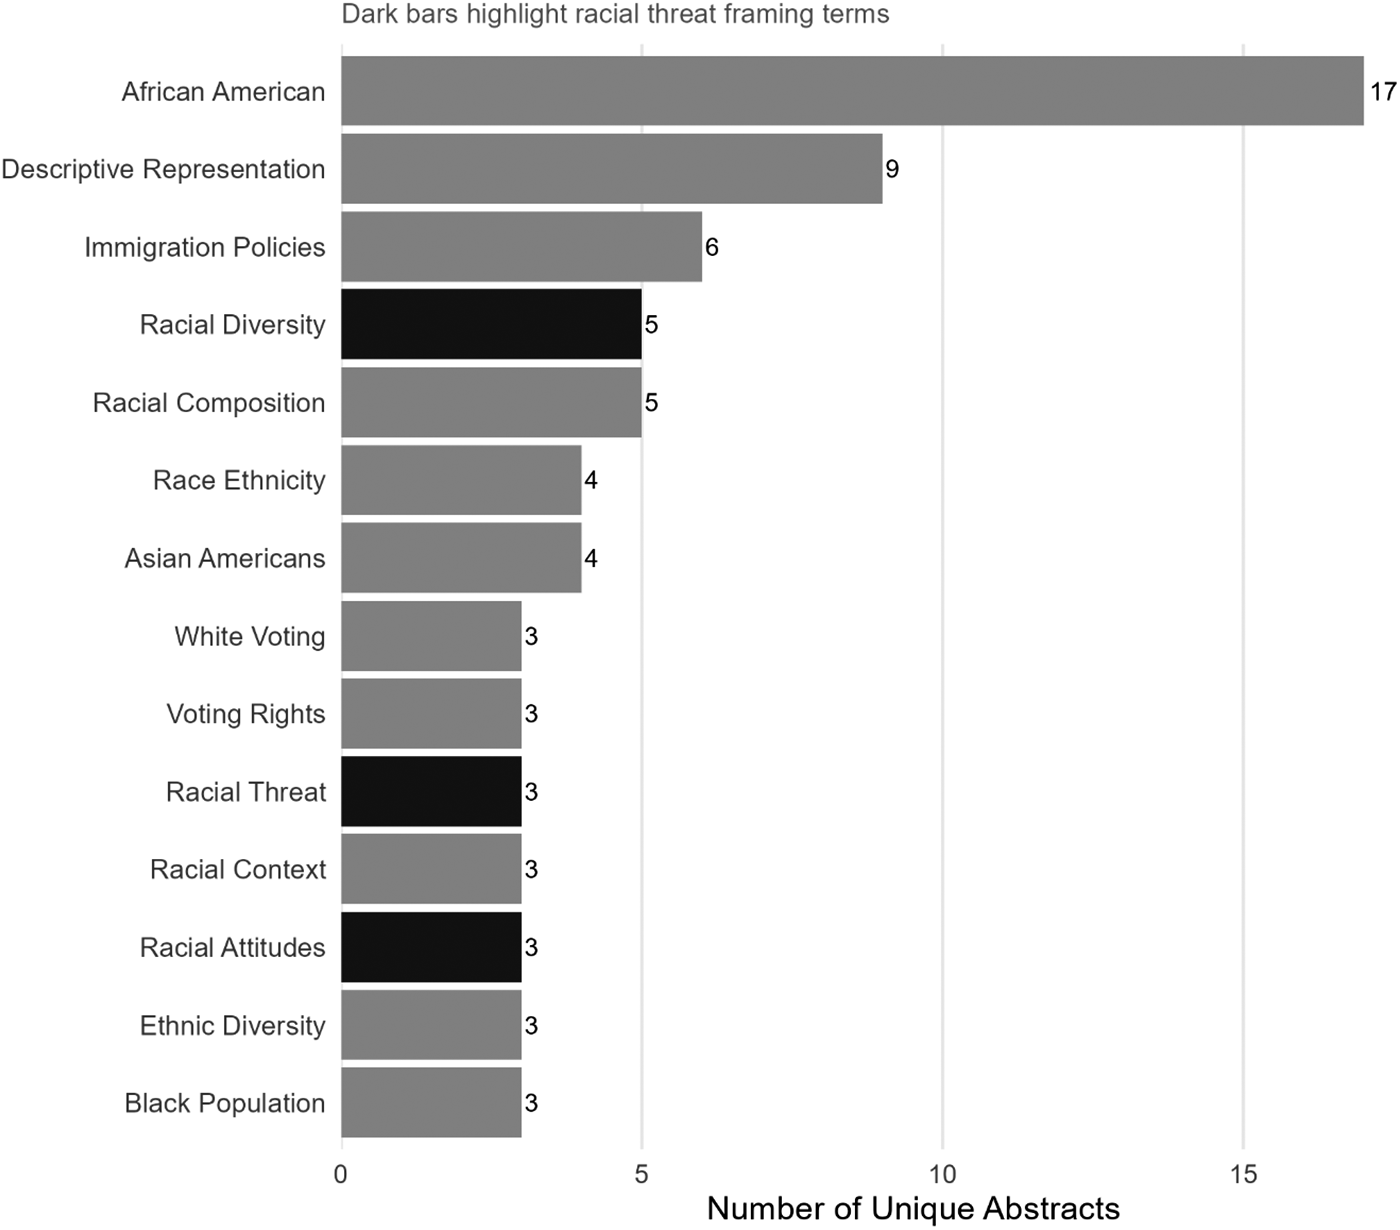
Figure 2 displays the top race-related bigrams by unique abstract coverage. Unlike the unigram analysis, bigrams allow us to distinguish conceptually meaningful phrases from ambiguous single terms – “african american” is unambiguous in a way that “black” alone is not, and “racial threat” captures a theoretical frame that neither “racial” nor “threat” conveys independently. We focus here on bigrams that explicitly reference racial or ethnic groups, theoretical frameworks associated with race, or policy areas with well-established racial dimensions. As with the unigram analysis, terms were collapsed where appropriate. The figure displays counts based on unique abstract coverage rather than total mentions to avoid inflation from a single article that repeats a phrase frequently.
Race-related bigram frequencies in SPPQ abstracts, 2001–2025.

Figure 2. Long description
A horizontal bar chart titled Race-Related Bigram Frequencies in S P P Q Abstracts, 2001-2025. The X-axis is labeled Number of Unique Abstracts with increments at 0, 5, 10, and 15. The Y-axis lists 14 bigrams.
From top to bottom, the frequencies are:
* African American: 17
* Descriptive Representation: 9
* Immigration Policies: 6
* Racial Diversity: 5 (highlighted in black)
* Racial Composition: 5
* Race Ethnicity: 4
* Asian Americans: 4
* White Voting: 3
* Voting Rights: 3
* Racial Threat: 3 (highlighted in black)
* Racial Context: 3
* Racial Attitudes: 3 (highlighted in black)
* Ethnic Diversity: 3
* Black Population: 3
A subtitle notes that dark bars highlight racial threat framing terms, which include Racial Diversity, Racial Threat, and Racial Attitudes.
As shown in Figure 2 “African American” is the most frequently appearing race-related bigram, present in 17 unique abstracts. This confirms the unigram findings that Black American politics is the most visible racial group in the journal’s history.
The term “descriptive representation” appears in nine unique abstracts, suggesting that the journal has meaningfully engaged minority representation as a theoretical concept, though as we show below, this engagement has not been evenly distributed across groups. Next, and perhaps most theoretically significant, the dark-highlighted bars – “racial diversity,” “racial threat,” and “racial attitudes” – cluster together as a set of conflict-oriented framing terms, collectively present in 11 unique abstracts. This pattern suggests that when the journal engages race, it tends to do so through frameworks that position racial diversity as a source of political tension. Finally, “Asian Americans” appears in only four unique abstracts reinforcing the finding that Asian American politics receives limited attention in the journal.
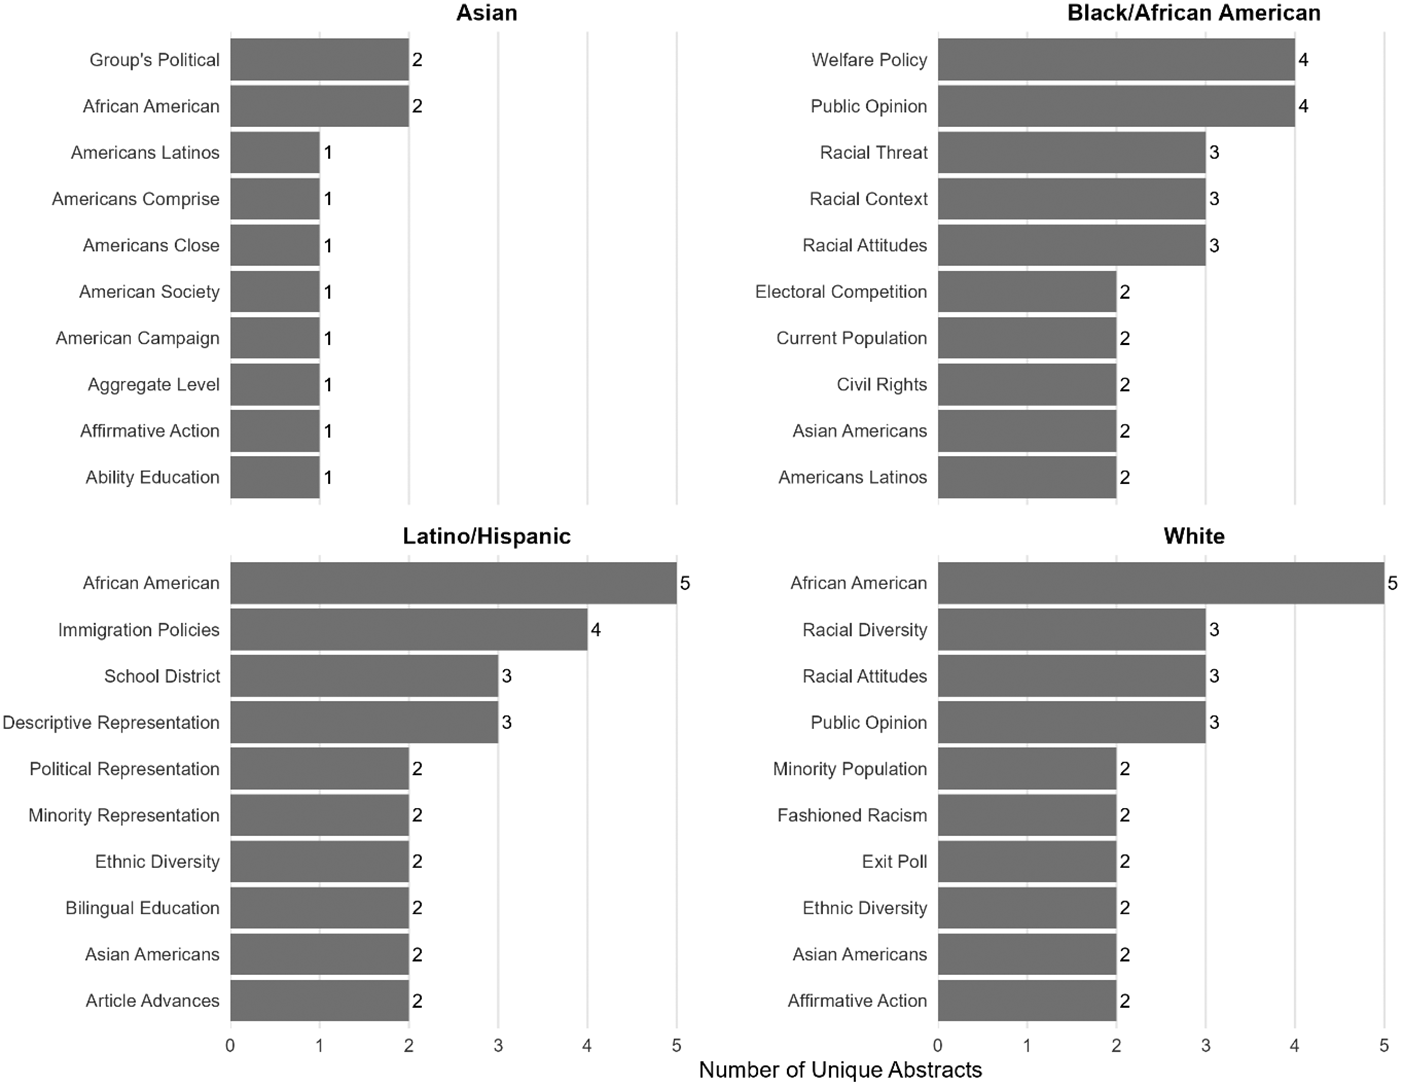
Using breadth-based co-occurrence, thematic neighborhoods around each group diverge clearly. Identity terms are excluded, so the figure highlights surrounding concepts rather than the racial group labels themselves. Figure 3 displays the top thematic bigrams for each racial and ethnic group, revealing starkly different frames through which each group enters the journal’s scholarship. Bars show distinct-abstract counts, not total mentions.
Top thematic bigrams by racial/ethnic group.

Figure 3. Long description
The figure consists of four panels arranged in a two-by-two grid. The X-axis for all panels is labeled Number of Unique Abstracts, ranging from 0 to 5.
Top-Left Panel: Asian group.
- Group’s Political: 2
- African American: 2
- Americans Latinos: 1
- Americans Comprise: 1
- Americans Close: 1
- American Society: 1
- American Campaign: 1
- Aggregate Level: 1
- Affirmative Action: 1
- Ability Education: 1
Top-Right Panel: Black/African American group.
- Welfare Policy: 4
- Public Opinion: 4
- Racial Threat: 3
- Racial Context: 3
- Racial Attitudes: 3
- Electoral Competition: 2
- Current Population: 2
- Civil Rights: 2
- Asian Americans: 2
- Americans Latinos: 2
Bottom-Left Panel: Latino/Hispanic group.
- African American: 5
- Immigration Policies: 4
- School District: 3
- Descriptive Representation: 3
- Political Representation: 2
- Minority Representation: 2
- Ethnic Diversity: 2
- Bilingual Education: 2
- Asian Americans: 2
- Article Advances: 2
Bottom-Right Panel: White group.
- African American: 5
- Racial Diversity: 3
- Racial Attitudes: 3
- Public Opinion: 3
- Minority Population: 2
- Fashioned Racism: 2
- Exit Poll: 2
- Ethnic Diversity: 2
- Asian Americans: 2
- Affirmative Action: 2
For Black/African American politics, the dominant themes cluster around welfare policy and public opinion (four mentions each), alongside a set of racially framed attitudinal terms – “racial threat,” “racial context,” and “racial attitudes” (three each) – suggesting that Black politics in SPPQ is engaged primarily through questions of policy attitudes and racialized public opinion rather than institutional or officeholding dynamics. Importantly, when we look at other racial groups, the bigram “African American” is among the top terms for Latinos (5), White Americans (5), and Asian Americans (2). In other words, Black Americans seem to be the reference racial group in many studies. These bigrams do not allow us to ascertain whether Black people are being discussed positively, negatively, or neutrally, but regardless of how the group is discussed, a clear pattern emerges: studies of non-Black people commonly discuss Black people.
For Latino/Hispanic politics, “immigration policy” remains the most prominent theme (four mentions), consistent with the post-2010 wave of enforcement scholarship, while “school district” and “descriptive representation” (three each) point to a parallel thread engaging education governance and representation. “Political representation,” “minority representation,” “ethnic diversity,” and “bilingual education” (two each) round out a broader, more diffuse set of themes than the Black/African American panel.
The white thematic neighborhood remains dominated by attitudinal frames – “racial diversity,” “racial attitudes,” and “public opinion” (three each) – alongside a secondary cluster of electoral and policy terms: “minority voters,” “minority population,” “exit poll,” “ethnic diversity,” and “affirmative action” (two each). As before, white Americans in SPPQ are studied primarily as attitude-holders and electoral actors rather than as a racial group whose own political interests and identities shape governance; the absence of any representation or civic-incorporation frame in the white panel stands in continued contrast to the Latino panel.
Finally, the Asian American panel remains notable for what it reveals about the limits of the corpus itself. With no bigram exceeding two mentions and all but one term appearing only once, the thematic neighborhood around Asian American politics is even more shallow and diffuse than a broader analysis might suggest.
Taken together, the findings from the CTAM approach reveal that while race appears across the SPPQ corpus in identifiable and patterned ways, its presence is uneven, episodic, and often embedded within broader analyses rather than treated as a central object of inquiry. Importantly, these approaches cannot reliably distinguish between articles that meaningfully engage REP topics and those in which race appears only incidentally. These limitations motivate our second approach to corpus identification, which seeks to systematically differentiate between primary and secondary engagement with REP across all articles.
Approach two: AI assisted classification
While computational text analysis reveals broad patterns across the full archive, it lacks the capacity to distinguish between substantive and incidental engagement with racial and ethnic politics. To address this, our second approach to corpus identification employed a large language model (LLM) classifier to assess systematically each abstract and assign one of three labels: 0 (no meaningful engagement with race or ethnicity), 1 (race or ethnicity is present but secondary – for example, as a control variable or contextual factor), or 2 (racial and ethnic politics is a primary focus).
We use Anthropic’s Claude Haiko model, accessed via API, to classify all 526 abstracts with available text. Each abstract was submitted individually with a detailed prompt, specifying the classification criteria, including concrete examples of what qualifies as primary versus secondary engagement and an explicit instruction to distinguish racial and ethnic minorities from legislative minority parties – the ambiguity identified in the unigram analysis.Footnote 4 Classifications were generated programmatically in R using the “httr2” package, with results saved incrementally to ensure reproducibility.
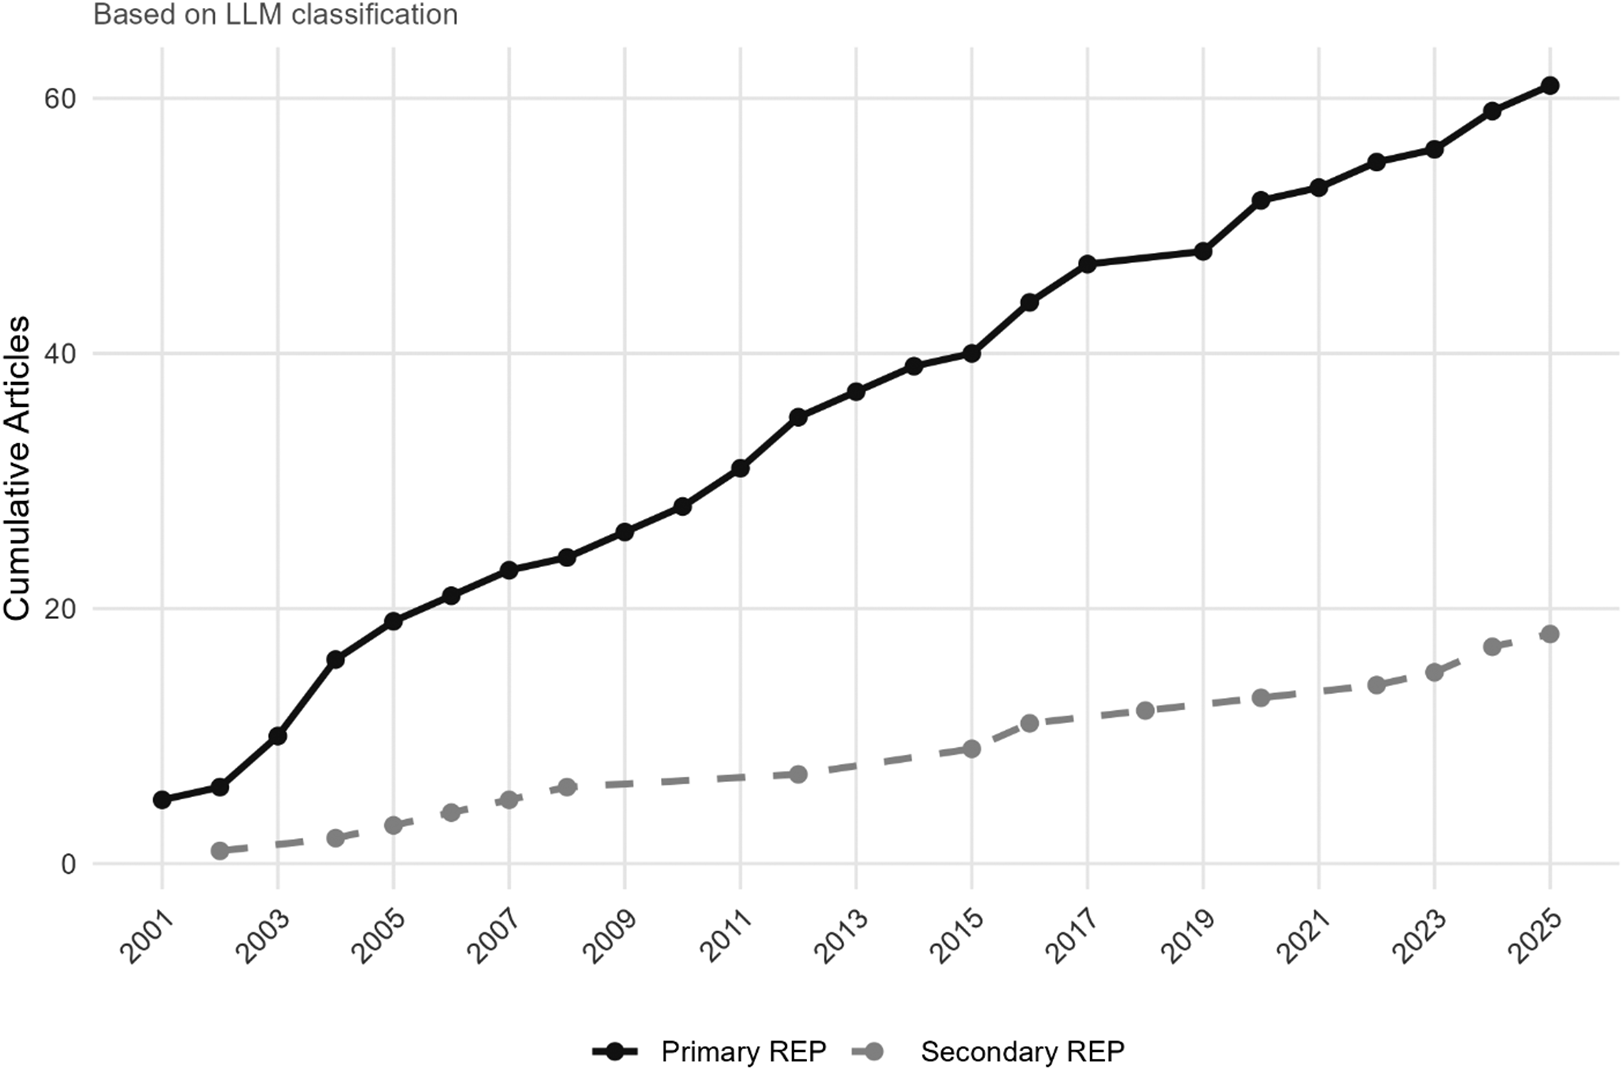
Of the 526 abstracts successfully classified by the model 79 articles (15% of total articles published by SPPQ 2001–2025) were found to engage with racial and ethnic politics. Sixty-one articles (11.6%) were identified as primary REP scholarship (label 2), 18 articles (3.4%) were identified as engaging race secondarily (label 1), and 447 articles (85%) showed no meaningful engagement with racial or ethnic politics (label 0). Figure 4 displays the cumulative growth of primary and secondary REP articles over the journal’s 25 year history, as identified through the LLM classification.
Cumulative REP articles in SPPQ.

Figure 4. Long description
The graph plots Cumulative Articles on the Y-axis, ranging from 0 to 60 in increments of 20, against years on the X-axis from 2001 to 2025.
Two data series are presented:
* Primary R E P: Represented by a solid black line with circular markers. It shows a strong upward trend, starting at approximately 5 articles in 2001, rising sharply to 20 by 2005, and continuing a steady linear increase to reach just over 60 articles by 2025.
* Secondary R E P: Represented by a dashed grey line with circular markers. This series shows a much slower growth rate, starting near 0 in 2002 and reaching approximately 18 articles by 2025.
The gap between the two series widens significantly over time, indicating that Primary R E P articles are being published at a higher frequency than Secondary R E P articles within the S P P Q journal.
The pattern mirrors what the CTAM analysis suggested; engagement with REP has been uneven and episodic rather than sustained. Primary REP scholarship grows in visible steps rather than at a steady pace, with notable acceleration between 2009 and 2013, and again from 2015–2017 tracking the same national moments identified in the CTAM analysis. The gap between the primary and secondary lines is also telling. Secondary engagement, where race appears but is not the focal point, has grown slowly but consistently, suggesting that race has become a more routine control variable over time without a corresponding increase in scholarship that centers it.
A comparison of bigram frequencies between primary and secondary REP articles identified by the model highlights a clear conceptual distinction. Articles in the primary category are characterized by phrases such as “African American(s)” (25 instances), “bilingual education” (17), “immigration policy” (15), and “descriptive representation” (10), reflecting direct engagement with race as a central analytic focus. By contrast, articles classified as secondary are dominated by phrases such as “hate crime” (7), “income inequality” (6), and “law enforcement” (5), indicating that race is more often incorporated into broader models of political behavior and policy analysis rather than theorized as a primary driver of state politics and policy.
This distinction reinforces a central finding of this review. While race appears with increasing frequency across the SPPQ archive, it is far less often treated as a core object of inquiry. When race is centered, scholarship engages with questions of representation, inequality and institutional design. When it is not, it is more likely to function as a contextual or control variable within otherwise general models of state politics.
LDA topic model
To move from corpus identification to thematic analysis, we employed Latent Dirichlet Allocation (LDA), a generative probabilistic model that identifies latent topics across a collection of documents by grouping words that tend to co-occur (Blei, Ng, and Jordan Reference Blei, Ng and Jordan2003). LDA was applied to the 79 abstracts classified as either primary or secondary REP scholarship, treating each abstract as a document and each document as a mixture of underlying topics. Rather than imposing predetermined categories, LDA topic models allow the thematic structure of the corpus to emerge inductively from the language scholars used to describe their own work.
Prior to model estimation, we removed sparse terms from the document-term matrix, retaining only words that appeared in at least 5% of documents. This step is standard practice in LDA applications to small corpora, where an unpruned vocabulary of rare, idiosyncratic terms can dominate topic estimation without contributing to genuine thematic coherence (Grimmer and Stewart Reference Grimmer and Stewart2013). For a corpus of this size (79 abstracts), pruning also improves the ratio of documents to vocabulary size, allowing the model to identify more stable and interpretable topics.
Model selection followed standard practice. We estimated models across a range of k values and evaluated interpretability to identify the solution that best balanced coherence with coverage given the relatively modest corpus size of 79 REP-identified abstracts A five-topic solution proved optimal. The resulting topics – Race and Redistribution; Racial Inequality and Institutional Constraint; Legislative Reform and Party Politics; Racial Electoral Behavior; and Immigration, Race and Electoral Politics – closely mirror the results from earlier CTAM analysis and the theoretical terrain that REP scholars have mapped over the past quarter century.
Three topics – Racial Inequality and Institutional Constraint; Immigration, Race and Electoral Politics; and Race and Redistribution – reflect the densest coverage across the primary corpus and represent clear theoretical frames for understanding how race structures state policy. These computationally derived themes do not merely confirm what a close read might have produced; instead, they validate and extend it. The results of the LDA topic model applied to the abstracts identified by the AI-assisted classified primary articles provide the empirical basis for the thematic deep dive that follows.
Approach three: Thematic analysis of primary REP scholarship
The topics identified through LDA do not simply organize the corpus, instead, they reveal the intellectual priorities that have shaped REP scholarship over a quarter century. Three clusters stand out for both their density and their theoretical significance. The first centers on majoritarian institutions, primarily ballot initiatives and referenda. The second features scholarship primarily focused on welfare, redistribution, and the racialization of social policy. The third encompasses education governance and the politics of representation. Together, these themes account for the largest share of primary REP scholarship in the journal and reflect longstanding debates in the subfield about how race structures access to public goods and political voice in the American states.
The analysis that follows employs a more traditional “close read” of the articles falling within these clusters. Rather than cataloguing findings in isolation, we read this scholarship as a cumulative body of work – tracing how arguments have built on one another, where consensus has emerged, and where important tensions remain unresolved.
Before discussing these topics, we want to note two things. First, the REP-identified articles in the corpus are characterized by methodological sophistication. In the early days, studies pioneered the use of ecological inference (EI), while recent editions have explored the use of two-way fixed effects models. Studies across the corpus have also employed error correction models and pooled cross-sectional time series models, with the latter taking advantage of the comparisons that can be made when studying states over time (see Stimson Reference Stimson1985). The methods have varied over time, but what remains constant is they are cutting edge.
Moreover, articles are characterized by theoretical clarity, commonly showing a nuanced understanding of the way race structures politics. Take, for instance, Ojeda et al. (Reference Ojeda, Whitesell, Berkman and Plutzer2019). The article finds where Black people comprise a larger share of Temporary Assistance for Needy Families (TANF) recipients time limits are more restrictive, yet these same states also have more flexible work requirements. Both findings are rooted in negative stereotypes of Black people. That is, because Black people are stereotyped as overly dependent on the government, states shorten how long people can receive benefits to encourage self-sufficiency. Moreover, because Black people are stereotyped as lazy, the best way to ensure states meet work requirement rules is to have more flexible work requirements. This study exemplifies the nuanced way race is analyzed in the journal.
Race and redistribution
Taken together, the literature on race and redistribution in politics reveals a consistent, but complicated, relationship between racial composition and policy outcomes. Racial diversity is associated with both expanded and contracted policy choices, and in some cases its effect is dependent on factors such as partisan control or economic conditions.
To make sense of this variation, literature in this theme can be organized into three camps. One camp examines the independent effect that race has on state politics and policy, while another camp examines how race – in conjunction with another variable – shapes state politics and policy. There is a third camp that examines race and majoritarian institutions (e.g. initiative process). These studies commonly engage with racial threat (Key Reference Key1949) and/or racial diversity (Hero Reference Hero1998), which together can be understood as studying the political consequences of places having sizable racial and ethnic minority populations. In addition, many studies examine social welfare programs, specifically TANF, or what was previously Aid to Families with Dependent Children (AFDC). Unless specified otherwise, welfare refers to TANF or AFDC.
Among the studies in the first camp – examining the independent effect that race has on state politics and policy – racial diversity is shown to have both negative and positive consequences. Racially diverse states have less generous welfare programs (Johnson Reference Johnson2001; Larimer Reference Larimer2005; Terry Reference Terry2016), devote less effort to Supplemental Security Income programs (Barrileaux and Bernick Reference Barrileaux and Bernick2003), and having a higher nonwhite caseload is tied to more severe sanctions (Kim and Fording Reference Kim and Fording2010). Studies of punitive policies find that greater racial diversity is associated with fewer rehabilitative programs for prisoners (Percival Reference Percival2009), having a larger Latino population in one’s district leads to Republicans being more supportive of anti-immigration policy (Avery and Fine Reference Avery and Fine2020), and states with rapidly growing Latino populations were more likely to enact punitive immigration policies (Ybarra, Sanchez, and Sanchez Reference Ybarra, Sanchez and Sanchez2016). That said, in racially diverse states, more effort is devoted to General Assistance programs, having a higher nonwhite caseload is positively related to job retention rates (Kim and Fording Reference Kim and Fording2010), and states with a higher foreign born population have Medicaid policies that are more inclusive of immigrants (Filindra Reference Filindra2013).
Studies in the second camp – exploring how race in conjunction with other variables impact politics and policy – illustrate the complex way race shapes inequality in states. Some articles ultimately point to the positive consequences of increased racial diversity, whereas others point to the negative consequences of increased racial diversity. Although increased Black turnout is associated with less generous welfare policy, this relationship is mitigated in states where Blacks comprise a larger share of the electorate (Krueger and Mueller Reference Krueger and Mueller2001). Zingher (Reference Zingher2014) finds that in Republican controlled legislatures, as the Latino voting power increases there is a decreased chance of immigration enforcement bills being adopted, due to fear of Latino backlash. Zhu and Clark (Reference Zhu and Clark2015) find that Democratic controlled legislatures in racially diverse states have more equal health care outcomes than Democratic controlled legislatures in racially homogenous states. Together, these articles point to the impact of race of inequality being conditional on partisanship.
Karch and Cravens (Reference Karch and Cravens2014) find that states with larger Black populations and that are politically conservative were more likely to adopt Three Strikes laws. Hawes (Reference Hawes2017), building on Hero (Reference Hero2007), finds that in places that are more racially diverse, increases in social capital led to greater inequality in Black/white incarceration rates. Wager (Reference Wager2024) finds in places where income inequality is higher and that are more racially diverse, the public is less likely to demand a bigger government. In sum, these studies point to increased racial diversity as leading to harsher criminal justice policy, greater racial inequality, and less willingness to address income inequality.
Within this second camp, Xu (Reference Xu2017) stands alone, as it considers how two independent variables, namely labor market conditions and the inclusivity of welfare programs, interact with race to shape welfare policy. An increase in immigration decreases welfare spending in places with a good job market and an inclusive welfare immigrant policy, consistent with the racial threat hypothesis. However, an increase in immigration increases welfare spending in places with a poor job market and an exclusive welfare immigrant policy, consistent with globalization competition theory. All told, this paper demonstrates that inequality and welfare generosity are shaped by a complex interplay where racialized demographic changes can either expand or contract the social safety net, depending on whether the immigrant population is viewed as a competitor for resources or a reason for the state to provide economic security to its native-born citizens.
The third camp considers race and majoritarian institutions, paying particular attention to the initiative process. Ballot measures dealing with race/ethnicity are part and parcel of state politics, and they play an outsized role in California, making it unsurprising that two separate articles focus on the Golden State. White support for Proposition 209, a measure that would end statewide affirmative action, was higher in places with more racially diverse populations (Tolbert and Grummel Reference Tolbert and Grummel2003). Another study of Proposition 209 found not only that white Californians were more supportive of the measure, but also that it was due to racial attitudes, not economic anxiety (see Alvarez and Bedolla Reference Alvarez and Bedolla2004). Looking at data from 1995 to 2004, Lewis (Reference Lewis2011) finds that anti-minority proposals have a higher passage in direct democracy states, and though the focus is on LBGTQ+ issues, some measures target racial and ethnic minorities.
Pacheco and LaCombe (Reference Pacheco and LaCombe2025) illustrate how race is key to understanding how majoritarian institutions influence inequality. First, they show clearly that the stronger these majoritarian institutions, the more inequality exists between Blacks and whites in terms of health (life expectancy), income (the poverty rate), and education (the attainment of a high school degree). Next, they show that in places that are racially diverse and where strong majoritarian institutions exist, Black/white disparities in life expectancy are greater than in places that are racially homogenous with strong majoritarian institutions. Together, these studies provide reason for concern that direct democracy can lead to the trampling of minority rights (see Gamble Reference Gamble1997).
Across the three approaches, a consistent pattern emerges. Race structures redistribution in the states in ways that are contingent rather than uniform. Racial diversity can lead to more punitive policies, reduced welfare generosity, and greater inequality, but these effects are mediated by institutional arrangements, partisan control, and economic context. In this sense, race does not operate as a singular force in state politics, but as a conditional one, shaping policy outcomes through its interaction with broader political and economic structures.
Race and education
Many studies in the journal examine race and education, and similarly to the above, their theoretical framings can be placed in two different categories. The first category is narrower and engages with education as a measure of Latino substantive representation (Pitkin Reference Pitkin1967). Although people of all racial groups benefit from education, Rouse (Reference Rouse2013) shows that education can be understood to be a Latino interest, a finding mirrored in education-based REP articles across the corpus. The second category examines race and education more broadly, and each study concerns elections in some shape or form.
Among the set of studies looking at education as a measure of Latino substantive representation, a complex picture emerges. Some find a positive relationship between Latino descriptive representation and Latino substantive representation (Ross, Rouse, and Bratton Reference Ross, Rouse and Bratton2010), others find a negative relationship (Robinson Reference Robinson2002), whereas Preuhs (Reference Preuhs2005) finds it is conditional on the presence of the initiative process. Perhaps surprisingly, a ballot measure that weakened bilingual programs ultimately improved the academic performance of students required to take classes in English (Bali Reference Bali2001), showing that direct democracy does not always harm racial and ethnic minorities. Using a field experiment in which legislators were asked to fill out a survey in exchange for a donation being made to a college scholarship, Landgrave (Reference Landgrave2020) finds that when Latinos are beneficiaries, the click rate is lower; however, when legislators are informed their actions will be made public, their click rate is higher, even if Latinos are the beneficiaries of the scholarship.
Race, education, and elections have also been shown to interact with one another in meaningful ways across the corpus. Wolfinger, Highton, and Mullin (Reference Wolfinger, Highton and Mullin2005) examine how post-registration laws affect voter turnout, finding that even though voter convenience laws increase the turnout of all racial groups, Latinos benefit more than Blacks or whites, with an explanation being that groups with lower levels of educational attainment (such as Latinos) especially benefit from lowering the cost of voting. A later study finds that Latino state legislators are more likely to get elected in areas with a higher concentration of educated people (Preuhs and Juenke Reference Preuhs and Juenke2011); one can think of educational attainment as a proxy for tolerant (racial) attitudes.
Two other studies that examine the interplay of race, education, and elections focus on schools. Voss and Miller (Reference Voss and Miller2001) find that contrary to the racial threat hypothesis, white voters residing in places with larger Black populations were more supportive of a school desegregation measure in Kentucky. Shah, Weinschenk, and Yiannis (Reference Shah, Weinschenk and Yiannis2024) analyze school board elections in Wisconsin in 2022. They pay particular attention to the incidence of conflict elections, and a criterion is whether a candidate campaigned on Critical Race Theory. The authors find that in places where the white population shrank the most, there was a greater chance that a conflict candidate won, with this outcome being driven by a fear of whites losing political influence.
Concluding thoughts
In conclusion, our findings prove to be as nuanced and complex as the subject under review. Computational analysis surfaces broader patterns across the corpus while the close read of articles shows that at times, increased racial diversity leads to more generous/liberal policy, whereas in other instances it leads to less generous/conservative policy. In some cases, it exercises an independent effect, but at other times its effect is conditional on some other variable.
Twenty-five years of scholarship in State Politics & Policy Quarterly reveals a pattern that is both impressive and deeply uneven. Over time, it has become more common for scholars to engage with race, even if it was not a focal point of studies, which shows scholars understand that race plays an important role in shaping state politics and policy. Moreover, attention to racial and ethnic politics spikes in moments where race was particularly salient, including the elections of President Obama and the passage of restrictive immigration laws. This second point is evidence that the journal engages with contemporary issues, which is a strength.
However, there is still room for improvement. A top bigram for Black Americans was welfare policy, despite people of all racial backgrounds receiving welfare benefits. A similar point could be made for Latinos, who are linked to immigration despite people of all racial backgrounds living as immigrants in the US. Asian Americans are studied sporadically, and Indigenous peoples scarcely at all, so more research could center these two groups. Research tends to focus on the political attitudes of White Americans and Black Americans, which does not properly reflect the growing racial diversity occurring across the American states.
Moreover, terms like racial appear steadily across abstracts, but explicit engagement with racism is rare. Race is most often deployed descriptively, as a demographic variable, a control, or a contextual factor, rather than analyzed as a system of power. These findings reveal that while we are increasingly willing to talk about race, we are not yet as comfortable talking about racism.
We find it helpful to close this review by quoting Jamila Michener, a scholar who is a leader in the section and whose work won the Virginia Gray Book Award. In a co-authored piece with Tiffany Ford, Michener writes:
Shifting from treating “race” as a demographic category correlated with disparities to centering on racism as a set of processes that creates disparities, moves us beyond the (still important) task of chronicling inequity and toward the vital work of identifying the structural changes necessary to erode and eradicate it (Reference Michener and Ford2023, 355).
We would all do well to heed Michener’s advice.
There are intentional steps SPPQ can take to address some of the concerns raised in this review essay. One recommendation is to create a dedicated REP editor. This individual could leverage existing networks to increase submissions on studies centering racial and ethnic politics and could offer dedicated expertise in recommending reviewers.Footnote 5 A secondary recommendation is SPPQ commit to publishing a special issue focusing on racial and ethnic politics in the states, perhaps with a priority of seeking out submissions from junior scholars, perhaps partnering with the REP section of APSA or with NCOBPS in this endeavor.
We in no way intend to discount the ground-breaking contributions SPPQ has facilitated over the course of its illustrious history. Instead, we implore the section to follow in the footsteps of the founders and not rest on our accomplishments as enough. We can do better, we must do better. As we face a political environment that is increasingly hostile to the study of racial and ethnic politics, it is imperative the section not only begin the difficult work of intentionally asking and answering the hard questions related to race and the American states, but to also explicitly reaffirm a sincere commitment to fostering the support of those who dedicate their careers to this vital work. Providing scaffolding for these scholars, senior and junior, is essential, especially now when it may prove so much easier and safer to do otherwise.
We want to end on a hopeful note. The future of the section is in our collective hands. We can make different choices, and these choices will not only change the nature of scholarship, but also have the added benefit of advancing the careers of the scholars producing work that centers race and ethnicity. As we look towards the next 25 years of SPPQ, we look forward to reading innovative, timely, and first-rate scholarship that points to the ways in which race and racism shape state politics and policy.
Data availability statement
Replication materials are available on SPPQ Dataverse at https://doi.org/10.7910/DVN/2MEGEC (Blackwood et al. Reference Blackwood, Clark and Buehring2026).
Funding statement
The authors received no financial support for the research, authorship, and/or publication of this article.
Competing interests
The authors declared no potential conflicts of interest with respect to the research, authorship, and/or publication of this article.
Appendix A: Industry terms excluded in unigram and bigram analysis
Industry terms removed (unigrams)

Table A1. Long description
The table consists of three columns: Category, Terms removed (unigrams; case-insensitive, lemmatized where applicable), and Rationale.
* Row 1: Category is Publishing/structure. Terms include abstract, introduction, background, literature, related, conclusion, discussion, appendix, figure, table, section, footnote, reference, citation, and page. Rationale: Formatting/structure words that do not convey topical content.
* Row 2: Category is Article/field boilerplate. Terms include article, paper, manuscript, study, research, scholarship, contribution, inquiry, analysis, overview, review, framework, approach, and perspective. Rationale: Generic academic nouns that inflate frequency without signal.
* Row 3: Category is Methods/process. Terms include method, methodology, design, data, dataset, measure, measurement, variable, coding, codebook, validity, reliability, robustness, replication, appendix, sample, and sampling. Rationale: Process terminology rather than topic.
* Row 4: Category is Modeling/stats. Terms include model, modeling, estimate, coefficient, regression, logistic, linear, inference, hypothesis, test, significance, parameter, error, residual, likelihood, and bayesian. Rationale: Statistical vocabulary common across studies.
* Row 5: Category is Results/claim verbs. Terms include examine, explore, investigate, analyze, show, demonstrate, find, provide, present, discuss, suggest, argue, reveal, report, consider, evaluate, and assess. Rationale: Boilerplate verbs describing research acts.
* Row 6: Category is Scope/generic nouns. Terms include effect, impact, implication, relationship, association, variation, pattern, trend, factor, dimension, context, case, evidence, result, and outcome. Rationale: Broad nouns with weak topical specificity.
Industry terms removed (bigrams)

Table A2. Long description
The table consists of seven rows across three columns.
* Row 1: Category is Article/field boilerplate. Terms removed include article analyzes, article examines, article explores, future research, political scientists, politics research, study examines, and unique opportunity. Rationale: Boilerplate wording about what the article does; not topical.
* Row 2: Category is Literature/meta. Terms removed include existing literature, previous research, previous studies, recent research, and recent studies. Rationale: References to prior literature rather than subject matter.
* Row 3: Category is Data/design. Terms removed include data set, dependent variable, level data, level factors, missing data, original data, original dataset, and paired comparison. Rationale: Data descriptors and design terms.
* Row 4: Category is Modeling/stats. Terms removed include cross sectional, event history, history analysis, information theory, multilevel regression, pooled cross, poststratification m r p, regression analysis, sectional data, sectional time, series analysis, series cross, standard errors, statistically significant, synthetic control, and time series. Rationale: Statistical or estimation phrases common across studies.
* Row 5: Category is Results/claim phrases. Terms removed include analysis suggests, evidence suggests, findings suggest, provide evidence, results demonstrate, results provide, results suggest, and strong evidence. Rationale: Generic interpretive claims that add little topical signal.
* Row 6: Category is Scope/time phrases. Terms removed include construct validity, recent decades, short term, and survey experiment. Rationale: Time/scope qualifiers that are not topic specific.
* Row 7: Category is Other/general. Terms removed include empirical evidence. Rationale: Residual boilerplate phrases not otherwise categorized.
Appendix B: LLM prompt
“You are a political science research assistant classifying articles from State Politics and Policy Quarterly (SPPQ), a journal focused on US state politics Classify the article using one of three labels”:
“Label 2 – PRIMARY: Racial or ethnic politics is a central focus. Examples from this journal include:
-
- Minority descriptive or substantive representation (e.g., Black, Latino, Asian American legislators, school boards, judges).
-
- Racial attitudes, racial resentment, or white backlash as a key explanatory variable.
-
- Minority group voting behavior or turnout (e.g., Black turnout, Latino mobilization).
-
- Policies explicitly framed around race/ethnicity: affirmative action, desegregation, majority-minority districts, bilingual education, English-only laws, Voting Rights Act.
-
- Immigration policy where race or ethnicity is explicitly part of the political analysis.
-
- Racial threat hypothesis or racial diversity as a primary explanatory variable.
-
- Welfare, criminal justice, or education policy where racial politics is the explicit analytical frame (not just a control).
-
- Redistricting with explicit focus on minority representation.
-
- Discrimination audits or studies of racial bias in government responsiveness.”
“Label 1 – SECONDARY: Race or ethnicity is present but not the central focus. Examples include:
-
- Race or ethnicity included as one demographic control variable among several others.
-
- Racial composition of a state mentioned as a contextual factor.
-
- Women’s representation studies that mention race/ethnicity as a secondary dimension.
-
- Voter ID or election administration studies that mention minority turnout as one concern among several,
-
- Immigration policy studied primarily through an ideological or partisan lens with race mentioned incidentally.”
“Label 0 – NONE: No meaningful mention of race or ethnicity.”
“IMPORTANT: Articles about ‘minority party’ in the legislative sense (e.g., Republican minority in a chamber) should NOT be coded as racial/ethnic politics. Look for racial/ethnic minority groups, not legislative minorities.\n\n”
Author biographies
Megan Blackwood completed her doctoral studies at the University of North Carolina in 2026 under the advisement of Frank R. Baumgartner. Her work focuses on Administrative Representation and the provision of constituent services.
Christopher Clark is Associate Professor of Political Science at the University of North Carolina at Chapel Hill. His work focuses on minority representation in the United States.
Gavin Buehring is a PhD student at the University of North Carolina at Chapel Hill. He studies political behavior and American politics.