Introduction
Athetis lepigone (Möschler) (Lepidoptera: Noctuidae) is an important pest in many European countries, east-central parts of Russia, Japan, North Korea, and Mongolia (Chen et al., Reference Chen, Ahmed, Liu, He and Wang2014; Fu et al., Reference Fu, Liu, Li, Ali and Wu2014). This pest can feed on more than 30 species of host plants, and prefers maize (Li et al., Reference Li, Zhu, Ma, Li and Dong2013). In China, A. lepigone was documented for the first time in Liaoning province in 1999, but was not designated as a crop pest (Chen, Reference Chen1999), until 2005, when serious damage caused by A. lepigone in maize fields attracted peoples’ attention to this pest (Jiang et al., Reference Jiang, Li, Xu, Li, Zhang and Xu2008). Since then, outbreaks of this pest have been reported in seven other provinces of China, and have resulted in a damage of about 2.2 million ha (Wang et al., Reference Wang, Shi and Dong2012, Reference Wang, Yu, Zhao, Zhang, Zhao, Zhuang, Men and Li2013).
Understanding the process of outbreak spread has important implications for pest management. It can guide management strategies, such as by predicting the spread of genes associated with insecticide resistance (Endersby et al., Reference Endersby, Mckechnie, Ridland and Weeks2006; Kobayashi et al., Reference Kobayashi, Sakurai, Sakakibara and Watanabe2011), determining regional boundaries of the control program (Porretta et al., Reference Porretta, Canestrelli, Bellini, Celli and Urbanelli2007), and facilitating implementation of strategies to prevent further damage (Kim et al., Reference Kim, Cano-Rios and Sappington2006). However, the cause and process of the A. lepigone outbreak have been unclear in China; it is still unclear whether the emergence and spread of the outbreak of this pest are triggered by rapid in situ population size increases in each outbreak area, or by immigrants from a potential source area. In recent years, the wheat straw was returned to instead of being removed from the field after the winter wheat harvest. This agricultural practice change probably created wet habitats which appear to be optimal for A. lepigone larval survival and adult reproduction (Jiang et al., Reference Jiang, Li, Xu, Li, Zhang and Xu2008; Chen et al., Reference Chen, Ahmed, Liu, He and Wang2014). Therefore, some researchers suspected that the outbreak was caused by a rapid increase in local resident population size (Jiang et al., Reference Jiang, Luo, Jiang, Zhang, Zhang and Wang2011). An alternative view is that the outbreak was migration-induced. The quickly expanded outbreak from Hebei Province to other six provinces (Shandong, Henan, Anhui, Jiangsu, Shanxi, and Beijing) leaded people to consider that immigrants from a potential source area may be the main cause of the outbreak. Searchlight trapping on a Chinese island also provided direct evidence of the long-distance migration ability of this pest, which supported the idea of migration-induced outbreaks (Fu et al., Reference Fu, Liu, Li, Ali and Wu2014).
In recent years, advances have made population genetics a powerful approach for tracing outbreak origins and processes of agricultural pests (Loxdalel & Lushai, Reference Loxdalel, Lushai, Woiwod, Reynolds and Thomas2001; Kobayashi et al., Reference Kobayashi, Sakurai, Sakakibara and Watanabe2011; Gayathri Samarasekera et al., Reference Gayathri Samarasekera, Bartell, Lindgren, Cooke, Davis, James, Coltman, Mock and Murray2012; Yang et al., Reference Yang, Sun, Xue, Li and Hong2012). However, population genetics studies on this pest are scarce, and one important reason is that there is a lack of highly polymorphic markers for this species. To date, inter-simple sequence repeat (ISSR) (Chen et al., Reference Chen, Ahmed, Liu, He and Wang2014) and mitochondrial COI gene (Zhu et al., Reference Zhu, Ma, Dong, Li, Jiang, Li, Dong, Dong and Wang2012) have been the main molecular markers used in A. lepigone. However, due to haploid and maternal inheritance characteristic, the COI gene is less robust for dispersal and population structure studies of highly migratory insects. Moreover, biased estimation of genetic diversity caused by symbionts is another problem with using mtDNA in an insect population genetics study (Hurst & Jiggins, Reference Hurst and Jiggins2005). In addition, ISSR markers have the flaws in terms of dominant inheritance, inaccurate genotyping, and false homology (Agrawal & Shrivastava, Reference Agrawal, Shrivastava, Ravi, Baunthiyal and Saxena2014), making them a flawed choice for population genetics studies. The inability to differentiate between homozygotes and heterozygotes makes it difficult to calculate allele frequencies from dominant markers. This, in turn, leads to that some powerful Hardy–Weinberg equilibrium (HWE) assumptions based population clustering methods (e.g. STRUCTURE software) are less robust or even impracticable in inferring population structure.
Because of its abundance in the genome, codominant Mendelian inheritance, high levels of polymorphism, and ease of operation (Selkoe & Toonen, Reference Selkoe and Toonen2006; Guichoux et al., Reference Guichoux, Lagache, Wagner, Chaumeil, Leger, Lepais, Lepoittevin, Malausa, Revardel, Salin and Petit2011), microsatellites have become popular markers and are widely used in population genetic studies of agricultural pests (Carew et al., Reference Carew, Gagliardi and Hoffmann2013; Zhang et al., Reference Zhang, Yang, Li, Liu and Zhang2013; Sun et al., Reference Sun, Jiang, Wang and Hong2014). However, microsatellite development is usually labor-intensive and expensive. Recently, an enormous amount of expressed sequence tags (ESTs) has become available in public sequence databases, which provides a rich source of material for microsatellite development. Mining ESTs has been proved an efficient approach for microsatellite development, and widely used in pests (Sun et al., Reference Sun, Zhang, Ge and Hong2011; Sun et al., Reference Sun, Jiang, Wang and Hong2014; Li et al., Reference Li, Lang, Fu, Shen, Wan and Chu2015).
Here we developed novel microsatellite makers by mining ESTs of A. lepigone. We also employed these new microsatellites to conduct a preliminary population structure study on nine geographic populations. Overall, our study provided new molecular markers for A. lepigone, and shed a new light on the population genetic structure of this pest in China.
Materials and methods
Sampling and DNA extraction
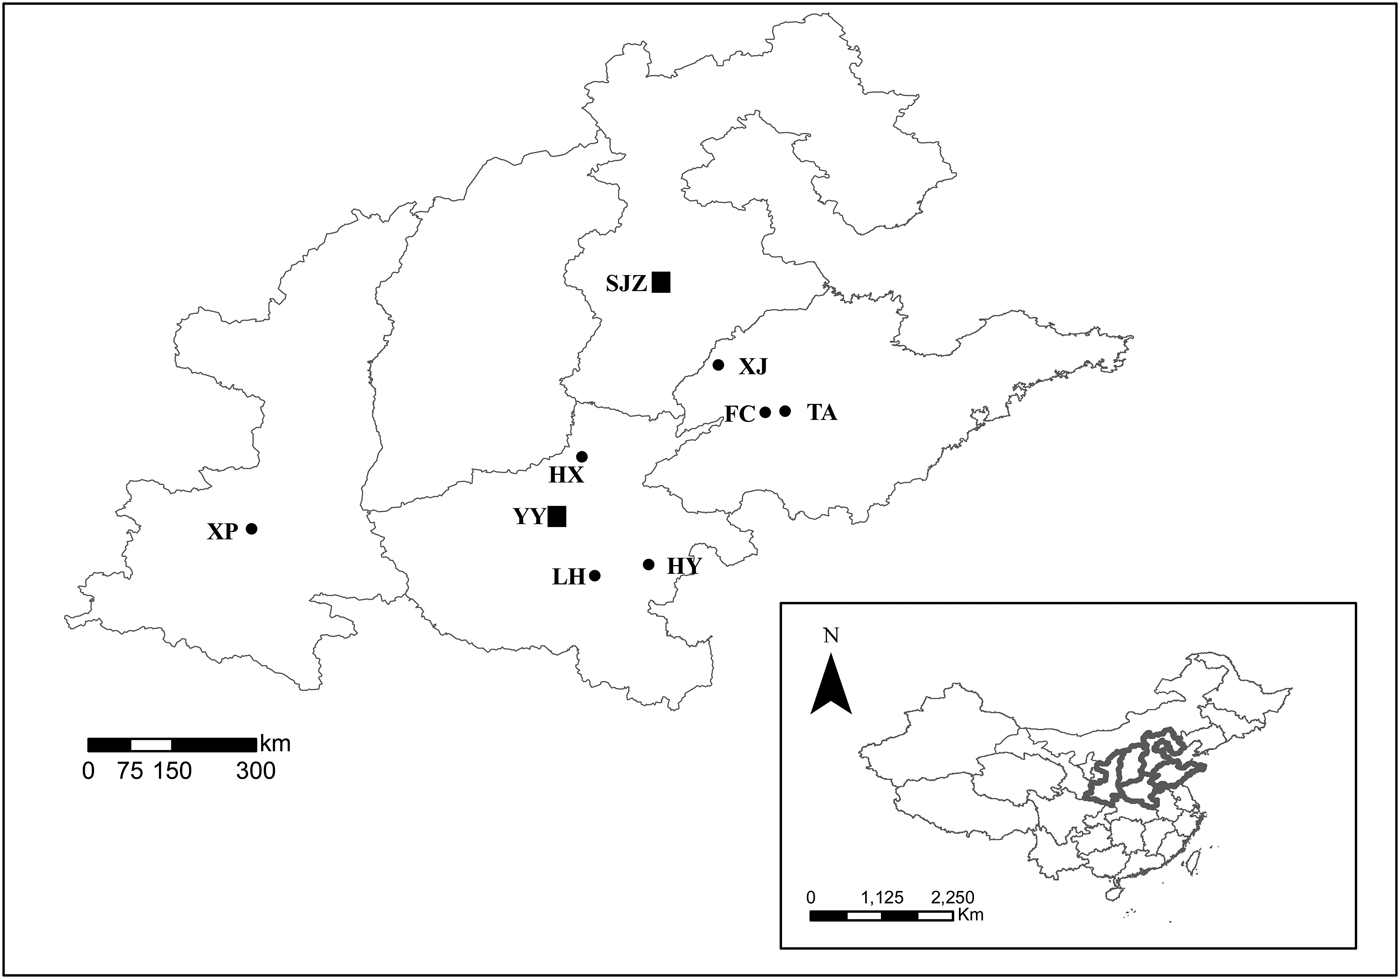
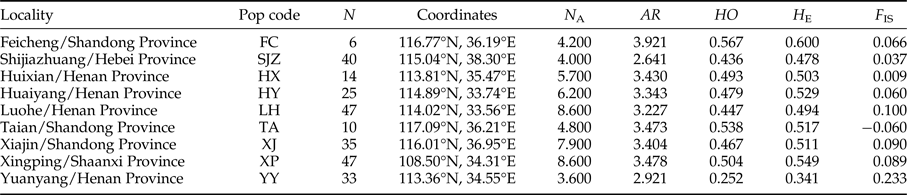
During the summer of 2015, we collected a total of 257 A. lepigone adults from seven natural geographical populations and two laboratory-reared populations (Fig. 1). The details of sampling information are provided in Table 1. These natural populations were sampled by randomly collecting adults from a 10 × 10 m2 in maize fields. The samples were immediately preserved in absolute ethanol and then stored at −20°C in the laboratory until DNA extraction. The two laboratory-reared populations had been reared for 10–13 generations, with the initial sample size of 60–100 before DNA extraction. Genomic DNA was extracted from individual adult females using the Wizard®SV Genomic DNA Purification System (Promega).
Sample locations of the nine A. lepigone populations used in this study. Squares indicate laboratory-reared populations, dots indicate natural populations.

Basic genetic diversity indices for each A. lepigone population calculated from ten microsatellite loci.

N: sample sizes, N A: number of alleles per locus; A R: mean allelic richness over 19 microsatellites (for standardized samples of 24 individuals); H O: mean observed heterozygosity over ten microsatellites; H E: mean expected heterozygosity over ten microsatellites.
Microsatellites development
Microsatellite DNA sequences were mined from the transcriptome sequences of A. lepigone using bioinformatics methods. Briefly, four available short read archive (SRA) projects of A. lepigone (SRX254872–SRX254875; Li et al., Reference Li, Zhu, Ma, Li and Dong2013), which was generated by sequencing four developmental stages (egg, larvae, pupae, and adult) of a Chinese population, were downloaded from the SRA of the National Center for Biotechnology Information (NCBI), and then were assembled together using Trinity software with default parameters (Grabherr et al., Reference Grabherr, Haas, Yassour, Levin, Thompson, Amit, Adiconis, Fan, Raychowdhury, Zeng, Chen, Mauceli, Hacohen, Gnirke, Rhind, di Palma, Birren, Nusbaum, Lindblad-Toh, Friedman and Regev2011). Short transcripts (<350 bp) were discarded from the resulting assembly. After assembly, a total of 51,998 unigenes were obtained with a total length of 38.0 Mb. The obtained unigenes were analyzed using SciRoKo 3.4 (Kofler et al., Reference Kofler, Schloetterer and Lelley2007) to identify reads that contained simple tandem repeats. The Mismatched; Fixed Penalty mode with a mismatch penalty value of 5 was employed to identify microsatellites. Only dinucleotide to pentanucleotide motifs with more than five repeats were selected for further study. Primers were designed using Primer 3 (Rozen & Skaletsky, Reference Rozen, Skaletsky, Misener and Krawetz2000) with the following parameters, a 40–60% GC content, 100–300 bp final product size, annealing temperatures of primers, 52–58°C (optimum 55°C), with a 3°C maximum difference between paired primers. In order to know whether the microsatellite sequences were located on functional genes, the selected ESTs were also compared with the NCBI nr protein database using the BLASTX program (http://blast.ncbi.nlm.nih.gov/Blast.cgi?PROGRAM=blastx&PAGE_TYPE=BlastSearch&LINK_LOC=blasthome). A cut-off E-value of 1×10⁻⁷ was chosen to assign a potential homolog for each EST sequence.
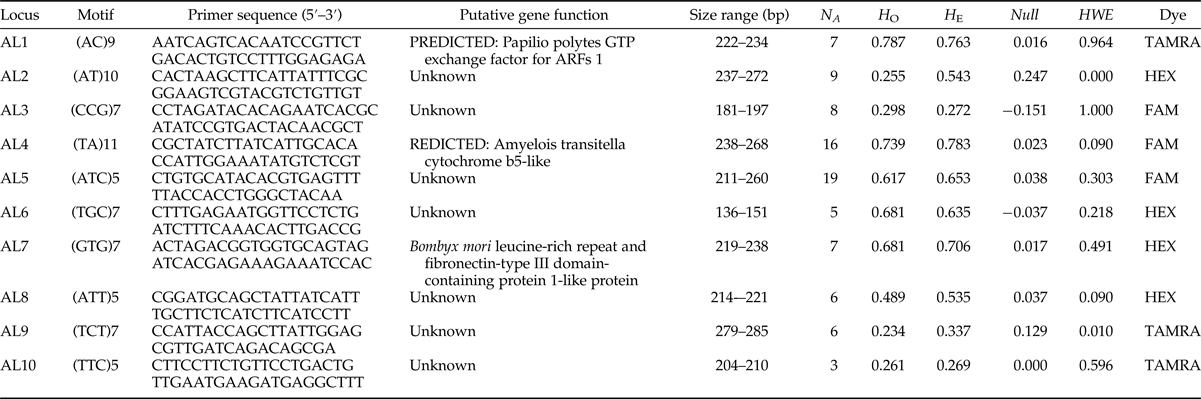
To examine the effectiveness of primer pairs, 47 DNA samples of the XP population were used as PCR templates. The forward primer of each pair was labeled with a fluorescent dye (FAM, HEX, or TAMRA; Table 2). Ten microliters of the reaction mixture contained 10–100 ng template DNA, 0.2 mM of each dNTP, 1 × PCR buffer (Mg2+-free; Fermentas), 0.5 µM each primer, 2.5 mM Mg2+, and 0.3 U Maxima Hot Start Taq DNA Polymerase (Fermentas). Reactions were preceded by a 4-min denaturation step at 94°C and were cycled 35 times for 30 s at 94°C, 30 s at 55°C, and 40 s at 72°C, followed by a final 15-min extension step at 72°C. PCR products were analyzed using an ABI 3130 sequencer (Applied Biosystems), according to the manufacturer's instructions. Allele sizes were determined using GENEMAPPER 4.0 (Applied Biosystems), with LIZ-500(−250) as size standard.
Characteristics of ten novo polymorphic microsatellite loci developed for A. lepigone.

N A: number of alleles per locus; H O: observed heterozygosity; H E: expected heterozygosity; HWE: P values of the Hardy–Weinberg equilibrium test, bold indicates significant departure from Hardy–Weinberg equilibrium after FDR correction for multiple tests (P < 0.05); Null: null allele frequencies calculated with the Oosterhout algorithm (van Oosterhout et al., Reference van Oosterhout, Hutchinson, Wills and Shipley2004); annealing temperature of each pair of primers was 55°C.
As XP population has the maximum number of natural samples, we also used this population to characterize the new microsatellites. The number of alleles per locus (N A), observed heterozygosity (H O), and expected heterozygosity (H E) were calculated by using GenAlEx 6.5 (Peakall & Smouse, Reference Peakall and Smouse2012). Null allele frequencies were estimated by Micro-Checker 2.2.3 with the Oosterhout algorithm (van Oosterhout et al., Reference van Oosterhout, Hutchinson, Wills and Shipley2004). Hardy–HWE for each locus and genotypic linkage disequilibrium (LD) between pairs of microsatellites were estimated with Genepop on the web (http://www.genepop.curtin.edu.au/) (Raymond & Rousset, Reference Raymond and Rousset1995). To avoid false positives caused by performing multiple tests, false discovery rate (FDR) correction was applied for 45 tests for LD and ten tests for HWE using R 3.3.1 (R Development Core Team, 2005).
Population structure analyses
One hundred and eighty-four individuals from seven natural populations and 73 individuals from two laboratory-reared populations were analyzed using the newly developed microsatellites. We calculated the N A, H O, H E, and fixation index (F IS) for each locus in each population using GenAlEx 6.5. To avoid biased estimates of genetic diversity due to unequal sample sizes, we calculated the allelic richness (A R) based on a minimum population size of five individuals using FSTAT 2.9.3.2 (Goudet, Reference Goudet2002). Estimates of null allele frequencies and tests of HWE and LD were also conducted for each population with more than 20 individuals according to the methods afore-described.
Because estimates of population structure using loci that are potentially under selection or linked to genes under selection may be inaccurate, we first examined whether the new microsatellites were under selection based on patterns of genetic variation between population samples. The approach of Excoffier et al. (Reference Excoffier, Hofer and Foll2009) under a finite island-model implemented in ARLEQUIN3.5.2 (Excoffier & Lischer, Reference Excoffier and Lischer2010) with the default parameters was used to infer the outliers. As the presence of null alleles was detected at AL2 and AL9, we deleted the two loci from the following population genetic structure analyses. Then, pairwise F ST values were calculated with Arlequin 3.5.2 with 104 permutations (Excoffier & Lischer, Reference Excoffier and Lischer2010). We used STRUCTURE 2.3.4 (Pritchard et al., Reference Pritchard, Stephens and Donnelly2000) to infer patterns of genetic structure. The simulation was run using the model combination of admixture ancestry model with sampling locations as prior (LOCPRIOR), and the correlated allele frequency model. We used the LOCPRIOR model because it can use sampling locations as prior information to assist the clustering for the case where the genetic differentiation is relatively weak (Hubisz et al., Reference Hubisz, Falush, Stephens and Pritchard2009). The Markov chain Monte Carlo simulation was run ten times for each value of K (1–9) for 106 iterations after a burn-in period of 105. The most probable K value in the data was firstly determined by comparing the log-likelihood values (lnPr(X/K)). As uneven sampling can affect the detection of the true K, four new supervised methods (MedMeaK, MaxMeaK, MedMedK, and MaxMedK) were also used to detect the number of clusters (Puechmaille, Reference Puechmaille2016). Furthermore, we also used a non-model-based multivariate approach (discriminant analysis of principal components, DAPC) to infer the population structure using the adegenet version 2.0.1 software (Jombart, Reference Jombart2008; Jombart et al., Reference Jombart, Devillard and Balloux2010). Because we detected great genetic differentiation between the laboratory-reared populations and natural populations, which may mask the signals of sub-population genetic structure of the natural populations; we also re-ran both the STRUCTURE and DAPC analyses just for the natural populations. To detect an isolation-by-distance (IBD) effect, we compared the F ST/(1−F ST) matrix with a geographic distance matrix (Log Km) using the Mantel test implemented in IBDWS 3.16 (Jensen et al., Reference Jensen, Bohonak and Kelley2005), with significance tests performed over 103 permutations.
Recent migration rates among the seven natural populations were inferred using BayesAss 3.0.4 (Wilson & Rannala, Reference Wilson and Rannala2003). Preliminary runs were performed to adjust parameter values for allele frequencies and inbreeding coefficients. Then, 108 Markov chain Monte Carlo simulation iterations with a burn-in of 107 were carried out to allow the chain to reach stationarity. Different random seeds were used to carry out ten independent runs with a sampling frequency of 1000 steps. Trace files of the ten longer runs were imported to TRACER 1.6 (Rambaut et al., Reference Rambaut, Suchard and Drummond2013) to check the MCMC chain convergence, and combined to calculate the mean migration rate.
Results
Microsatellite characteristics
A total of 2057 microsatellite-containing sequences were identified, and 1907 pairs of primers were successfully designed for these microsatellite-containing sequences. We arbitrarily selected 300 primer pairs for PCR validation. Of the 300 primer pairs, 107 primer pairs amplified a fragment of the expected size. Of the 107 successful primer pairs, only ten produced clean band patterns and revealed polymorphisms among the tested samples. For these ten ESTs, homology searches of the NCBI nr database with BLASTX revealed three ESTs with significant hits to functional genes (Table 2), with the E-value ranged from 0 to 1×10−107.
LD tests between the ten microsatellites were not significant after FDR correction. The new microsatellites displayed moderate to high levels of polymorphism in a tested population (XP). The number of alleles per locus ranged from 3 to 19, with an average of 8.6 (Table 2). The observed and expected heterozygosity ranged from 0.234 (AL9) to 0.787 (AL1) and from 0.269 (AL10) to 0.783 (AL4), respectively. Fisher's exact tests revealed that two loci (AL2 and AL9) significantly deviated from HWE. Null alleles were detected in the two loci by MICRO-CHECKER 2.2.3 (van Oosterhout et al., Reference van Oosterhout, Hutchinson, Wills and Shipley2004), which indicates that heterozygote deficiency caused by null alleles may result in the observed deviations from HWE at the two loci (Table 2). These new microsatellites without null alleles were further used in the following population genetic structure analyses.
Population genetic structure
Relatively lower levels of genetic diversity were detected in the two laboratory-reared populations of A. lepigone (SJZ and YY), with relatively fewer numbers of alleles and lower levels of heterozygosity. In general, apart from the two laboratory-reared populations, the seven natural populations had similar and moderately high levels of genetic diversity. The number of alleles per locus for each population ranged from 4.2 to 8.6, and the allelic richness based on a minimum population size of five diploid individuals ranged from 3.2 to 3.9. The observed and expected heterozygosity values ranged from 0.447 to 0.567 and 0.494 to 0.600, respectively (Table 1). No significant genotypic disequilibrium was detected between loci in each of the five populations (SJZ, HY, LH, XJ, and YY) with more than 20 individuals. Significant departures from HWE were only observed in five of the 40 single-locus exact tests after FDR correction. Null allele analysis by Micro-Checker software (Ver. 2.2.3) revealed that the departure from HWE was almost entirely due to the presence of null allele. Four of the five deviated loci were detected the significant presence of a null allele, and the remaining locus was also with relatively higher null allele frequency although not significant (see Table S1 for more details).
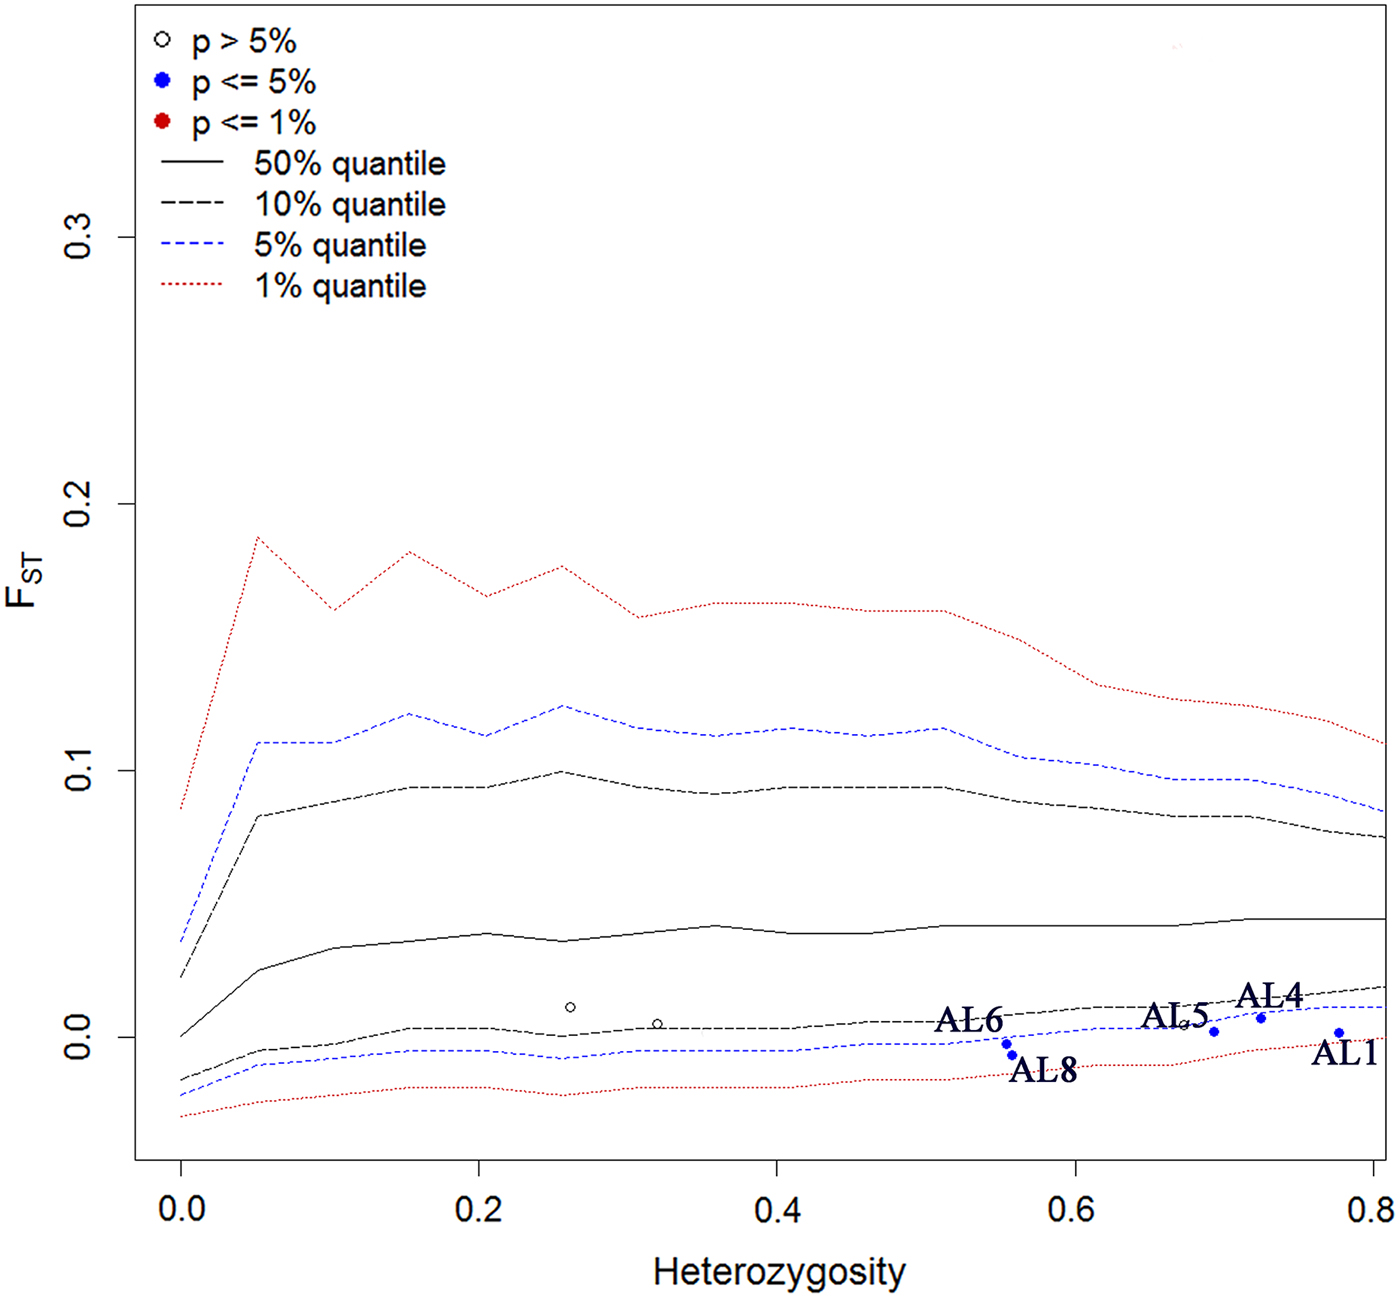
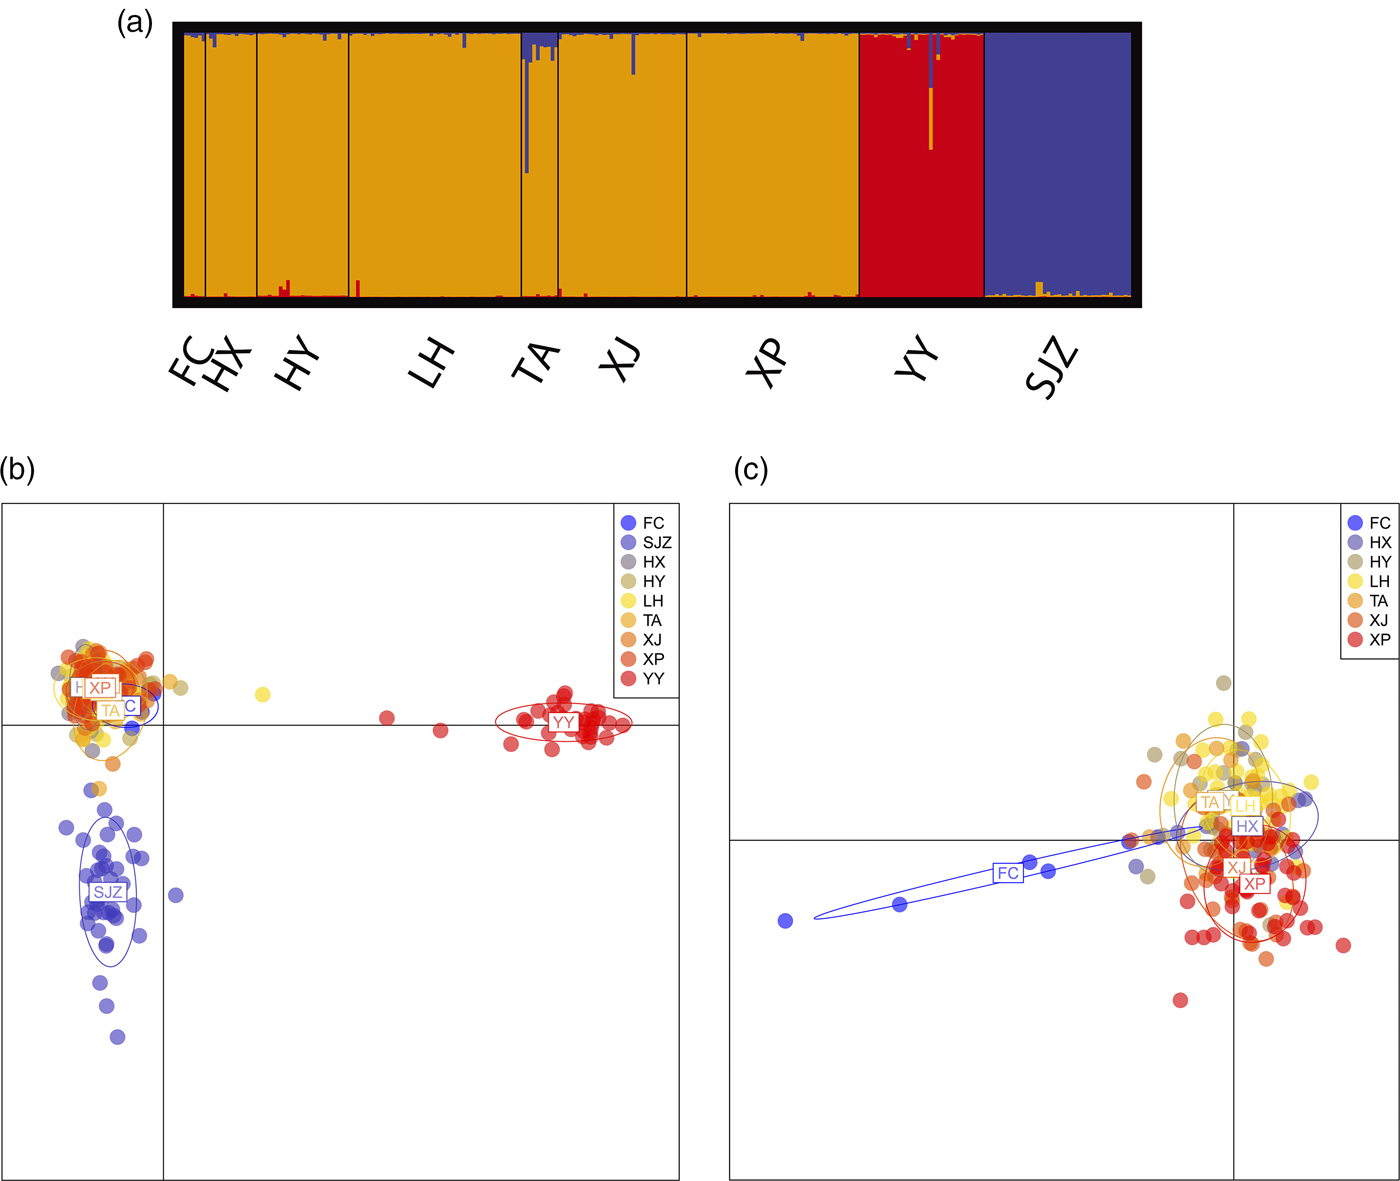
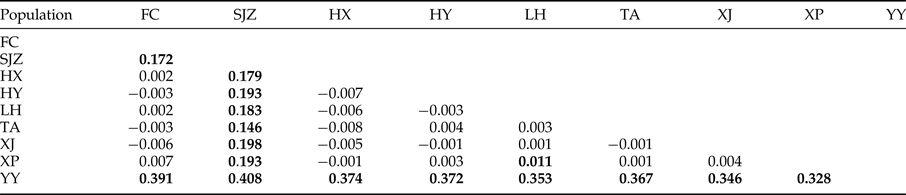
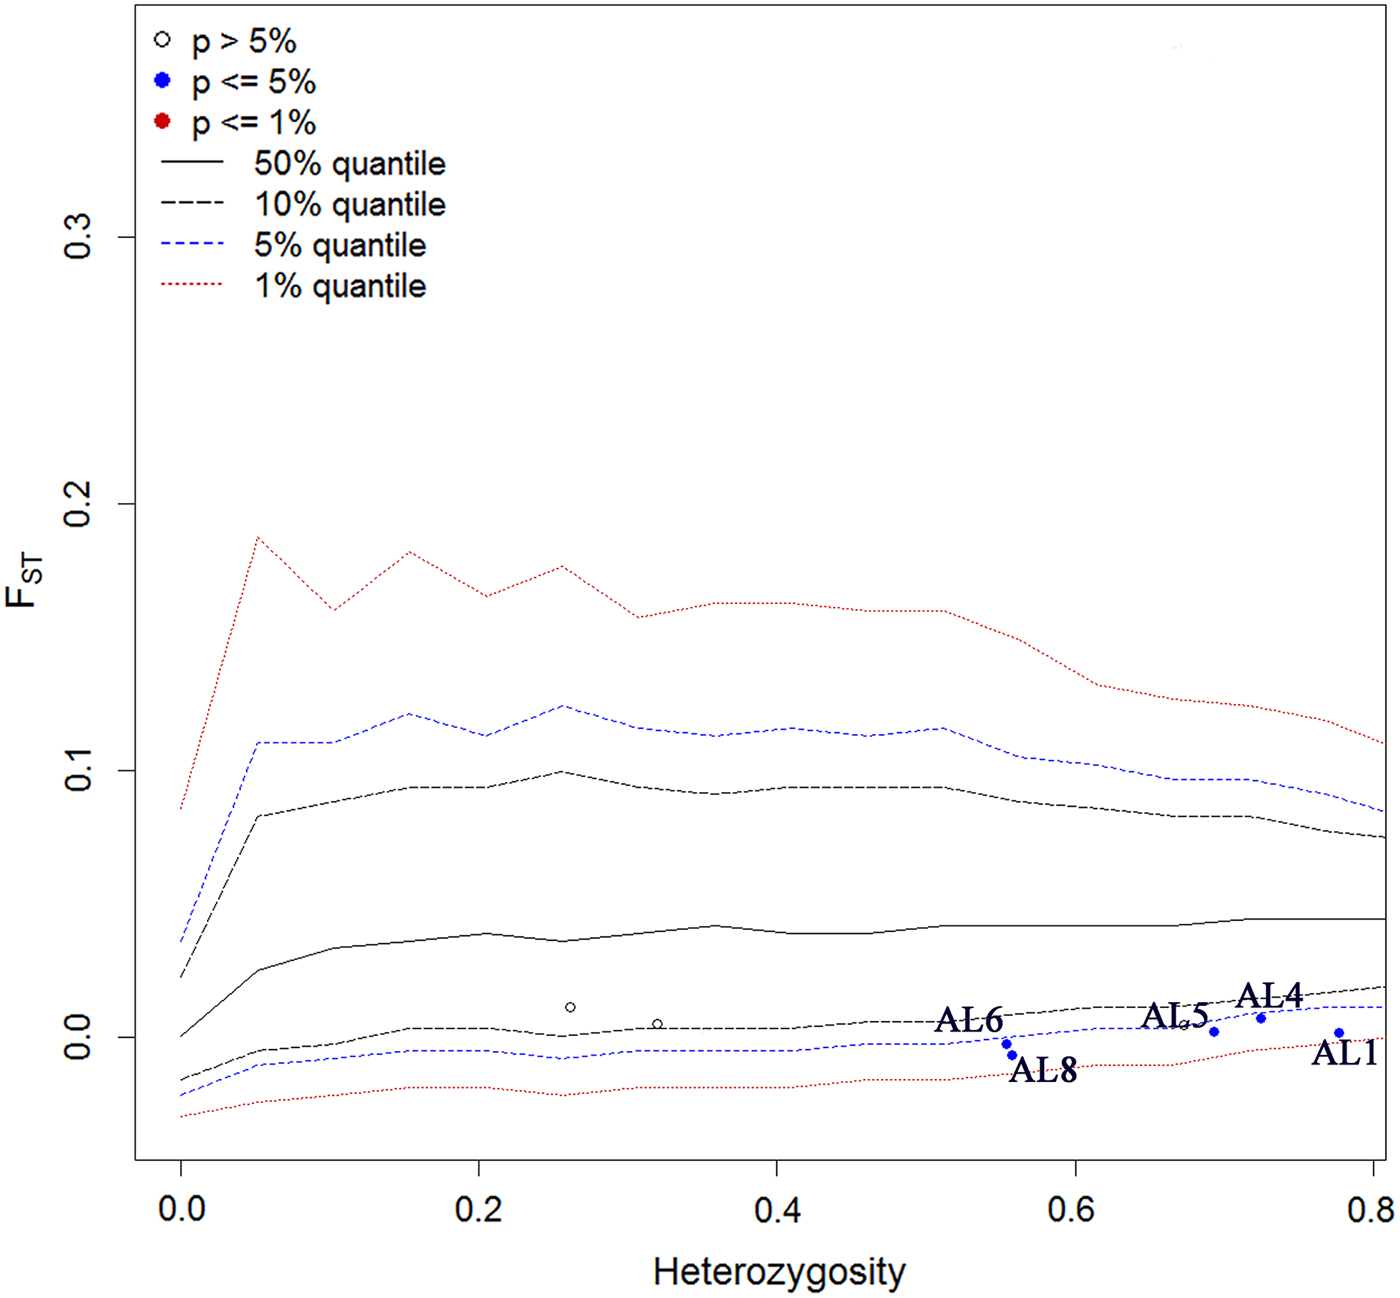
Tests of selection revealed that five loci (AL1 and 4–8) were under balancing selection (P < 0.05, fig. 2). Pairwise F ST values between pairs of populations ranged from −0.008 to 0.408, with an average value of 0.117. Permutation tests showed that 16 of the 36 pairwise populations were significantly different (Table 3). However, 15 of the 16 significant pairwise differentiation levels were between two laboratory-reared populations (SZJ and YY) and the remaining populations. The two laboratory-reared populations significantly diverged from the remaining populations with high F ST values, with an average value of 0.321. Additionally, both the STRUCTURE and DAPC analyses clearly discriminated the two laboratory-reared populations from other populations (fig. 3a, b and S1). Substantial genetic drift caused by limited population sizes during rearing may have led to population differentiation.
F ST-based detection of microsatellite loci under selection. Graphic output from ARLEQUIN3.5.1 (Excoffier & Lischer, Reference Excoffier and Lischer2010). Red filled points represent the loci under positive selection. Blue filled points represent the loci under balancing selection. Blank filed points represent the loci under neutral selection. Different type lines represent different confidential intervals.
Population genetic structure revealed by STRUCTURE and DAPC analyses based on nine microsatellite loci. (a) Population genetic structure of nine Athetis lepigone populations revealed by STRUCTURE, (b) DAPC results for the nine populations, (c) and for the seven natural populations. Dots represent different individuals. Geographic samples are represented by different colors.

Pairwise F ST values between nine Athetis lepigone populations.

Bold indicates significant values after FDR correction for multiple tests (P < 0.05).
Excluding the YY and SJZ populations, the average value of F ST between pairs of the remaining natural populations was 0.000. No IBD effects were detected. Significant differentiation was only detected between XP and LH, with an F ST value of 0.011. STRUCTURE results showed that the log-likelihood of the multilocus genotypic data was maximal and with a low variance for K = 1 (Fig. S2), which indicates that the seven natural populations most likely formed a single genetic cluster. MedMeaK, MaxMeaK, MedMedK, and MaxMedK methods (Puechmaille, Reference Puechmaille2016) all showed K = 1. None of the seven populations was assigned to additional clusters with a mean or median membership coefficient greater than 0.5. Accordingly, DAPC results also showed a lack of genetic structure in the seven populations (fig. 3c). BayesAss results revealed strong recent gene flow among populations. The fractions of migrants ranged from 0.0422 to 0.0531, with an average value of 0.0478. In addition, relatively higher levels of migration rate from FC, HX, and LH to other populations were found (Table 4).
Recent migration rate per generation among the seven natural populations of Athetis lepigone.

Source populations are listed by column and recipient populations are listed by row. Bolds indicate self-recruitment rates for each population. The value in parentheses is the standard errors of mean migration rates over ten independent runs.
Discussion
Although microsatellites are the most popular molecular marker in population genetics, it is difficult and challenging to develop microsatellites for many lepidopteran insects (Delamaire et al., Reference Delamaire, Esselink, Samiei, Courtin, Magnoux, Rousselet and Smulders2010), because microsatellite sequences usually exist in multiple copies in the genome, and have similar or almost identical flanking regions in lepidopteran genomics (Meglécz et al., Reference Meglécz, Petenian, Danchin, Coeur d'Acier, Rasplus and Faure2004; Sinama et al., Reference Sinama, Dubut, Costedoat, Gilles, Junker, Malausa, Martin, Neve, Pech, Schmitt, Zimmermann and Meglecz2011). Mobile elements (e.g. retrotransposons) associated genomic spread of microsatellites was considered as the reason for this phenomenon (Zhang, Reference Zhang2004; Tay et al., Reference Tay, Behere, Batterham and Heckel2010). Primers designed in these regions will amplify multiple products, and therefore result in allele calling confusion. This leads to low efficiency and high expense of microsatellite development in lepidopteran insects. Allele calling confusion also led to the low microsatellite development efficiency in this study. Sixty-four of the 107 PCR workable primer pairs were discarded due to producing multiple alleles during the polymorphism test stage. However, the EST-based microsatellite development method is free of microsatellite DNA library construction and clone sequencing, which greatly reduces labor, time, and cost. Another problem is the high frequency of null alleles in lepidopteran microsatellites (Keyghobadi et al., Reference Keyghobadi, Roland and Strobeck1999; Harper et al., Reference Harper, Maclean and Goulson2003; van't Hof et al., Reference Van't hof, Zwaan, Saccheri, Daly, Bot and Brakefield2005; Mikheyev et al., Reference Mikheyev, Vo, Wee, Singer and Parmesan2010). However, the significant presence of null alleles was only detected in two (AL2 and AL9) of the 10 loci, with very low frequencies. These low null allele frequencies may be due to the high sequence conservation of the ESTs. Additionally, one thing should be noted, we only use XP population for the initial microsatellites screening, which may lead to the missing of some loci being non-polymorphic in XP population but polymorphic in other populations. Population genetics studies with these new microsatellites may have the risk of a homogenizing effect on detection of population structure.
For population genetic structure analysis, the new microsatellites first clearly discriminated the two laboratory-reared populations from the remaining seven natural populations by F ST, STRUCTURE, and DAPC analyses. Relatively lower levels of genetic diversity detected in the two laboratory-reared populations revealed that substantial genetic drift in the two laboratory-reared populations during rearing may have led to significant divergence. This result indicated that the new microsatellites were very sensitive for detecting population demography history and genetic structure. Apart from the two laboratory-reared populations, a lack of population genetic structure was revealed in the seven natural populations. Strong gene flow was detected among populations, which indicates a high dispersal ability of this species. This result was generally consistent with those of previous studies that used ISSR (Chen et al., Reference Chen, Ahmed, Liu, He and Wang2014) and mitochondrial DNA markers (Zhu et al., Reference Zhu, Ma, Dong, Li, Jiang, Li, Dong, Dong and Wang2012). These lines of evidence altogether pointed to that the Chinese A. lepigone populations were not differentiated and constituted one panmictic population. It stood to reason that the strong gene flow revealed by BayesAss homogenized populations. The pairwise F ST values were similar to those of other migratory insects (Endersby et al., Reference Endersby, Mckechnie, Ridland and Weeks2006; Franklin et al., Reference Franklin, Ritland and Myers2011; Sun et al., Reference Sun, Jiang, Wang and Hong2014), which indirectly suggests that A. lepigone undergoes long-distance migration. However, we should note that a locus under balancing selection would show too even allele frequencies across populations, resulting in downwardly biasing estimates of differentiation by it (Excoffier et al., Reference Excoffier, Hofer and Foll2009). In this study, five out of the eight microsatellites were detected under the balancing selection, which also contributed to the low F ST values.
Although strong gene flow between populations was detected in A. lepigone, we still cannot illustrate whether the outbreak of this pest is caused by rapid in situ population sizes increase in each outbreak area, or immigrants from a potential source area in China. Interestingly, relatively higher level of migration rate from FC, HX, and LH to other populations was detected. We supposed that these populations may facilitate the outbreak expansion of this pest. Nevertheless, only limited numbers of natural samples were employed in this preliminary population genetics study of A. lepigone. A much more comprehensive and accurate population genetic structure is necessary to be revealed by analyzing more samples from more outbreak areas in China and other locations around the world in the future.
The low levels of population differentiation hampered inference of a clear dispersal route of this pest in China. Microsatellites have been successfully used to infer invasion routes of many invasive insects (Yang et al., Reference Yang, Sun, Xue, Li and Hong2012); however, they often fail for inference of the dispersal routes of local insects with high dispersal abilities (Sun et al., Reference Sun, Jiang, Wang and Hong2014; Sun et al., Reference Sun, Wang, Zhang, Chapuis, Jiang, Hu, Yang, Ge, Xue and Hong2015). This may be due to large population sizes and persistent gene flow among populations of local insects. We think much more microsatellites may be necessary to be developed for the accurate dispersal route inference of A. lepigone. Additionally, genome-wide single-nucleotide polymorphisms (SNPs) provide much greater resolution than traditional molecular markers in detecting population structure, and have been used in the studies of non-model organisms (Rašić et al., 2014). So, with the gradual decrease of the sequencing expense, SNPs will be an ideal option to study the outbreak of agricultural pest.
In conclusion, we developed ten high-quality microsatellite markers for A. lepigone. This preliminary population genetic analysis revealed strong gene flow and a lack of population genetic structure in the natural populations of A. lepigone. Further studies that analyze more samples with more loci are necessary to better elucidate the outbreak process of this pest.
Supplementary material
The supplementary material for this article can be found at https://doi.org/10.1017/S000748531700116X
Acknowledgements
We are grateful to Dr Yu-Xi Zhu of NJAU for making the collection map. This work was supported by a grant-in-aid from the National Key R&D Program of China (2017YFD0201802) and a grant-in-aid from the National Natural Science Foundation of China (31401731, 31300346).