

A large body of work has developed in recent years to examine whether attack campaigning depresses turnout overall. The preponderance of evidence shows that it does not (see Lau, Sigelman, et al. Reference Lau and Sigelman2007 for a review and meta-analysis of the findings from 57 studies of this relationship).Footnote 1 While the absence of a depressive effect on overall turnout in response to attacks is reassuring in many respects, certain groups could be systematically mobilized or demobilized even if overall participation levels remain relatively unaffected. In this regard, a particularly important question to examine is whether men and women respond similarly to negative campaigning. Yet the question of whether a gender difference exists in response to campaign attacks has so far been neglected by the literature.Footnote 2
This article points to a more general weakness in the political science literature on elections: Although a fairly substantial literature exists on female candidates, scholars have spent comparatively less time directly examining the behavior of female voters and how it can sometimes systematically differ from that of men. In the case at hand, scholars have not entirely ignored the possibility that men and women may respond differently to negative campaigning in terms of participation. The two studies that raise this possibility, however, only describe it in passing, with a brief mention of a noneffect on participation in Goldstein and Freedman (Reference Goldstein and Freedman2002, 735) and a short discussion of a mixed effect by Kim Fridkin Kahn and Patrick J. Kenney (Reference Kahn and Kenney2004, 98–99). Aside from the fact that these divergent findings create a need for further empirical analysis, we lack a systematic theoretical examination of this issue.
To begin, this article shows that evidence drawn from a variety of relevant fields outside of political science point towards the general expectation that men will be mobilized by negativity to a greater degree than women. Associated hypotheses are then tested using two different types of data. To benefit from the external validity afforded by analysis of voter reactions to actual campaigns, I analyze data regarding the proportion of campaign statements that were negative in every Senate election in 1994, 1998, and 2002 in conjunction with respondent-level data from the National Election Studies. The data were collected by Richard R. Lau and Gerald M. Pomper (Reference Min2004). To benefit from the greater control afforded by an experiment—specifically, the ability to distinguish uncivil negative messages from those opponent-focused messages that are more civil in tone—I analyze data from an experiment based on a large-n representative sample of U.S. adults to assess respondent reactions to messages that vary only in terms of the degree of incivility they contain. In both analyses, the findings are congruent: Men are motivated to participate by negativity. As negativity reaches its highest levels—as defined by proportion in the first analysis and tenor in the second analysis—men are far more likely to react by turning out at the polls on Election Day than are women. Further analysis isolates the relationship among gender, message tone, and partisanship and shows that the incivility/turnout linkage functions primarily by mobilizing male independents and, to a lesser extent, male Democrats, while slightly demobilizing independent women.
With this multimethod design, these findings indicate that the predominant mix of null and energizing effects in the literature concerning negativity and turnout for the overall population are masking differential effects for men and women.
GENDER AND CONFLICT
Campaigning in U.S. politics often resembles a boxing match, albeit one involving the exchange of words. With punches and counterpunches, offensive maneuvers and defensive maneuvers, and the increasing pace of such tactics up until Election Day, conflict characterizes many political campaigns. Television brings this political conflict into people's living rooms, radio ads project it into cars, and direct mail delivers it to mailboxes. Even the language around campaigning suggests a fight: Terms frequently used to describe campaigns include “battle,” “battleground” (states, races), “mudslinging,” and “attack” politics, to name just a few. Pundits regularly question whether candidates can “go the distance” and if they have a “glass jaw” when they are confronted with “below the belt” attacks. While campaigns clearly differ in the number, type, and intensity of attacks, the majority of contemporary candidates “go negative” to at least some extent as an important part of campaign strategy.Footnote 3
Given the prevalence of negative messages in American elections, a crucial question is whether women and men respond differently to campaign conflict. Since this topic has been neglected by political scientists, one useful strategy for gaining leverage on this question is to examine analyses of how men and women respond to various forms of nonpolitical conflict. If a wide range of conflict-related analyses outside of political science indicate that men and women respond differently to conflict, then this would suggest that a divergent reaction to political conflict is likely to be found as well. As the following discussion reveals, findings across a broad array of literatures—including linguistics, psychology, child development, neuroscience, and media studies—show that men are more comfortable with open conflict than are women. The collective body of this research across domains suggests that it would be more surprising to find that men and women have similar reactions to negativity campaigning than to discover that they have different reactions.
A multitude of studies have documented that men are more physically aggressive than women (see, for example, comprehensive meta-analyses of the relationship by J. Archer [Reference Archer2004], A. H. Eagly and V. J. Steffen [Reference Eagly and Steffen1986], and G. P. Knight, I. K. Gurthrie, and colleagues [Reference Knight and Guthrie2002]).Footnote 4 In addition to greater tendencies toward physical aggression, men also tend to be more verbally aggressive with respect to face-to-face disagreement and argumentation than do women (see, for example, the 2004 meta-analysis by Archer). That is not to say that females are not aggressive at all; they are simply less likely to be aggressive in a direct manner. Some studies have shown that girls are more indirectly aggressive than boys, engaging in behind-the-scenes behavior such as “backbiting” and the manipulation of the social structure of the group (Bjorkqvist, Lagerspetz, et al. 1992; Lagerspetz, Bjorkqvist, et al. Reference Lagerspetz and Bjorkqvist1988). However, in general, political ads best approximate direct rather than indirect aggression, and so the finding that men utilize more direct verbal aggression is most relevant (see Bjorkqvist et al. Reference Bjorkqvist and Lagerspetz1992; Crick, Bigbee, et al. Reference Crick and Bigbee1996; see also meta-analyses on this topic by Archer Reference Archer2004 and Eagly and Steffen Reference Eagly and Steffen1986).
Studies of linguistics have also shown that men and women use language differently. For example, in a recent examination of related linguistics research, L. L. Carli and D. Bukatko note that “overall, research across the life span indicates that females' communications are more other-directed, warm, and mitigated, and less dominant, status asserting, aggressive, and task-oriented than males' speech” (Reference Carli, Bukatko, Eckes and Trautner2000, 321). Similarly, Deborah Tannen (Reference Tannen2001) argues that women tend to use language toward cooperative ends, while men are prone to use language to compete with others. In examining the interactions of children, Tannen claims that boys continually engage in both physical and verbal king-of-the-hill battles, such that social relationships are essentially a zero-sum game; girls, in contrast, are more verbally cooperative. In general, women have been found to prefer and to utilize more “polite” forms of verbal communication than men (Holmes Reference Holmes1995). Janet Holmes also shows that men are less likely than women to show compliments, warmth, and friendliness in conversation and, among other things, are more likely to interrupt their conversation partners than are women. Scholars have confirmed the greater likelihood of women to soften their speech in a variety of ways, such as with hedging, tentativeness, and “booster” statements, in order to ease social interactions and make all participants more comfortable (Holmes Reference Holmes1995; Mills Reference Mills2003).
These studies do not look at reactions to televised stimuli and rarely examine how people react to conflict as an uninvolved third party. The most relevant research in both respects is the literature that examines how men and women react to aggressive or violent media programs. With respect to horror movies, a large number of findings confirm that men are far more likely to enjoy them, be excited by them, and be comfortable with them than are women (see, for example, Koukounas and McCabe Reference Koukounas and McCabe2001; Mundorf, Weaver, et al. Reference Mundorf and Weaver1989; see also a meta-analysis on the topic by C. Hoffner and K. J. Levine [Reference Hoffner and Levine2005]). Men are more likely to self-select violent programs than are women (Atkin, Greenberg, et al. Reference Atkin and Greenberg1979; Cantor and Nathanson Reference Cantor and Nathanson1997). In an MRI study by A. Schienle, A. Schafer, and colleagues (Reference Schienle and Schafer2005), researchers found that women displayed more intense responses than did men to pictures that featured fear and disgust, while men showed greater brain activation to pictures involving aggressive acts than did women (for example, a dog clenching its teeth or a man attacking another man with a knife). But while a fair number of political ads are figurative bloodbaths, all fall short of that distinction in a literal sense. Thus, the comparison is imperfect, but it does clearly reveal that men and women differ in terms of how they respond to observed conflict, albeit violent conflict.
While there is no perfect parallel to the stimuli in question—that is, specifically observing conflict-oriented political messages exchanged between third parties—each of these nonpolitical areas of inquiry reveals important gender differences on matters pertaining to conflict. Men and women speak differently. They have different expectations in terms of the politeness of those exchanges. They engage in physical and verbal conflict differently. Men are more likely to be energized by aggressive television programs, and they are more comfortable with and excited by aggression overall.
How might those differences manifest themselves in a political context? Taken as a whole, these findings from a wide range of fields suggest that men will be affected differently by negative campaigning than will women; specifically, men should be comfortable with, and energized by, attack campaigning while women should be relatively uncomfortable with it and de-energized by it. We might expect divergent reactions in two key areas. First, men and women may differentially penalize candidates for going negative; specifically, due to an aversion to negative campaigning, women might be likely to disproportionately penalize candidates for engaging in it. Two previous studies bear on that question directly: Fridkin and Kenney (Reference Fridkin and Kenney2008, fn. 18) mention that they do not find that men and women penalize candidates differently for sponsoring negative messages. In contrast, James D. King and Jason B. McConnell (Reference King and McConnell2003) find that women disproportionately penalize candidates for sponsoring multiple negative ads, and they theorize that the difference is probably due largely to socialization differences. Voter participation, the focus of this article, is the other key area to which these nonpolitical findings can potentially be extended. Given that men tend to become energized by aggression relative to women, do they also become energized in a political context? More specifically, are men more likely to want to go to the polls after viewing negative ads? To the extent that negativity energizes men relative to women, men should be disproportionately mobilized as campaigns increase in negativity (i.e., progress from positive campaigning to civil negative campaigning to uncivil negative campaigning).Footnote 5 That leads to the following hypothesis:
Different Reactions to Conflict:
As campaigns become more negative, men will be disproportionately mobilized relative to women.
It is an open question, however, as to whether all negative campaigning constitutes conflict, or whether it is only “uncivil” campaigning that is experienced as conflict. Several studies have argued that incivility—that is, being unnecessarily harsh—can potentially produce different effects than negative messages delivered in a more civil manner. Studies by Deborah Jordan Brooks and John Geer (Reference Brooks and Geer2007), Fridkin and Kenney (Reference Fridkin and Kenney2008), Kahn and Kenney (Reference Kahn and Kenney1999), and Diana C. Mutz and Byron Reeves (Reference Mutz and Reeves2005) develop the idea that uncivil negativity is a type of campaigning that is theoretically distinct from civil negativity. To the extent that there are norms concerning discourse in political campaigning, discussing in a civil manner what the opponent did or did not do may fall within those norms; only those extremely negative messages that fall outside of these norms may be noticed and experienced as conflict. If so, it may be that only uncivil negative messages activate conflict-aversion or conflict-seeking behaviors. In that case, the differences between men and women would specifically concern uncivil attacks.
Different Reactions to Extreme Conflict:
Men will be disproportionately mobilized by uncivil negative advertising as compared to women. There will be little difference with respect to civil negativity.
Before we proceed to the analyses, a reasonable question remains: What causes gender differences in reactions to conflict? The aforementioned nonpolitical literatures detail an extensive and varied list of possibilities, both biological and social in nature. Do men tend to be more comfortable with conflict due to higher testosterone levels or other hormones? Are the gender differences rooted in stronger biophysical reactions to conflict? Are they due to relative size and strength advantages? Do selection advantages for males who are aggressive and for women who are more accommodating explain the relationships? Does exposure to more aggressive male role models —perhaps sports figures, movie heroes, and so on—explain some of the gender differences? Do heavier social sanctions for aggression and/or impoliteness for girls than for boys explain some of the differences? Are there other differences in the social and political socialization of boys and girls that are responsible for gender differences in conflict-seeking behavior? There are few clear answers to these questions within any given field, and there is even more variation among them. Resolving these questions is outside the scope of this article. However, regardless of the origin of the difference between how men and women engage in and respond to conflict, that difference should be expected to lead to divergent reactions to negative campaigning.
METHODS AND DATA: A TRIANGULATED APPROACH
One prominent method for studying the relationship between campaign (or advertising) tone and turnout is to examine real campaigns in conjunction with self-reported turnout (see, for example, Goldstein and Freedman Reference Goldstein and Freedman2002; Kahn and Kenney Reference Kahn and Kenney1999, Reference Kahn and Kenney2004; Lau and Pomper Reference Lau and Pomper2001, Reference Lau and Pomper2004). Another is to run an experiment with random assignment to different types of campaign messages (see, for example, Ansolabehere et al. Reference Ansolabehere1994; Ansolabehere and Iyengar Reference Ansolabehere and Iyengar1995; Brooks and Geer Reference Brooks and Geer2007; Clinton and Lapinski Reference Clinton and Lapinski2004; Fridkin and Kenney Reference Fridkin and Kenney2008). Since each methodology has different strengths (i.e., greater external validity versus greater control), the best available option is a strategy of triangulation. If similar findings arise from two entirely different approaches, we can be far more confident in the conclusions. While it is often impossible to undertake this kind of triangulation strategy, this study takes exactly that approach. I begin with a large-n study of self-reported turnout in actual campaigns in order to study campaign negativity. I then proceed to an analysis of a large-n experiment conducted with an Internet-based Knowledge Networks survey to examine both negativity and incivility. In both examinations, I find that men and women react differently to campaign attacks. Moreover, the second analysis allows the most likely cause of the overall differences to be further assessed.
ANALYSIS
Gender, Negativity, and Turnout in Actual Campaigns
My examination of actual elections draws upon the methodology and data used in the prominent analysis by Lau and Pomper, who published a book on the effects of negative campaigns in 2004 that expanded upon their earlier work published in a 2001 article. Overall, Lau and Pomper did not find a depressive effect of negativity in Senate campaigns for the overall population. They did control for gender in their analysis, but they did not study the interaction between gender and campaign tone. As such, while their analysis is useful for examining the overall effects of campaign tone on turnout, it needs to be reexamined in the context of gender to test the hypotheses in question here. Lau and Pomper generously made the campaign tone coding from their book available, and so this extension of their analysis is possible.
One reason the Lau and Pomper data are so valuable is because they encompass many different races in many different election years: The authors calculated the negativity of each Senate race in six separate election cycles by coding 22,000 statements by candidates and their spokespeople from news accounts of the race. A statement was coded for tone in a binary fashion (negative vs. not negative), and the negativity score for a given race consists of the percentage of negative statements out of all candidate/spokesperson statements (negative + positive) for that race. Among other validation methods, they show that their measure is significantly related to several factors that theoretically would be expected to increase the amount of negativity in a campaign.Footnote 6 The dependent variable—turnout—was measured using the standard postelection, self-reported, dichotomous, American National Election Studies (ANES) “did you vote” question. While acknowledging that measures based on media reports likely overestimate the overall degree of negativity, Lau and Pomper argue that there is no reason to expect that the level of distortion would vary across races (2004, 136–38).Footnote 7
In terms of independent variables, Lau and Pomper included a fairly standard list of participation-related control variables (whether a governor was up for election that year; whether it was an open-seat Senate election; the South; age; education; race/nonwhite; married; new in community; home owner; strength of party identification; voting age population; state turnout culture to measure baseline levels of political participation.)Footnote 8 Given that Lau and Pomper's measurement of negativity is focused on Senate races and that any effects of negativity in a subpresidential race should be more relevant to voting patterns in a midterm election year (Jackson Reference Jackson2002), all of the midterm election years analyzed by Lau and Pomper (which are 1994, 1998, and 2002) are selected for the analyses that follow.
“Campaign intensity” is the natural log of per capita total campaign spending by both major candidates, and is used as a control for campaign spending. “Campaign exposure” is a combination of campaign interest and general media exposure and functions as a control for the degree to which respondents typically follow campaign news. “Predicted closeness” is a composite of the actual outcome of the race, the “normal” partisan split in the state, and changes in the state's per capita disposable income.
Only registered voters and people from states that allow same-day registration are actually in a position to change their turnout plans in reaction to the inundation of campaign negativity in the closing weeks of a campaign.Footnote 9 As a result, the sample is limited to that critical subset of potential voters who are registered to vote.Footnote 10
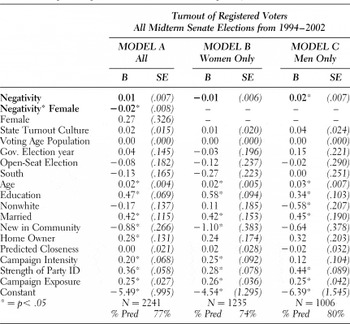
When the gender/negativity interaction is included in the model, women are found to be significantly different from men in their reactions to negativity (see Table 1, Model A). Male turnout increases relative to female turnout among registered voters as the proportion of negativity increases. Turning to the separate models for men and women, the coefficient for “negativity” for women is negative in Table 1, Model B—suggesting that women might be less likely to go to the polls as races get more negative—but it is not statistically significant (p = .15). For men, the positive and significant coefficient in Table 1, Model C, confirms the hypothesis that men become significantly more likely to go to the polls as the proportion of negativity increases.
Logistic regression results for overall negativity and turnout

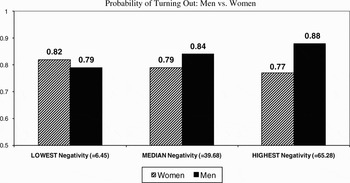
In sum, these results indicate that men and women differ significantly in their participatory reactions to Senate campaign attacks. Figure 1 shows the results from an analysis based on Table 1, Model A, which holds every variable constant at its median value except for the key variables of interest. The analysis varies “negativity” (from the lowest negativity level observed by Lau and Pomper in midterm Senate elections, to the median, and to the highest levels) and “female.” That analysis indicates that in races with the lowest negativity levels (where just 6% of campaign statements are negative), women are slightly higher than men in terms of predicted probability of going to the polls (.82 for women vs. .79 for men). For median levels of negativity (where about 40% of campaign statements are negative), a slightly larger differential in favor of men (.84 for men versus .79 for women) is seen. But it is at the highest levels of negativity (where 65% of campaign statements are negative) that one sees the biggest gender differences: a .88 probability of voting for men and just a .77 probability of voting for women.
Turnout at lowest, median, and highest negativity levels. This analysis was conducted holding all variables (other than negativity and gender) constant at their median values, 1994—2002.

These results confirm that men are mobilized by negativity, and that there is a significant difference between men and women in response to campaign tone. But to gain leverage on the likely causes of the difference and to directly evaluate whether the type of negativity makes a difference, it is critical to carefully differentiate between extremely negative messages and more moderately negative messages. In analyses of real campaigns, we cannot reliably distinguish the effects of civil negative messages as compared to uncivil negative attacks. Yet analyzing overall negativity may mask even larger and more robust differences between the reactions of men and women to campaign negativity, depending on the nature of the attack. The key unanswered question is whether extremely negative attacks produce a different reaction for men and women than more run-of-the-mill negative messages. Such a difference could wash out in an analysis like the one in the previous section, where all types of attacks are thrown together in their naturally occurring proportions. But all attacks are clearly not equal, and thus that possibility needs to be explored. When examined in that manner, some very interesting—and substantively large—differences are found between the reactions of men and women to negativity, as the next section shows.
Testing the Role of Incivility with an Experiment
The analysis in this section is based on data from an experiment I conducted with John Geer through the Time-Sharing Experiments in the Social Sciences (TESS) program (see Brooks and Geer Reference Brooks and Geer2007). In this analysis, negativity concerns whether the statement was positive (i.e., sponsor-focused, such as “Crime rates are improving in our communities today because I have supported building our local police forces”) or negative (i.e., opponent-focused, such as “Crime rates are increasing in our communities today because my opponent has not supported building our local police forces”). In other words, is the message focused on the positive attributes of the sponsor or is it focused on the negative aspects of the opponent?
All positive statements are, by definition, “civil,” but there are differences among negative messages. Uncivil messages are those that are inflammatory, gratuitous, and divisive. As in the previous example, it is not uncivil to claim that “Crime rates are increasing in our communities today because my opponent has not supported building our local police forces,” but it would be if the statement were made more inflammatory by stating that “Crime rates are increasing in our communities today because my careless and unthinking opponent has not supported building our local police forces.” Those additional words make the same message far more inflammatory by characterizing the candidate in harsher terms, but they do not add any additional substantive information about the candidate's personal behavior or issue positions.
Within the experiment, civil negative messages are the mirror image of positive messages (i.e., what I achieved versus what my opponent did not do or did wrong). And uncivil negative messages are differentiated from civil negative messages by adding two strong, pointed words (“dishonest,” “unprincipled,” “insensitive,” “heartless,” “cowardly,” etc.) to an otherwise civil negative message. The general topics of the statements were designed to be consistent with existing content analyses of campaign messages (Geer Reference Geer2006; Kahn and Kenney Reference Kahn and Kenney1999) and the messages presented to respondents are realistic—the kind of statements candidates often deliver during a typical campaign (see Appendix A for an example).Footnote 11 Various scholars have claimed that issue-based messages might have a different effect than trait-based messages, and so half of the respondents received messages focused on issues while the other half received messages pertaining to personal traits. Partisan cues that might have biased the results were eliminated. Moreover, any geographic cues were eliminated such that our respondents (who live throughout the United States) could think that the messages might be attributable to candidates in their general area.
The subjects are from a national, representative sample of 1,745 U.S. adults who are part of the Knowledge Network Internet Survey Panel.Footnote 12 The study was introduced to subjects with the following statement: “As you may know, we have elections coming up in November. There are many candidates running for political office. We would like you to read several statements made by one candidate who is running for Congress in this November's election.” The respondent was then shown three statementsFootnote 13 by a fictional candidate drawn from a total of six statements for each condition, such that the issues presented and the order of presentation were randomized for each participant in order to minimize potential bias from a particular message content or issue focus.
Studying the differential effects of negativity directed at and/or sponsored by male and female candidates on public opinion is an interesting avenue of research (Fridkin, Kenney, and Woodall Reference Fridkin, Kenney and Woodall2009; Gordon, Shafie, and Crigler Reference Gordon, Shafie and Crigler2003; Hitchon, Chang, and Harris Reference Hitchon, Chang and Harris1997) and candidate gender could conceivably interact with respondent gender in reactions to negativity. However, halving the N size to test the additional dimension of candidate gender was not sustainable for this experiment. As such, male candidates were used in this study since the median politician is still male, but attention in the future should be paid to the possibility of a three-way interaction among negativity, respondent gender, and candidate gender.
After viewing the messages, respondents were asked a series of questions about the messages themselves. Respondents were then sent to an unrelated distraction task, and asked later in the survey (about 5–10 minutes after the original messages were shown) whether they were planning to vote in the next presidential election, which was just over two months away at the time of the survey.Footnote 14 The scale ranged from 1–4, where “4” represents the greatest likelihood of voting.Footnote 15 The analyses that follow all utilize analysis of variance (ANOVA).Footnote 16
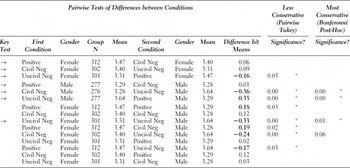
The results indicate that there are significant and substantial differences between the way that men and women react to the tone of messages in terms of their intentions to go to the polls: F (2,1739) = 11.47, p < .01. Table 2 compares the means for each condition by gender in order to test the differences between the groups. The comparisons are conducted both with a less conservative (Tukey pairwise) planned comparisons test that does not adjust for the increase in error associated with multiple comparisons, and a more conservative Bonferonni post-hoc test, which adjusts for the increased familywise error rate. The results indicate that men are disproportionately mobilized by uncivil negativity as compared to women—a difference that is substantively large and statistically significant even with the more conservative testing procedure. Women appear to be slightly more likely than men to vote after viewing civil negative messages, but the difference is not statistically significant. Women appear to be slightly more likely to vote than men after viewing positive messages, although the relatively modest difference (.18) ceases to be statistically significant when the more conservative testing procedure is used. Thus, the key gender difference—the largest substantively, and the one that is statistically significant regardless of the testing procedure utilized—resides in reactions to uncivil negativity.
Group comparisons.

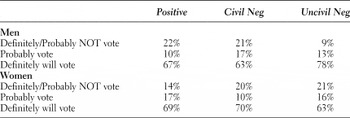
Table 3 moves away from the means used in the ANOVA and uses the percentages of men and women falling into each category to further illustrate the findings discussed here.Footnote 17 When confronted by uncivil negative messages, 78% of men say that they will definitely go to the polls to vote, while 63% of women give the same response. Another way of analyzing the results is to examine those who definitely or probably will not vote. After viewing an uncivil negative message, only 9% of men put themselves in that category (less than half as many who say that after viewing a positive or civil negative ad), while 21% of women put themselves in that category (50% more than the percentage of women who put themselves in that category after viewing a positive ad).
Responses to intended turnout question (tone by gender)

These results provide support for H2, which posits that there will be disproportionately greater gender differences in reactions to incivility. Positive and civil negative messages have relatively similar effects on men and women. It is uncivil negative messages that produce the big differences. H1 can be ruled out because there is not a progressively increasing difference between men and women as messages move from positivity to civil negativity to uncivil negativity. As such, the pattern of the results suggests that it is uncivil conflict specifically that mobilizes the turnout of men and contributes to a substantial differential between the turnout of men and women. It is important also to consider that women and men might react differently depending upon whether the attack is focused on issues or on traits. Previous scholars (including Finkel and Geer Reference Finkel and Geer1998; Kahn and Kenney Reference Kahn and Kenney2004; Geer Reference Geer2006; Kahn and Kenney Reference Kahn and Kenney1999; Lau and Pomper Reference Lau and Pomper2001 and 2004; Min, Reference Min2004; Thorson, Christ, and Caywood, Reference Thorson, Christ, Caywood and Biocca1991) have distinguished between negative ads that focus on personal traits versus those that focus on issues. While the findings from those works are mixed with respect to the overall population, the underlying hypothesis in these studies is that personal/trait-based attacks are less directly relevant to governance (and will therefore be more likely to have detrimental effects on the public than will issue-based attacks). While the results are not shown here in the interest of space, they do not indicate any differences in how men and women respond to trait- versus issue-based attacks. In a three-way model (gender by tone by issue/trait focus), the main effect of tone still stands, and the issue/trait distinction does not interact significantly with gender and tone. As such, it is incivility, rather than the substantive thrust of the message, that appears to be driving the results.
Relationship to Partisanship
Partisanship has often been thought to moderate the relationship between campaign tone and turnout overall, especially with reference to its possible effects on independents (see, for example, Finkel and Geer Reference Finkel and Geer1998; Kahn and Kenney Reference Kahn and Kenney1999; Lau and Pomper Reference Lau and Pomper2001; Stevens et al. Reference Stevens, Sullivan, Allen and Alger2008). Given the substantial gender gap in party identification and voting patterns (whereby women tend to lean in a Democratic direction as compared to men), it is important to explicitly factor partisanship into the analysis.Footnote 18
In the analysis that follows, partisanship is defined simply as whether respondents identify as “Democrat,” “Republican,” or “Independent”/“Other.” With respect to the candidates in this study, partisanship was not stated and the issues and trait measured were explicitly designed to be devoid of partisan cues. As a result, this analysis provides an opportunity to see if partisans and independents are affected differently in their propensities to participate based on campaign tone itself, and not based on possible motivated reasoning dynamics that might exist had partisanship been cued (Stevens et al. Reference Stevens, Sullivan, Allen and Alger2008).
First, excluding gender entirely, there is a significant interaction between campaign tone and partisanship in terms of turnout intention: F (4, 1736) = 2.43, p < .02. However, the relationship is substantively modest. Republicans are slightly less likely to be mobilized by incivility than by less negative messages (by less than .2 of a point on a 4-point scale), while Democrats are slightly more likely to be mobilized by incivility than by more positive messages (by less than .2 of a point). Independents are more mobilized by both positive and uncivil negativity message than by civil negative messages (again, with less than .2 of a point difference).
Adding in gender as a factor changes the dynamic. The three-way interaction among gender, tone, and partisanship is significant: F (4, 1727) = 4.44, p < .01, and the nature of the relationship is interesting. For men, incivility especially mobilizes independents relative to independents exposed to more benign messages. Male independents exposed to uncivil messages are more than .65 higher on the intended turnout measure than male independents exposed to positive messages, while being .76 higher than male independents exposed to civil negative messages. Male Democrats are also fairly energized by incivility, rising .47 higher on turnout intentions when exposed to uncivil messages than when exposed to positive messages (the difference between incivility and civil negativity is not significant for Democratic men). The intended turnout of male Republicans is not significantly responsive to campaign tone.
For women, the partisanship interaction is more subtle than for men. Female Republicans and female Democrats are not significantly responsive to campaign tone. The only notable effect is that female independents appear to be slightly more likely to vote when exposed to positive messages than to uncivil negative messages (mean difference = .4), but it is only significant at p = .08.
In short, male independents and male Democrats are heavily mobilized by the most uncivil messages, while female independents may be slightly demobilized by incivility. As a result, if a Republican candidate is known to have relatively high crossover appeal for independent and Democratic men such that higher male turnout will benefit that candidate, then incivility is likely to benefit that candidate by increasing male turnout. Incivility may also slightly decrease independent female turnout, which might have beneficial effects for the Republican candidate, depending on the particular dynamics of the race.
CONCLUSION
Both analyses in this article reveal that men and women react differently to campaign attacks. An analysis of turnout in real campaigns showed that men are more likely than women to vote when confronted by negativity in Senate campaigns. An experiment allowed the question to be refined further, revealing that no significant gender difference exists with respect to civil negative messages. A significant gender difference does exist, but it resides in reactions to uncivil negative messages. Men are far more likely than women to turn out in response to uncivil negative messages.
It is essential to point out that these findings do not suggest that women are mobilized only by positive messages, nor do they suggest that women are averse to tough campaigning. Women are not demobilized at all by negative messages that are delivered in a civil manner; in fact, such messages are as mobilizing for women as are positive messages. It is only when gratuitous insults are involved in campaigns that the turnout of men increases significantly relative to women. And the effect appears to reside mainly in the marked increase in the likelihood of turnout by men, rather than in a decreased likelihood of voting among women (women appear to be slightly less likely to say that they will vote in response to uncivil negative messages than to civil negative messages, but the difference is not significant). In other words, most of the gender gap is not due to women fleeing from conflict-oriented political communication. Rather, it is due largely to men—especially male independents and, to a lesser extent, male Democrats—being mobilized by the very harshest campaign messages relative to less negative ads.
One general implication of this study is that it is important to focus on subgroup differences in the literature on campaign tone. Almost all of the focus thus far within this literature has been on overall turnout (there has also been some attention paid to the effects of campaign attacks on independents, but beyond that, the possibility of differential effects on other subgroups has been relatively neglected). Understanding the underlying differences between groups is important: The benign effect of attacks on overall turnout that has generally been found in the literature ceases to seem quite so benign if these campaign tactics systematically mobilize or demobilize particular segments of the public. More generally, the findings from this article also have clear repercussions for the broader study of campaigns and electoral politics. For those literatures, this study has a simple bottom line: Scholars need to devote much more attention to examining gender differences among voters.
APPENDIX: STATEMENT EXAMPLES