Clostridioides difficile infection (CDI) is one of the most common healthcare-associated infections as well as the leading cause of healthcare-associated diarrhea.Reference Magill, Edwards and Bamberg1,Reference Evans and Safdar2 Accordingly, CDI is an important cause of excess morbidity and mortality,Reference Evans and Safdar2,Reference Kwon, Olsen and Dubberke3 and cases of CDI increase the cost of healthcare.Reference Kyne, Hamel, Polavaram and Kelly4 Exposure to antibiotics is the major risk factor for CDI.Reference Stevens, Dumyati, Fine, Fisher and van Wijngaarden5,Reference Brown, Khanafer, Daneman and Fisman6 However, additional individual-level risk factors have been identified, including advanced age,Reference McDonald, Owings and Jernigan7–Reference Campbell, Beere, Wilcock and Brown9 greater underlying severity of illness,Reference Stevens, Dumyati, Fine, Fisher and van Wijngaarden5,Reference Brown, Khanafer, Daneman and Fisman6 increased levels of comorbidities,Reference Stevens, Dumyati, Fine, Fisher and van Wijngaarden5,Reference Brown, Khanafer, Daneman and Fisman6 and medications designed to decrease gastric acid levels.Reference Howell, Novack and Grgurich10
In addition to individual-level risk factors, the environment, especially in hospitals, has been implicated as a risk factor for CDI. In general, CDI pressure, the increasing risk of CDI acquisition with increasing numbers of CDI patients, has been documented at both the wardReference Dubberke, Reske and Olsen11 and hospital levels.Reference Miller, Polgreen, Cavanaugh and Polgreen12 More specifically, evidence for underlying environmental CDI contamination include reports of C. difficile spores on high-touch surfaces in healthcare settings,Reference Gerding, Johnson, Peterson, Mulligan and Silva13,Reference Kim, Fekety and Batts14 patient skin,Reference Bobulsky, Al-Nassir, Riggs, Sethi and Donskey15,Reference Sethi, Al-Nassir, Nerandzic, Bobulsky and Donskey16 and hands of healthcare workers.Reference Landelle, Verachten, Legrand, Girou, Barbut and Brun-Buisson17,Reference Shrestha, Sunkesula, Kundrapu, Tomas, Nerandzic and Donskey18 In addition, C. difficile contamination increases in rooms occupied by patients with symptomatic CDI; thus, room assignments (eg, patients placed in a room with previous occupant who had CDI) are also associated with increased risk of CDI acquisition.Reference Shaughnessy, Micielli and DePestel19 Evidence that the environment is a contributor to increased risk for CDI has led to infection control recommendations for disinfection, isolation, and hand washing with soap and water, especially in outbreak settings.Reference McDonald, Gerding and Johnson20
The emphasis on the environment’s role in CDI has recently been subject to scrutiny. Whole-genome sequencing studies have shown that, at least in nonoutbreak settings, a substantial proportion of C. difficile isolates are not genetically related.Reference Eyre, Cule and Wilson21 Other work on screening asymptomatic patients for C. difficile carriage report that colonization established before hospitalization may also be an important risk factor for subsequent cases of hospital-based CDI.Reference Tschudin–Sutter, Carroll and Tamma22,Reference Bruminhent, Wang and Hu23 These results raise questions regarding the proportion of CDI attributable to the healthcare environment.
One effective approach to quantify the environment’s contribution to CDI is to measure the spatiotemporal interaction and clustering of CDI cases because such spatiotemporal clustering suggests that environmental factors may be contributing to the spread of CDI. This approach has been widely used outside hospital settings to understand risk factors for several infectious diseases.Reference Smith, Le Comber, Fry, Bull, Leach and Hayward24 However, applying this approach within the hospital is challenging due to the lack of fine-grained spatial data necessary to estimate distances between pairs of in-hospital CDI cases. In this article, we sought to determine whether the CDI cases observed at the University of Iowa Hospitals and Clinics (UIHC) exhibit spatiotemporal interaction and clustering after adjusting for effects that are either purely spatial or purely temporal.
Methods
Our analysis was based on a fine-grained dataset we assembled on operations at the University of Iowa Hospitals and Clinics (or UIHC, a 700-bed comprehensive academic medical and regional referral center in Iowa City) from January 2005 through December 2011. The dataset contains both architectural and in-patient data: admission, discharge, and transfer records; diagnostic codes; and clinical test results. We constructed the set of CDI cases for in-patients by extracting (1) the date of positive CDI diagnosis and (2) the patient’s room in the hospital at the time of positive CDI test. CDI diagnosis was determined via laboratory test. A C. difficile toxin test was used during January 2005–April 2008; a C. difficile toxin A and B test was used during May 2008–December 2009, and a C. difficile toxin PCR test was used thereafter. Formally, a CDI case can be viewed as a triple (p, r, d) where p is a patient, r is a room in the hospital, and d is a day in the period (January 2005–December 2011) such that patient p tested positive for CDI on day d while occupying room r. Our dataset included 1,963 total CDI cases.
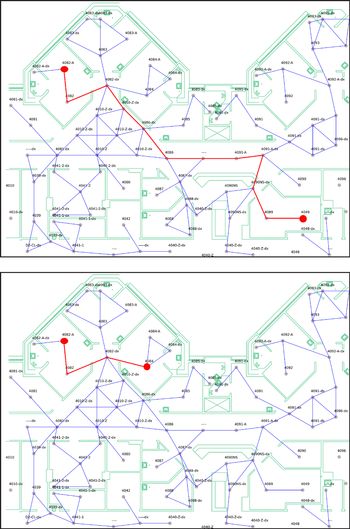
To determine whether these CDI cases exhibited spatiotemporal interaction and clustering, we sought to accurately estimate the distance between pairs of rooms in the hospital. Starting with architectural drawings, we “discretized” the UIHC hospital space and constructed a hospital graph. The results from this discretization process have also been reported elsewhere.Reference Curtis, Hlady, Kanade, Pemmaraju, Polgreen and Segre25 Each room in the hospital is represented by a node (larger spaces, such as hallways, are subdivided into smaller room-sized polygons represented as individual nodes), and edges (or hops) are added between pairs of nodes corresponding to spatial units between which direct physical passage is possible. Each edge (hop) corresponds to a walking distance of 5–6 m. Edges respect architectural barriers (eg, walls), so 2 adjacent rooms that do not share a doorway are not connected by an edge. The hospital graph comprised 18,961 nodes and 23,442 edges. The hospital graph imposes a distance metric on the UIHC space, and distances along the shortest paths in this graph correspond to the shortest walking distances in the UIHC space (Fig. 1).
Each path in the hospital graph from a node s to a node t corresponds to a valid walking route in the hospital from the spatial unit corresponding to node s to the spatial unit corresponding to node t. For example, the top figure shows 2 rooms, 4082-A and 4049, whose shortest path distance in the UIHC graph is 11 hops (a hop is an edge in the hospital graph). The bottom figure shows rooms 4082-A and 4084, whose shortest path distance in the UIHC is 3 hops.

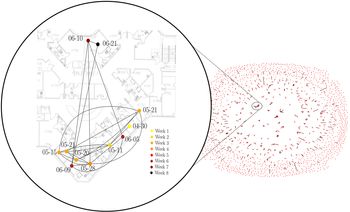
Our analysis was based on spatiotemporal interaction and clustering tests, all of which correct for solely spatial or solely temporal effects. Among these tests, 3 were performed using a CDI case proximity graph, consisting of nodes representing CDI cases and edges connecting 2 nodes if they occurred within T days and within distance D in the hospital graph of each other, where T ≥ 0 and D ≥ 0 were integer parameters (Fig. 2).
 $CPG_{(14,5)}^{CDI,obs}$: CDI case proximity graph for T = 14 days and path length of D = 5 (
 $\le 30$ m). The graph contains 1,963 nodes, corresponding to CDI cases at the UIHC during January 2005– December 2011. Its 682 edges correspond to pairs of cases occurring with 14 days and distances of no more than 5 hops (
 $ \le 30$ m) from one another. The resulting CDI case proximity graph contains 1,519 components, 1,229 of which are single nodes. The mean component size is 1.29 and the maximum component size is 11. A component of size 11 is enlarged and shown on the left. The CDI cases in this component occurred over a roughly 2-month period (April 30–June 21, 2010) in the GMed (4JPE) unit; 9 of these cases occurred in a “pod” of 7 adjacent patient rooms, whereas 2 occurred in a single-patient room in a separate “pod.”

We used the Knox test to compare the observed number of pairs of CDI cases that occurred both within T days and within distance D of each other to the distribution of the number of pairs of cases within these time and distance thresholds of each other, conditioned on the absence of spatiotemporal interaction.Reference Knox26 In other words, we compared the number of edges in the observed CDI case proximity graph, denoted  $CPG_{(T,D)}^{CDI,obs}$, to the distribution of the number of edges in a random CDI case proximity graph denoted
 $CPG_{(T,D)}^{CDI,rand}$. To calculate this distribution, we ran Monte Carlo simulations with the time stamps of cases randomly permuted. Notably, permuting the time stamps left purely spatial correlations and purely temporal correlations intact while disrupting the joint spatiotemporal structure. We used extensions of the Knox test to explicitly test for other aspects of spatiotemporal structure. To test for burstiness, an important facet of infection diffusion involving periods of significant activity followed by periods of inactivity, we implemented the mean component size test.Reference Takaguchi, Masuda and Holme27,Reference Akbarpour and Jackson28 A component in the CDI case proximity graph is a maximal set of cases that are all reachable from each other via paths composed of edges in the graph. A graph can have many components, and in the mean component size test, we compared the mean size of components in
 $CPG_{(T,D)}^{CDI,obs}$ to the distribution of mean component size of
 $CPG_{(T,D)}^{CDI,rand}$. As in the Knox test, we used Monte Carlo simulations with the time stamps randomly permuted to calculate these expectations. The maximum component size test was similar (see Appendix A online). Finally, we also performed the Mantel test,Reference Mantel30 in which we computed the Pearson correlation between the spatial and temporal distance matrices of the CDI cases and compared this with the correlation between a randomly permuted spatial distance matrix and the (unpermuted) temporal distance matrix. If the 2 observed distance matrices had high correlation, then randomization would result in correlation that was consistently smaller.
As a counterfactual experiment, and as a “stress test” for our approach, we repeated all of the tests just described on aspiration pneumonia, a complication that occurs when food, stomach acid, or saliva are inhaled into the lungs. Because aspiration pneumonia is not infectious, we expected to see very different results for aspiration pneumonia than for CDI. For the 6-year period between January 2007 and December 2013, 790 aspiration pneumonia cases were reported at UIHC. Unlike CDI, however, hospital records associate aspiration pneumonia with a hospitalization rather than a precise date of onset. Therefore, we used hospital prescription data to yield a proxy for an onset date. Starting from the list of antibiotics commonly used to treat aspiration pneumonia,Reference Bartlett31–Reference Bowerman, Zhang and Waite33 we defined the onset of aspiration pneumonia as the first time one of these antibiotics (Table 1) was prescribed for a patient diagnosed with aspiration pneumonia. This method yielded a total of 535 distinct aspiration pneumonia cases with associated time stamps; patient rooms were then determined based on the time stamps and were used to construct the observed aspiration pneumonia case proximity graph  $CPG_{(T,D)}^{AP,obs}$.
Most Frequently Prescribed Antibiotics, Sorted by Frequency, for Patient Visit Records Marked with the Aspiration Pneumonia Complication Code During 2007–2013a

a A total of 790 patient visits were coded with aspiration pneumonia. Because some patients were prescribed >1 antibiotic from the list, the sum of the prescriptions (996) exceeds the number of aspiration pneumonia codes.
Results
Our preliminary inspection revealed that CDI cases did exhibit some spatial clustering; certain medical units such as general medicine, oncology, and the medical intensive care unit (MICU) had many more CDI cases than others, such as neurology. Spatial patterns may also have occurred in CDI cases due to number of beds per room. Of the 709 patient rooms at the UIHC, 342 are singles, 280 are doubles, 68 are triples, and 19 are quads or larger. We verified that our UIHC CDI cases did not exhibit seasonality, even though case counts at the regional and national level do.Reference Polgreen, Yang, Bohnett and Cavanaugh34 Finally, an important temporal variation in the number of CDI cases was due to a change in the CDI test from C. diff toxin A and B to C. diff toxin PCR in December 2009, which significantly increased apparent CDI rates. However, because our tests control for purely spatial and purely temporal correlations, this variation should not have affected our results. No substantial or hospital-wide changes to infection control policies (eg, contact isolation policies or room cleaning policies) occurred during the study period.
We ran the Knox test with time thresholds T = 7, 14, and 21 and distance thresholds D = 2, 3, 4, and 5. The results for T = 14 (Fig. 3, left) show that the observed number of pairs of CDI cases that were simultaneously close to each other, both in space and in time, were consistently larger than all of the corresponding expected values obtained in simulation (P < .0001 in all cases). For example, for T = 14, D = 2, the observed value is 287 (shown by the blue dot) and the value obtained in simulation has distribution shown by the box whisker plot (mean, 157.902; SD, 12.5193). This result is a rejection of the null hypothesis of no spatiotemporal interaction among CDI cases. The results are strikingly different for aspiration pneumonia (Fig. 3, right). In all 4 cases shown for T = 14, the observed number of aspiration pneumonia case pairs that are proximate both in space and time was no greater than the expected number of proximate aspiration pneumonia case pairs over the 20,000 time permutations. These results indicate a clear spatiotemporal interaction for CDI, but none whatsoever for aspiration pneumonia.
The Knox test for CDI (left) and aspiration pneumonia (right) are shown for time threshold T = 14 days, and distance threshold D = 2, 3, 4, and 5 hops. The test results were derived from 20,000 random permutations of the time stamps of the cases. The box plots show the distribution of the Knox test statistics, and the blue dots correspond to the Knox test statistics on the observed data. There is a striking difference in the results for CDI and aspiration pneumonia.

We next present results from the mean component size and the maximum component size tests on  $CPG_{(T,D)}^{CDI,obs}$ for T = 7, 14, and 21 and D = 2, 3, 4, and 5. For T = 14 and all D = 2, 3, 4, and 5 (Fig. 4, left) the observed mean component sizes were larger than the corresponding mean component sizes for all 20,000 permutations (thus, by definition, P = 0 in all cases). For example, for T = 14, D = 2 (Fig. 4, left) the observed mean component size was 1.11661 (shown as a blue dot), and this value was larger than the complete distribution (shown as box whisker plot) of mean component sizes (mean, 1.06513; SD, 0.00571) obtained via simulations. This result is a rejection of the null hypothesis (with P < .0001) that there is no spatiotemporal clustering of CDI cases. In contrast, for aspiration pneumonia, the observed mean component sizes in
 $CPG_{(T,D)}^{AP,obs}$ mostly appear in the lower half of the estimated distribution of mean component sizes of random
 $CPG_{(T,D)}^{AP,rand}$ (Fig. 4, right). These results imply significant spatiotemporal clustering of CDI cases, but none for aspiration pneumonia, at least as measured by mean component sizes in the case proximity graphs. The results for the maximum component size test appear in Appendix A (online).
The mean component size test for CDI (left) and for aspiration pneumonia (right) are shown for time threshold (T = 14 days) and distance threshold (D = 2, 3, 4, and 5 hops). The test results were derived from 20,000 random permutations of the time stamps of the cases. The boxplots show the distributions of the test statistics obtained from the random permutations and the blue dots corresponds to the test statistics on the observed data.

Finally, we applied the Mantel test to compare the correlation of the temporal distance matrix with the spatial distance matrix for the observed data to the distribution of correlations obtained from randomly permuting the spatial (but, not temporal) distance matrix, 20,000 times. For CDI (Fig. 5, left), the Pearson correlation coefficient of the temporal distance matrix and the spatial distance matrix is far to the right of the mean correlation obtained by permuting the spatial distance matrix, rejecting the null hypothesis of no spatiotemporal correlation with P < .0003. In contrast, the corresponding test for aspiration pneumonia (Fig. 5, right) yields an observed Pearson correlation coefficient of 0.007, not far from the mean (0.006) of the distribution of correlations with 1 matrix randomly permuted (P = .452).
Pearson correlation coefficient (0.01924, black line) for the spatial and temporal distance matrices of CDI cases in comparison with the distribution of correlation coefficient (mean is the red line), when one of the matrices is permuted randomly. The plot is the result of randomly permuting the matrix 20,000 times. The figure on the right shows the results of the same computation for aspiration pneumonia cases.

Our tests yield substantively similar results for T = 7 and T = 21 with D = 2, 3, 4 and 5. These results are summarized in Appendix B (online).
Discussion
The importance of hospital design and room assignments have been previously cited as factors in the transmission of infectious diseases.Reference Shaughnessy, Micielli and DePestel19,Reference Stiller, Salm, Bischoff and Gastmeier35,Reference Dettenkofer, Seegers, Antes, Motschall, Schumacher and Daschner36 However, only a small number of studies in the literature have focused on the spread of infection and outbreaks within healthcare facilities.Reference Smith, Le Comber, Fry, Bull, Leach and Hayward24 Such studies are hampered by the difficulty of defining spatial relationships inside healthcare institutions, where architectural features, (eg, walls, elevators, nurses’ stations) make it complicated to compute distances between cases. A peripheral contribution of this paper is to point a way forward, using distances computed from readily available CAD drawings of healthcare facilities.
Our results help bridge 2 categories of CDI investigations, those that implicate the environment in the spread of CDIReference Dubberke, Reske and Olsen11,Reference Shaughnessy, Micielli and DePestel19 and those that report that a substantial proportion of CDI cases are genetically unrelated,Reference Eyre, Cule and Wilson21 thereby discounting environmental factors. Our results, obtained from a variety of spatiotemporal statistical tests, provide compelling evidence that spatiotemporal interaction as well as clustering occur among CDI cases at the UIHC. These results suggest that environmental factors are in play. On the other hand, our case proximity graphs contain many connected components (for various T and D values), each with a relatively small maximum size component. Specifically, overall T and D values considered, the largest maximum component size was 13 (~0.66% of the number of cases). Thus, our results are not inconsistent with the possibility of many genetically unrelated cases, with relatively small outbreaks.
Our results hold despite routine infection control precautions and environmental cleaning practices in place at the UIHC (eg, patients admitted with diarrhea are placed in contact isolation). We verified that placement of patients does not cause additional spatiotemporal interaction or clustering by verifying that our results held even when we defined CDI cases as patients with positive CDI test at least 48 hours after admission (Appendix D online).
In future work, we plan to use whole-genome sequencing to investigate whether genetically related strains of CDI are more common within space–time CDI clusters than among cases that do not cluster. Notably, in at least 1 investigation,Reference Rexach, Tang-Feldman and Cohen37 clusters of genetically related CDI cases did not correspond to clusters of CDI case identified by spatiotemporal tests. However, a much closer look at this connection (or lack thereof) is needed. More specifically, this particular studyReference Rexach, Tang-Feldman and Cohen37 was conducted in the somewhat unique environment of a pediatric hospital, and results in other hospital settings may differ. Results may also vary in time: during periods when CDI is endemic, environmental factors may be insignificant, whereas during periods of outbreak they may be significant. Another direction of future work is incorporating connections between patients via shared healthcare workers.Reference Hornbeck, Naylor, Segre, Thomas, Herman and Polgreen38 Thus, joining clusters detected from case proximity graphs to staffing records could help us better understand and quantify the role of healthcare workers in the transmission of healthcare-associated infections.
Our study has several limitations. First, due to the retrospective nature of this study, we were not able to perform genetic sequencing of CDI cases within and outside of clusters, which will be a future extension of our work. Second, we were unable to incorporate other sources of information into this investigation (eg, staffing patterns, patient trajectories through the hospital). However, in future work, such covariates could be incorporated into space–time tests. Finally, onset of CDI infectivity may precede the date of a positive CDI test. It may be important to incorporate this type of uncertainty to obtain more robust spatiotemporal tests.
In conclusion, through a variety of statistical tests, we have shown that CDI cases at the hospital during January 2005–December 2011 exhibit significant spatiotemporal interactions and clustering. In contrast, aspiration pneumonia cases in a similar time frame do not show any spatiotemporal interactions or clustering behavior. Together, these results strongly suggest that environmental factors play a significant role in the onset for some cases of CDI. Finally, in addition to CDI, our approach could be extended to other infections within the hospital and even non-infectious outcomes with localized environmental factors (eg, falls, medication errors).
Acknowledgments
The authors acknowledge feedback from other University of Iowa CompEpi group members, especially Talal Riaz, for help creating and visualizing hospital graphs.
Financial support
This project was funded by the Centers for Disease Control and Prevention (CDC) MInD-Healthcare (cooperative agreement no. U01CK000531).
Conflicts of interest
All authors report no conflicts of interest relevant to this article.
Supplementary material
To view supplementary material for this article, please visit https://doi.org/10.1017/ice.2019.350