




No CrossRef data available.
Rediscovering the analysis of interconnected decision areas
Published online by Cambridge University Press: 29 April 2005
Abstract
The method known as the analysis of interconnected decision areas (AIDA) has been in use for nearly 40 years, but has made little headway into engineering design. This paper describes an implementation of AIDA that is useful to engineering designers wishing to combine the solution principles of various subfunctions within a product in new ways. Traditionally, the method is used to understand how one decision affects the options available to other decisions in a large-scale project. The method is to be used interactively with designers participating in a brainstorming session so that ideas are added to AIDA and immediately combined with other compatible ideas. The existing implementation has been tested in a classroom setting in which upper level undergraduates have successfully used the AIDA method along with numerous of design methods to solve conceptual design problems.
Information
- Type
- Research Article
- Information
- Copyright
- © 2004 Cambridge University Press
1. INTRODUCTION
There is a commonly held belief that the essence of creativity is the discrepancy between preconceived expectations and the unexpected results. If the unexpected results meet or exceed the preconceived expectations then they are considered creative, otherwise they are fully rejected (Gero, 1996). Often in the design of engineering artifacts, new innovations, or sparks of creativity occur as the result of an advance in a new manufacturing process, as a result of a technological breakthrough, or from simply a new combination of existing technologies and processes. This paper brings the method known as analysis of interconnected decision areas (AIDA) to engineering design, which we believe can greatly facilitate this third obscure form of innovation. AIDA has been used since 1965 as a systematic approach to managing complex problems. The approach is currently widely utilized and published in the urban planning community, but we have found that it is a useful technique for engineering design. Although the method is used to make sense of the dependencies between decisions, we have found that designers can use this method to arrive at new solutions, thus enhancing the creativity of their design process.
The paper describes the AIDA method and discusses our implementation of the method and its use in engineering design. The method does not automatically create solutions, but rather works interactively with the user to identify new potential solutions. Furthermore, the method can be performed with a group of designers in a brainstorming session to provide basic bookkeeping and to spur new solution ideas. To date, we have been teaching the AIDA method to senior mechanical engineering students for two semesters, but the implementation of AIDA has only been operational in the latter half of the past summer semester. In this paper, we discuss the foundation of the AIDA method, its position in engineering design, and the results from am recent implementation and classroom exercises
2. BACKGROUND
AIDA originated from a study of building history design undertaken as part of research at the Institute for Operational Research (Harary et al., 1965). It was later extended from the field of architecture to cover projects involving engineering design and city planning (Luckman, 1967) after it was found that decisions could be taken more swiftly and meaningfully if the interrelations between the decisions were described early in the decision making process (Rusholme, 1966). Soon after, Friend and Jessop (1969) formally described the AIDA process for the purposes of city planning and introduced the concepts of time-dependent and time-delayed choices. Friend, Power, and Yewlett (1974) later created a theory for the evaluation of alternatives under uncertainty. Finally, many researches have called for the AIDA technique to be fully modeled and implemented by computers as a means of facilitate creative design within design teams (Luckman, 1967; Hickling, 1978; Jones, 1980; Friend & Hickling, 1987; Bryant, 1989), yet until recently, computing has not been accessible enough to make this idea a reality. This paper introduces the first known implementation of the AIDA process in software, thus facilitating decision makers in hypothesizing and developing creative solution concepts.
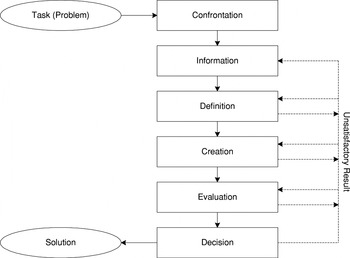
The process of design has been characterized as a systematic process, using analytical techniques, to determine a solution to a given problem. In analyzing the process of design, Pahl and Beitz (1996) found, given the complexity involved in any multifaceted design, that not adopting a procedural methodology would leave designers with an unmanageable number of possible approaches. As such, they introduced a formal heuristic for the general design process. The general process links the initial understanding of the problem to the final artifact through various activities (see Fig. 1). Each activity is linked to its successive activity through the condition that one should not pass to the next activity until the initial one is fully completed.

The general process for finding solutions (Pahl & Beitz, 1996).
In every design process, the first step is to confront the problem, examining the situation to determine its true nature. The intensity of this analysis depends on the level of understanding of the issues and the experience the designers have with the problem. Then, designers gather information on the problem at hand, including the requirements and constraints that the solution should meet. After which, a detailed problem definition can be made. This problem definition ensures that designers do not needlessly pursue a solution to something that is not, in fact, the true issue. Next, designers will use various techniques to create a solution and evaluate a solution. Finally, they will decide whether to implement the solution based on the specifications gathered during the information stage. Designers must repeat the process in each successive phase of the design process until the designers arrive at a solution that they deem appropriate.
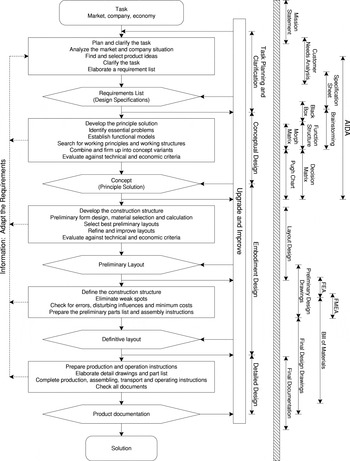
Given this understanding of the design process, one can further examine a generalized flow of work, as described by Pahl and Beitz (1996), to understand how various design techniques relate to one another (see Fig. 2). As the figure shows, most design methods are applicable to one specific stage of the design process. One great advantage to using the AIDA approach is that it can be carried out in tandem or instead of several other techniques throughout the general process of design. Specifically, AIDA can be used to aid in defining the problem, creating a sample of applicable design solutions and evaluating these solutions against defined metrics.

The steps of the planning and design process (Pahl & Beitz, 1996).
In the early stages of design, designers can use AIDA to examine their decision environment. Although there are techniques for determining the range of valid decisions, AIDA is the only technique that we are aware of that can be used to specifically show the interdependencies and relations between these decisions. In other words, AIDA allows decision makers to define the specific relationships that couple design decisions. Although this issue of exploring the interdependencies within the design process coupled with the overall look of the AIDA matrices may remind researchers of design structure matrices (DSM; Eppinger et al., 1994), AIDA is markedly different. Specifically, DSM allows decision makers to relate the dependencies of different design tasks with respect to time (i.e., which task needs to be completed before other tasks), and AIDA relates the dependencies among specific design choices to define which specific choices are, in fact, available to the decision maker. This, in and of itself, makes AIDA a powerful technique in defining the solution space, especially when there are a multitude of seemingly independent, yet interrelated, decision that designers face.
Yet AIDA offers more, in that it can be used with brainstorming techniques to link solutions of different areas to form new, creative solution combinations based solely on compatibility and feasibility, rather than the designers preconceived notions of the final solution. Thus, AIDA resembles morphological approaches to design, but with the difference that in AIDA, the subsolutions are meant to include only the feasible, rather than merely the conceivable concepts (Jones, 1980).
Not only does using AIDA allow designers to create new, potentially innovative solutions, but it also allows decision makers to evaluate these solutions based on predefined metrics. While in the final stages of the AIDA process the technique markedly resembles previously established decision techniques, such as Pugh charts and decision matrices, the AIDA process itself has the distinct advantage of directly outputting a “decision matrix” for evaluating the entire set of feasible solutions (Jones, 1980; Pugh, 1990; Otto & Wood, 2001). The main advantage to using AIDA's evaluation method is that it allows one to rate the value of specific choices independently of each other and then independently calculates the total “worth” of each feasible combination. Meanwhile, previously established evaluation techniques require decision makers to evaluate an entire concept, which may be difficult to do when one is combining design choices in new ways. However, if it is desired, one can replace AIDA's evaluation stage with any other preferred or more familiar evaluation technique with only little loss of information.
Previously, the main drawback to using AIDA was the amount of processing required, as complicated problems are very tedious to navigate manually. However, with the advent of computing power, we have created a Web-based, implementation of AIDA that allows users to explore the decision area as defined in Sections 3.3, 3.4, and 3.5 using DHTML and JavaScript. This program can be used to generate and evaluate hundreds of solutions at once, allowing decision makers to modify designs and see the results of these modifications in real time.
3. AIDA: THE METHOD
In the early stages of design, designers will formulate the specifications and constraints through various methods, as discussed in the previous section. It is here, however, that many designers, especially ones with little prior experience in the field, face a daunting task of organizing their requirements (Luckman, 1967). Because of the intricacies that are inherent to most design tasks, designers are left to make assumptions so as to reduce complexity, and therefore their search space. Unfortunately, the issues are usually interrelated and dependent, meaning that the reduction process can lead to inconsistencies and losses of valuable information. It is in this arena of interdependence that the AIDA process flourishes, as it is a systematic approach to organizing and relating different decisions within the design space. Moreover, AIDA offers a heuristic for determining the compatibility of various design decisions and even methods for assessing the final design decision combinations against predefined performance metrics.
One of the interesting characteristics of AIDA is that it does not matter whether the decision areas representing the choices are defined broadly or narrowly, generally or specifically (Hickling, 1978). As such, it offers a means of opening up the process of problem structuring to participants who may see the elements of a decision situation from quite different professional or representative perspectives, meaning that various kinds of professionals can evaluate different aspects of a design based on their separate expertise (Friend & Hickling, 1987). However, in practice, this generality is achieved at a cost, because users are often forced to accept drastic simplifications when striving to represent complex design decisions. Nonetheless, even this cost can be lessened by the aid of computer assistance, allowing decision makers to define and examine a complex search space.
Computer assistance pays off when the decision space is very large and when the chances or consequences of arriving at a poor decision are high (Luckman, 1967). However, it should be made clear that we do not intend for the designer to be superfluous and idle, while a computer solves the problem. Instead, we suggest that decision makers follow a systematic exploration of the decision environment with the aid of a computing agent that is used to perform organizational and computational tasks, thereby granting decision makers the luxury of time. It is in the following sections that we describe the full AIDA process.
3.1. The concept of decision areas
The first step is to define the decision area as an element of the problem where a choice between various acceptable answers is needed. This concept offers a method of organizing and labeling the problem space. As most designers already know, the various decisions needed in a design problem or any other large project can be quite diverse. Although the definition of decision areas will depend on the discipline in question, decision makers can view them as the highest level design choices that can be made independently of other choices. For example, a product designer may use the concept of decision areas to distinguish between functions that a design must provide, while a project manager planning to roll out that same product may see the decision areas as choices that must be made along the design process. In each case, the particular decision areas are specific to the particular context of the problem under examination; for the product designer, they may be used to describe and explore specific design alternatives for the particular product; meanwhile, the project manager may use the concept of decision areas to distinguish between the choices that affect the design, manufacturing, and distribution of said product. Decisions within this context are more specific than how originally defined by Pahl and Beitz (1996) in the problem-solving flowchart shown in Figure 1, where a decision is simply the final step of committing to resources and taking action.
Once a set of decision areas is compiled, even tentatively, it usually becomes clear that many are interconnected, meaning that most decisions should be made with reference to one another, and thus, should be considered jointly. This is because there is a belief that the decisions that would be made for each decision area separately would not be the same as those that would be made if interconnected decision areas were considered in concert.
3.2. Links between decision areas
Although it is theoretically possible to deal with all decisions together, it is often very difficult for the human mind to grasp the significance of many variables and the interrelationships involved in a complex decision involving many dependencies (Hickling, 1978). As such, it is often easier to deal with these interdependencies by creating a set of multiple decision areas, with relationships that need to be explicitly defined.
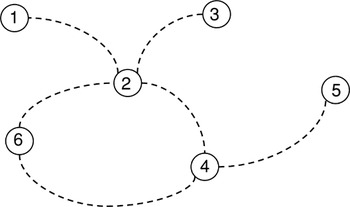
One can represent decisions and their dependencies as a graph (see Fig. 3). The nodes of the graph represent the distinct decision areas, while a line represents interdependence between two decision areas. These arcs are referred to as “decision links,” and represent a mutual relationship between the two areas; meanwhile, the absence of a link represents a supposition that the decision can be dealt with independently (Friend & Hickling, 1987). The nodes and arcs result in a topographical map of the decision space described as a “Decision Graph” (Friend & Hickling, 1987). Users should take great care to avoid thinking of this as a directed graph, with some decision preceding others; instead, one should note that any ordering of decision could stem from the structure of the graph (Luckman, 1967). It is important to note that dependencies are not defined as transitive. In other words, even if there is a dependency between one element and a second and the second element and a third, this representation does not define dependence between the first and the third elements. To link decision areas in this manner would neglect the subtleties of indirect dependencies; AIDA requires that users directly define such dependencies if such issues are of concern.

An example of a decision graph with six decision areas.
In this case, decision area two in Figure 3 is defined as being related, or dependent, on all other decision areas except decision area five. Moreover, decision area six is independent from all decision areas except decision areas two and four. However, the decision graph is not an end unto itself, but is rather an exercise for defining the interrelationships that make up the entire decision space under examination; in this example the decision graph appears trivial, but in complex problems the strategy graph will be a powerful tool in organizing and representing the decision space. Decision graphs derive their value from the picture they present about the structure of interconnectivity between elements of a complex problem (Friend & Hickling, 1987).
3.3. Options within decision areas
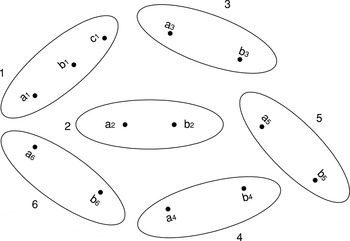
Although a decision graph is useful in defining the dependencies between decision areas, it does not clearly define the nature of the dependencies between the corresponding linked decision areas. To achieve this, one must explicitly define the choices that are available within each decision area. Decision options form the next “core” concept in the strategic choice vocabulary, and are used to describe any one course of action within a decision area, out of whatever range of possibilities may be seen as available (Friend & Hickling, 1987). Using ovals, rather than points, to represent decision areas, one can expand the decision graph shown in Figure 3 to include various options. Figure 4 shows an example of a six decision areas, with a, b, c and appropriate numbers as options within the decision areas.

A decision space with various options.
3.4. Exploring compatibility
Once options have been defined, the issue of managing the options based on the dependence of the decision areas arises. As in the case with the decision graph, lines can be drawn between the decision areas to represent dependencies. However, instead of being between decision areas, the lines, referred to as option links, connect the specific options within different decision areas. The lines between represent an incompatibility between the option in one decision area and the option in an adjacent decision area.
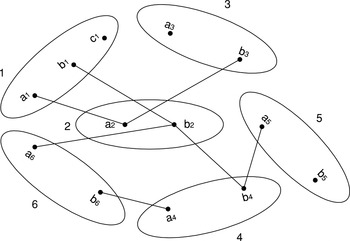
By adding option links to the decision areas, shown in Figure 5, an option graph is created, wherein one can see that a2 is not compatible with a1 or b3, whereas b1 is not compatible with b2, and c1 is compatible with all options outside of its decision areas. Although Luckman originally defined option links as existing where choices in decision areas were compatible, the resulting option graphs become too crowded with lines to follow easily (Luckman, 1967). As such, this newer definition based on incompatibility is also more logical, because the absence of links between two decision areas implies independence. Moreover, the option links can be added gradually as incompatibilities are determined, resulting in an open means of building a picture of the system, especially where there are several participants with different insights. Such differences can be used as a point of departure in working toward a clearer shared understanding of the structure of problem (Friend & Hickling, 1987).

An example option graph. The links represent incompatibilities, rather than dependencies as in Figure 3.
It is expected that the new graph of options will bear some resemblance to the previously constructed decision graph, as each of the option links results from the dependencies of the decision areas. However, there will not always be a direct correlation, as in the case where a group later discovers new dependencies based upon the incompatibilities of certain options. Moreover, decision areas may be seen as dependent not only because of incompatibilities, but also because certain combinations of options may result in advantages or disadvantages in terms of performance metrics. As such, this option graph should not be seen as a replacement for the decision graph, as both exercises independently aid decision makers in creatively exploring the decision space and may result in different insights.
The problem of analyzing an option graph lies principally in its combinatorial nature, as having only a few decision areas and options can lead to a rather complex problem to solve manually (Luckman, 1967). This is due to the nature of the complexity of an option graph; while some feasible sets may be easily identified (e.g., c1, a2, a3, a4, b5, a6, because many of its options are compatible with all other options), most are difficult to recognize, especially as the option graph becomes increasingly complex. As such, Jones introduced a more robust and easily computable method for organizing the compatibility data, the “interaction matrix” (Jones, 1980). Similar to the decision matrix and Pugh chart methods, the interaction matrix is not a mathematical matrix. Rather, it is an organizational tool used to relate the compatibility of various options between one another.
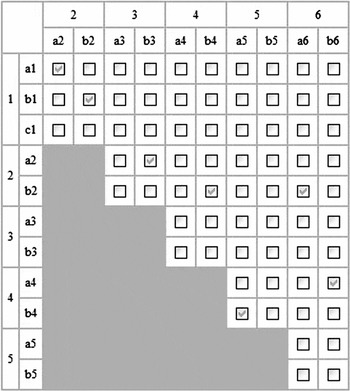
The matrix lists the decision areas under inspection, from the preceding example (1–6) on both the rows and columns (see Fig. 6). Then, each decision area's available options are listed within the columns and rows encompassed by corresponding decision areas. Thus, intersections between the options in a row and the option in a column relate the compatibility, or incompatibility, of the two options; each relationship of compatibility between a pair of options from different decision areas is indicated by a check in a particular cell of the table. The matrix is left blank in areas that refer to options within the same decision area (e.g., where a1 would intersect with b1, as both are from decision area 1) or to redundant combinations (e.g., a1b2 is equivalent to b2a1, even though they are placed on either side of the diagonal divider). To simplify the figure, we have removed many of the blank areas from the example.

An example interaction matrix where the incompatibilities are marked with checks.
As in the case with the option graph, decision areas can easily be added by simply extending the triangular matrix in a stepwise fashion, until each pair of decision areas within the problem focus is covered (Friend & Hickling, 1987). The main advantage to interaction matrix is that it allows designers to systematically progress through the decision areas and relate the full breadth of compatibility. Moreover, with the advent of computing technology, the matrix can be adjusted on the fly, quickly changing decision areas, options, and compatibility relationships, which are changes that could leave an option graph jumbled and unmanageable.
3.5. Determining compatible sets
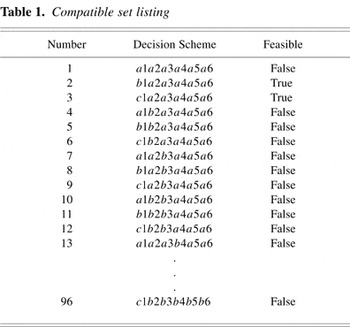
From this stage, all that remains is to determine the feasible solutions of the problem. At this point the term “compatible set” is introduced. A compatible set describes any combination of options, one drawn from each of the decision areas, which is feasible in the sense that it does not violate any of the compatibility rules included in the current formulation of the decision problem (Friend & Hickling, 1987). Even with only a few option links on the option graph or interaction matrix, it can be very difficult to ascertain all of the various compatible sets by observation alone. For example, could you tell that there were exactly 8 feasible compatible sets out of the possible 96 possible combinations available within the preceding example? As such, it is necessary to systematically examine the feasibility of each combination of potentially feasible options within either the graph or matrix representation. It should be noted that there is no need for the decision makers to provide their judgement at this point, as all that remains is a sorting challenge based upon the designer's previously made decisions.
There are several ways to arrange the search space to arrive at the final list of compatible options. Perhaps the simplest of which is to list out all the possible combinations (see Table 1). This process is the simplest because it requires little or no analysis. However, it can become far too time consuming if the list of decision areas or options grow above four.
Compatible set listing

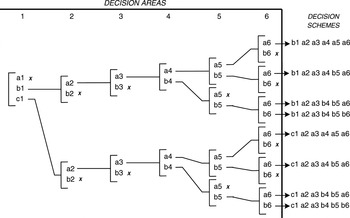
Perhaps a slightly more complicated, yet often more insightful method of organizing the search space is to separate the combinations into a treelike structure. In Figure 7, the various feasible combinations of options from the six decision areas are built up through a systematic branching process, often referred to as a decision tree (Mitchell, 1997). In this diagram, many branches cannot be followed because they are incompatible with the previously chosen options. The combinations are presented in a treelike structure, similar to decision trees used in other systematic forms of decision analysis. Based on their case studies, Friend and Hickling (1987) found that sometimes there will be only a few feasible compatible sets or none at all, while on other occasions there were too many feasible sets to examine without further filtering. Continuing with the preceding example, the decision tree shows that there are eight feasible compatible sets.

An example decision tree.
In this example, the closed branches are terminated with a cross and omitted, allowing for the range of available choices to be presented in a more compressed form. Design teams have found the process of working systematically through branches of a tree to provide important opportunities for learning, allowing designers to observe patterns and further analyze previously made assumptions and their repercussions. However, as mentioned before, a detailed analysis of the decision space as the number of decision areas and options increase can become unwieldy, as the number of potential compatible sets increases in an exponential fashion with increasing decision areas and options. In such cases, computer methods can be very helpful, aiding in the search and maximizing the creativity of designers. Our implementation of the interaction matrix is the first known computational approach to AIDA that our research has uncovered (see Fig. 6).
3.6. AIDA matrix
After having determined the set of viable compatible sets, all that remains is to choose one scheme that best meets the requirements and constraints. At this point, a traditional decision method, such as a decision matrix or a Pugh chart, could be used to determine which compatible sets best meet design requirements (Pugh, 1990; Otto & Wood, 2001). However, the AIDA technique has even more to offer, in that it too presents a method for choosing between the feasible sets.
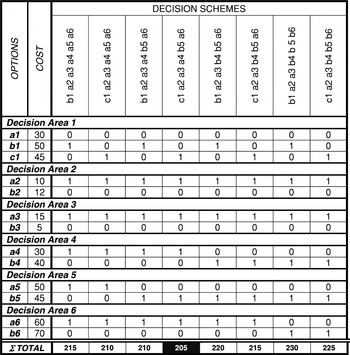
In some cases, the various decision options can be considered and evaluated independently based on the same engineering metric, a single quantifiable criterion of choice (e.g., cost, weight, etc.). In such instances the AIDA matrix can be used to evaluate each of the compatible sets based on an evaluation of each independent option (see Fig. 8). The AIDA matrix' column parameters are the various solutions and the row parameters are the various options within each of the decision areas. Intersections between the rows and columns are marked with a 1 to signify the inclusion or a 0 to signify the exclusion of the corresponding option within the corresponding compatible set. In addition, each option is evaluated against other options within its respective decision area. In the case of this example, the options have been rated according to their associated costs. Next, the total cost of each unit can be calculated by multiplying the value of the metric for each option by the numbers corresponding to the intersections between the rows and columns for each compatible set. Finally, the resulting products are summed to determine final cost. For example, in the case of the compatible set b1a2a3a4a5a6 the cost is 215 (50 + 10 + 15 + 30 + 50 = 215). After determining the totals for each of the compatible sets, designers can evaluate each one based on their desire to maximize or minimize the design metric. In the case of the example, one would desire to minimize cost, thereby resulting in the compatible set b1a2a3b4b5b6 winning out with the minimum cost of 205.

An example AIDA matrix.
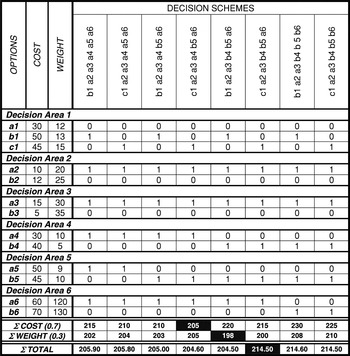
Although the AIDA matrix may seem to be more complex than is needed, it can be very useful, especially when a computer is used to handle the computation. In such cases, decision makers can reevaluate options on the fly, allowing them to quickly determine how these choices affect various solutions. It is also possible that the AIDA matrix can be used to evaluate compatible sets on multiple metrics, provided that these metrics can be used to evaluate each decision area independently (see Fig. 9). There can be a problem of determining the outright best solution, as inconsistent units will not yield a single optimal solution. In such cases, it is usually beneficial to evaluate the options on a relative and unit-less basis, allowing the results from each evaluation to be simply added together based on the weights one has assigned to each performance metric. As in the case with many optimization problems, the best solution is neither the cheapest nor the lightest, but instead minimizes both performance metrics best according to the assigned weights.

An example AIDA matrix with multiple objectives.
One cautionary note when using the AIDA matrix, as in the case of all evaluation techniques, is that one should always remember that it is only a tool as opposed to a replacement for designer knowledge and experience. Matrices of this type are a powerful when structuring or representing an evaluation procedure because they allow one to logically distinguish and evaluate the different facets of a particular design or concept. However, there is the potential to misuse these methods by not following appropriate exploration and evaluation habits, resulting in conclusions that often seem arbitrary (Pugh, 1990; Otto & Wood, 2001). Thus, although these methods are designed to aid in drawing a conclusion, experience shows that in many cases designers do not place a great amount of confidence in the results (Otto & Wood, 1995). It is our hope that designers learning and using the different methods within the AIDA process will consider the subtleties of each method, thus enabling them to better benefit from the effectiveness of these tools to form group consensus on major issues.
4. AIDA AS A METHOD FOR ENGINEERING DESIGN
In Figure 2, we presented the original Pahl and Beitz (1996) flowchart with the addition of a number of methods that aid the engineering design process. Here, we show AIDA occurring in the early conceptual design areas. As a good exercise in establishing the basis for complex design problems, designers are often recommended to create a function structure for the entire design. The function structure helps one understand what is required in the problem without committing to or being biased by existing design solutions. It also can allow one to determine the best way to divide tasks among various designers.
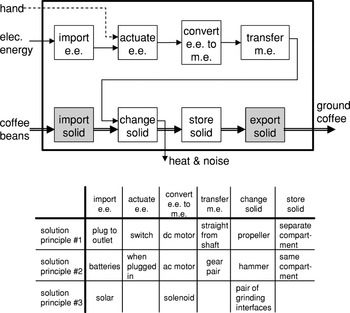
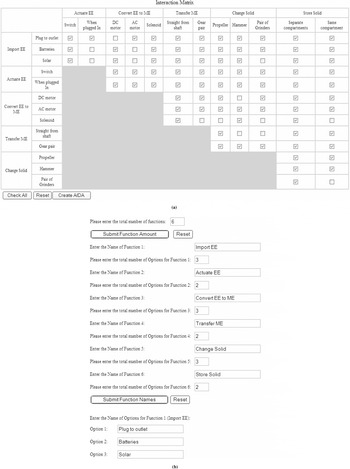
After a function structure is created, a good design exercise is to independently brainstorm solutions for each function while temporarily suspending the limitations or constraints between functions. To aid in the bookkeeping of solutions, one can organize these independent solution principles on a morphological matrix (Zwicky, 1948; Weber & Condoor, 1998). In Figure 10, a function structure for a new coffee grinder is shown along with a morphological matrix of the main functions in the artifact. The morphological matrix provides a broad basis from which the designers can develop new design concepts. In fact, if every possible solution from each column can be combined with that of every other row (here, we have simplified the function structure by ignoring the import and export functions of the coffee beans), then we have as many as 216 possible solutions at this point. It is not clear which strategy to follow next in the Pahl and Beitz (1996) formalism; the flowchart in Figure 2 merely suggests that we “combine and firm up into concept variants.” It is at this stage that we feel AIDA could be extremely useful for engineering design. In Figure 11a, we show how the interaction matrix presented in Section 3.4 can be used to organize the morphological matrix from Figure 10. Each function is noted with possible approaches for solving that function on both the rows and columns of the matrix. This matrix has been created automatically through our single Web page dialog shown in Figure 11b. Although there is nothing in the implementation that limits AIDA to functions and solution principles, we have found this method to be a particularly good use of the decision area and option formalism presented in the earlier AIDA texts discussed above.

A function structure and morphological matrix for the design of a new coffee grinder.

(a) The interaction matrix for the coffee grinder design problem from Figure 10 and (b) part of the dialog that creates this matrix.
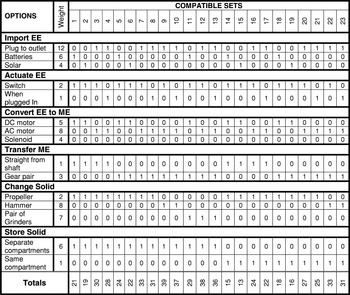
From the results of the interaction matrix, the implemented AIDA tool presents the user with 23 compatible sets of solution principles as shown in Figure 12. There is no guarantee that the resulting AIDA matrix will eliminate enough choices to make it practical for a designer to consider all the remaining compatible sets. In fact, one could argue that 23 remaining sets are too many to thoroughly consider. To provide more guidance one can reduce further by examining those that score well on a particular metric, like weight in this example.

The final AIDA matrix for the coffee grinder reduces the number of possibilities from 216 to 23 while comparing these design concepts on a metric such as total weight in ounces.
This example also shows AIDA's strength as a tool to enhance creativity. Not only does the process work to eliminate infeasible solution, but it also allows users to ponder how different solutions principles can be combined. For example, the sixth compatible set combines solar power with a DC motor and a propeller within a coffee maker that stores the beans and the grounds in separate compartments. Although it was the user who indicated the possibility to use solar energy as an input, the AIDA table presents the potential solutions that solar energy can be combined with. Users might also be interested in which compatible sets produce the highest and lowest values. In Figure 12, these are sets 8 and 15, respectively. Comparing these two designs can enlighten the user in which direction should be pursued.
The coffee grinder problem discussed in Figures 10, 11, and 12 is just one of the engineering design problems that have employed our implementation of AIDA. This program was written in DHTML and JavaScript and is publicly available (www.me.utexas.edu/∼adl/aida.html). Users are welcome to view the source code of this file, which includes 700 lines of code. The basic routine of creating compatible sets is performed by manipulating the matrix with nested loop searching that essentially follows valid combinations to a completed set similar to Figure 7.
A typical run through takes a familiar user approximately 15 min to complete, wherein the user fills in dynamically generated interaction tables and AIDA tables similar to Figure 6. In fact, all the computations of the matrices happen quickly enough that expert users can continually update information as it is revealed. In this way AIDA can be used as a backdrop for a brainstorming session between engineering designers, allowing decision makers to see quickly the effects of dependencies and incompatibilities in a densely populated decision space that would otherwise require intensive scrutiny. By facilitating the exploration of the decision space, AIDA allows decision makers to quickly see the effects of design decisions while also producing unexpected and creative results. For example, in the above AIDA matrix, combination 3 is what is commonly sold as a coffee grinder. Yet this simplified AIDA analysis resulted in over 20 different feasible combinations that could also perform the required functionality. Moreover, it predicts that there are at least eight original and unique concepts, including combinations 7, 8, 9, 10, 12, 13, 22, and 23, that were judged as performing better when evaluated on weight, demonstrating AIDA's ability to produce and evaluate creative design concepts.
Of course, the AIDA analysis and the resulting suggested solutions set increases in number as the problem increases in complexity. Because the set increases exponentially with the addition of new decision areas, even relatively simple problems can result in both computationally taxing decision spaces and unwieldy sets of feasible solutions. This issue was addressed when using AIDA during community planning operations by expanding and contracting the decision space by defining different decision areas as being either active or inactive during various iterations of the AIDA process (Luckman, 1967). Another method for reducing the computational complexity and number of resulting solutions within a complex design process is to compartmentalize the different subsystems similar to how a team of engineers would address the design of a particular complex system. In this way, one can analyze the decision space for each subsystem within a system and then relate relevant decisions across subsystems as the needs arise.
5. AIDA AS A TEACHING TOOL
AIDA was recently incorporated into a mechanical engineering design methodology course and was introduced in conjunction with other, previously taught design methods. Throughout the semester, teams of students learned and used design methods in lecture examples, exam questions, and original design projects. Toward the end of the semester, after the class had become familiar with covered techniques, we conducted a short survey, wherein students were asked questions regarding the virtues of several of the methodologies that were taught to them.
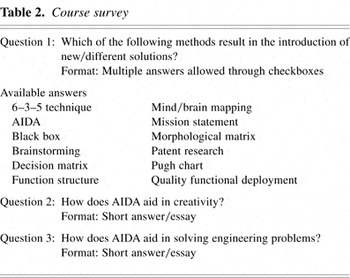
We informed the students that the survey would be kept completely anonymous, and that answers would in no way be linked to their grades. We administered the survey via an online classroom learning system (BlackboardTM) wherein students were given 2 weeks to read, answer, review, and submit their responses. A total number of 19 students participated in the survey in which they were asked three questions: one multiple choice format and two short answer/essay format (see Table 2).
Course survey

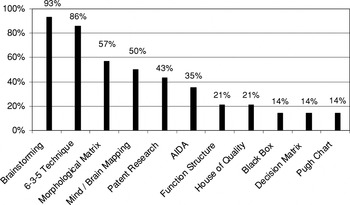
After each of the students had submitted the survey, we reviewed their responses and gathered the following results. For the multiple choice question, we wanted to understand how students felt about the ability of AIDA to create new ideas among designers compared to other techniques. What is most interesting, is how they rated the AIDA technique with respect to other, nonbrainstorming and nondecision-making techniques; 35% of the students found that as a technique, AIDA resulted in new and different design solutions (see Fig. 13). Although this number is not high, it is important to examine the techniques that were rated more effective than the AIDA method. With the exception of patent searches, all of the techniques found to be more effective at producing unexpected solutions are essentially guided brainstorming methods. Furthermore, designers have long understood how patent searches can lead to innovative solutions in conjunction with the various techniques that were introduced (Altshuller, 1984).

The survey responses to the first survey question.
Although it can be argued that the first survey question did not show any astonishing results, the two final questions show that students do, in fact, value the AIDA method. When asked how AIDA aided in creativity, we received these responses among various others:
- “[AIDA] disregards biases that may exist in the design team and helps consolidate possible solutions.”
- “It provides insights to combining functions that [designers] may have not previously realized.”
- “AIDA helps aids creativity [by] allow[ing] designers to look at many different combinations of ideas.”
- “AIDA assists creative efforts because it allows designers to [explore] all the possible solution variants. Some solutions will consist of components that are incompatible with one another; however, many solutions will be results that the designer did not originally consider.”
When asked if AIDA aids in solving engineering problems, we received the following responses among others:
- “The AIDA matrix opens the door to other possible solutions that may not [have been] considered by the [decision makers] otherwise.”
- “[It] helps to develop different solutions with methods that may have not been used before.”
- “[It] shows which compatible sets are the most effective when compared through [the] common functional requirements.”
- “AIDA helps solve engineering problems by showing the designer which solutions are incompatible with one another … a process that would normally take a lot of time and effort.”
- “AIDA helps in grouping possible solutions, which can then make prioritizing a type of solution very simple.”
Such responses verify AIDA's utility as a creativity technique. Moreover, many of the students further prefaced its usefulness by explaining that with the software, they could quickly and effortlessly run through various design pathways. The survey will be revisited in future semesters to verify AIDA's effectiveness, but to date, the method appears to be a welcome approach in creating innovative solutions to design challenges.
6. CONCLUSIONS AND FUTURE WORK
Throughout this paper we have discussed a decision method known as the AIDA. Although created originally for the specific fields of architecture and city planning, AIDA has been shown to be a valuable tool in many decision-making environments. It is especially useful in the arena of engineering design because it allows designers to fully examine the decision space and relate the interdependencies among the various available choices, an ability that has not been seen among other established design methods. We have also shown AIDA to be a useful tool for teaching, as engineering students have been shown to embrace the technique and value its ability to guide them to creative solutions.
In this paper, we introduced the first publicly available implementation of the AIDA technique. Harary, Jessop, Luckman, and Friend recalled instances wherein decision makers would spend days drawing detailed representations of their decision space on chalkboards and butcher paper, only to repeat the process when new constraints or options was added. Given the complex nature of exploring the compatibility relationships within the decision space, decision makers are often forced to simplify their choices to meet the time demands of a project. Through the use of this package, however, decision makers can experiment with a multitude of potential solutions and change their constraints or choices at will with little time and effort.
Although our current implementation of AIDA is very powerful, we feel that we can add to its value by increasing the scope of both the program and the technique in general. Currently, our implementation of AIDA limits the user to a single performance metric per iteration, requiring that users rerun the AIDA matrix for every performance metric. In the future, we plan to expand the program to allow for multiple criteria with user-specified weights assigned to each, as detailed in Section 3.6. This new ability will allow users the flexibility of quickly evaluating potential designs based on a more exact representation of the requirements and constraints.
The current implementation requires that users click compatibilities in the matrix shown in Figure 11a. Although this makes the program simple and easy to use, it may be more useful in some applications to expand this to include distinct compatibility, incompatibility, and unknown values. One of AIDA's inherent weaknesses is its inability to cope with decision areas that not entirely related or unrelated, as it considers compatibility a binary operator. However, in many cases, compatibility can be expressed as a scalar range, wherein there can be a cost function defined to express the investment needed to make two options compatible. It is our belief that by expanding the definition compatibility in this manner, the AIDA procedure will lend itself to be used to describe the full gamut of complex decision making.
References
REFERENCES
Altshuller, G.
(1984).
Creativity as an Exact Science: The Theory of the Solution of
Inventive Problems
(Williams, A., Russ. Trans.).
New York:
Gordon & Breach Science Publishers.
Bryant, J.
(1989).
Problem Management: A Guide for Producers and Players.
New York:
Wiley.
Eppinger, S.D.,
Whitney, D.E.,
Smith, R.P., &
Gebala, D.A.
(1994).
A model-based method for organizing tasks in product
development.
Research in Engineering Design
6(1),
1–13.Google Scholar
Friend, J.K. &
Hickling, A.
(1987).
Planning Under Pressure: The Strategic Choice Approach.
Oxford:
Pergamon Press.
Friend, J.K. &
Jessop, W.N.
(1969).
Local Government and Strategic Choice: An Operational Research
Approach to the Process of Public Planning.
Oxford:
Pergamon Press.
Friend, J.K.,
Power, J.M., &
Yewlett, C.J.L
(1974).
Public Planning: The Inter-Corporate Dimension.
London:
Travistock Publications Limited.
Gero, J.S.
(1996).
Creativity, emergence and evolution in design: Concepts and
framework.
Knowledge-Based Systems
9(7),
435–448.Google Scholar
Harary, F.,
Jessop, N.,
Luckman, J., &
Stringer, J.
(1965).
Analysis of interconnected decision areas: An algorithm for project
development.
Nature
5,
118.Google Scholar
Hickling, A.
(1978).
AIDA and the levels of choice in structure plans.
Town Planning Review
49,
459–475.Google Scholar
Jones, C.J.
(1980).
Design Methods: Seeds of Human Future.
New York:
Wiley.
Luckman, J.
(1967).
An approach to the management of design.
Operational Research Quarterly
18,
345–358.Google Scholar
Mitchell, T.M.
(1997).
Machine Learning.
Boston:
McGraw–Hill.
Otto, K.N. &
Wood, K.L.
(1995).
Estimating errors in concept selection.
ASME Design Engineering Technical Conferences,
2,
397–412.Google Scholar
Otto, K.N. &
Wood, K.L.
(2001).
Product Design: Techniques in Reverse Engineering and New Product
Development.
Englewood Cliffs, NJ:
Prentice–Hall.
Pahl, G. &
Beitz, W.
(1996).
Engineering Design: A Systematic Approach.
London:
Springer.
Pugh, S.
(1990).
Total Design.
New York:
Addison–Wesley.
Rusholme, J.
(1966).
Interdependence and Uncertainty: A Study of the Building
Industry.
London:
Travistock Publications.
Weber, R.G. &
Condoor, S.S.
(1998).
Conceptual design using a synergistically compatible morphological
matrix.
Frontiers in Education Conf., November 4–7, Tempe,
AZ.
Zwicky, F.
(1948).
The Morphological Method of Analysis and Construction, Courant
Anniversary Volume.
New York:
Wiley–Interscience.
The general process for finding solutions (Pahl & Beitz, 1996).
The steps of the planning and design process (Pahl & Beitz, 1996).
An example of a decision graph with six decision areas.
A decision space with various options.
An example option graph. The links represent incompatibilities, rather than dependencies as in Figure 3.
An example interaction matrix where the incompatibilities are marked with checks.
Compatible set listing
An example decision tree.
An example AIDA matrix.
An example AIDA matrix with multiple objectives.
A function structure and morphological matrix for the design of a new coffee grinder.
(a) The interaction matrix for the coffee grinder design problem from Figure 10 and (b) part of the dialog that creates this matrix.
The final AIDA matrix for the coffee grinder reduces the number of possibilities from 216 to 23 while comparing these design concepts on a metric such as total weight in ounces.
Course survey
The survey responses to the first survey question.
 You have
Access
- 11
- Cited by