
Introduction
Human trichomoniasis, caused by parabasalid flagellate Trichomonas vaginalis, is the most common and widely spread non-viral sexually transmitted infection, with an incidence estimative of 143 million new cases in 2012 (Newman et al., Reference Newman, Rowley, Hoorn, Wijesooriya, Unemo, Low, Stevens, Gottlieb, Kiarie and Temmerman2015). Albeit asymptomatic in most individuals, a substantial proportion of infected women will develop moderate to severe inflammation in their genital tract (Schumann and Plasner, Reference Schumann and Plasner2021). For pregnant patients, T. vaginalis infection may result in preterm delivery and low weight at birth (Bagga and Arora, Reference Bagga and Arora2020). However, the most preoccupant aspect of human trichomoniasis is the well-stablished association with HIV transmission and infection, as inflammation of genital tissue caused by the flagellate facilitates HIV access to host lymphocyte cells (Masha et al., Reference Masha, Cools, Sanders, Vaneechoutte and Crucitti2019).
Trichomonas vaginalis is usually depicted as presenting a simple life cycle, where motile multiflagellated ellipsoid trophozoites are capable of both infection and extracellular proliferation in host genital tissues. Although not usually mentioned in parasitology textbooks, T. vaginalis also presents a peculiar flagellated amoeboid stage, which interacts directly with the surface of host epithelial cells (Gould et al., Reference Gould, Woehle, Kusdian, Landan, Tachezy, Zimorski and Martin2013; Kusdian et al., Reference Kusdian, Woehle, Martin and Gould2013). Besides these trophozoite and amoeboid stages, T. vaginalis is also able to differentiate into an intriguing alternative stage, usually named pseudocyst (a.k.a. endoflagellar or cyst-like forms/stages) (Pereira-Neves et al., Reference Pereira-Neves, Ribeiro and Benchimol2003; Beri et al., Reference Beri, Yadav, Devi, Narayana, Gadara and Tatu2020). Although these cyst-like forms are normally scarce in fresh axenic cultures, their amount usually increases dramatically when parasites are exposed to adverse microenvironmental conditions, such as thermic stress, absence of essential nutrients (e.g. iron) or exposure to low doses of antiparasitic agents (Hussein and Atwa, Reference Hussein and Atwa2008; Rocha et al., Reference Rocha, de Andrade Rosa, Urbina, de Souza and Benchimol2014; Dias-Lopes et al., Reference Dias-Lopes, Saboia-Vahia, Margotti, Fernandes, Castro, Oliveira-Júnior, Peixoto, Britto, Silva-Filho, Cuervo and Jesus2017; Beri et al., Reference Beri, Yadav, Devi, Narayana, Gadara and Tatu2020).
For a long time, T. vaginalis cyst-like forms (as well as similar morpho-physiological stages described for other parabasalid species) were not considered as bona fide protist cysts, since they seemed to lack a tough and resistant cyst wall. Recently, it was shown that cyst-like stages of T. vaginalis are much more similar to classical cysts than previously thought, as putative chitin polymers have been identified as components of their surrounding structures (Beri et al., Reference Beri, Yadav, Devi, Narayana, Gadara and Tatu2020). As it is common for several other protist cysts, these cyst-like stages present decreased energetic metabolism and motility, arise in stressful microenvironmental circumstances, are more resistant to osmotic lysis, and are able to promptly liberate active trophozoites when returned to favourable conditions (Pereira-Neves et al., Reference Pereira-Neves, Ribeiro and Benchimol2003; Dias-Lopes et al., Reference Dias-Lopes, Wiśniewski, de Souza, Vidal, Padrón, Britto, Cuervo and De Jesus2018; Beri et al., Reference Beri, Yadav, Devi, Narayana, Gadara and Tatu2020). Interestingly, there are some reports of naturally occurring T. vaginalis cyst-like stages infecting human hosts in vivo and causing tissue damage (Małyszko and Januszko, Reference Małyszko and Januszko1991; Afzan and Suresh, Reference Afzan and Suresh2012).
Although cyst-like stages of T. vaginalis have been targets of comparative transcriptomic and proteomic/phosphoproteomic studies (Yeh et al., Reference Yeh, Huang, Richie-Gan, Huang, Wang and Tang2013; Fang et al., Reference Fang, Huang, Huang, Lin, Chao and Tang2015; Dias-Lopes et al., Reference Dias-Lopes, Wiśniewski, de Souza, Vidal, Padrón, Britto, Cuervo and De Jesus2018; Beri et al., Reference Beri, Yadav, Devi, Narayana, Gadara and Tatu2020), and RT-qPCR has been frequently used as a tool to compare and quantify gene expression in these organisms (e.g. Lin et al., Reference Lin, Li, Lin, Shin, Hu, Yu, Huang, Chen, Chen, Chen, Huang, Gan, Chiu and Tang2009a, Reference Lin, Huang, Chen, Huang, Chen, Huang and Tang2009b; Horváthová et al., Reference Horváthová, Šafaríková, Basler, Hrdy, Campo, Shin, Huang, Huang, Lin, Tang and Tachezy2012; Huang et al., Reference Huang, Huang, Ku, Lin, Alderete and Tang2012; dos Santos et al., Reference dos Santos, de Vargas Rigo, Frasson, Macedo and Tasca2015; Fang et al., Reference Fang, Huang, Huang, Lin, Chao and Tang2015), including the establishment of reference genes for nutritional RT-qPCR studies in the trophozoite stage (dos Santos et al., Reference dos Santos, de Vargas Rigo, Frasson, Macedo and Tasca2015), there are no currently described and validated endogenous reference gene to be used in RT-qPCR assays comparing patterns of gene expression between trophozoite and cyst-like stages. Here we have tested nine candidates reference genes in order to choose those displaying higher stable expression for using in studies of gene expression comparing cultured trophozoites with cold-induced cyst-like stages of T. vaginalis. After comparing their expression profiles applying four current and widely used computational methods for the determination of reference genes, we found that mRNAs coding for GAPDH, eIF2α, ferredoxin and G6PDH exhibited (in descending order) the more invariant expression profiles and that these transcripts can be used for comparison of RNA expression during T. vaginalis differentiation between these two morpho-physiological stages. In addition, we investigated the mRNA expression of the meiotic recombinase Dmc1 using the combined four established reference genes as endogenous control, and observed that Dmc1 mRNA seems to be upregulated in the cyst-like forms, which leads to intriguing perspectives for the study of meiosis and sexual reproduction in these parasites.
Materials and methods
Cultivation of T. vaginalis
Trophozoites of T. vaginalis (JT strain) were maintained at 36°C in TYM medium (pH 6.8) supplemented with 10% heat-inactivated fetal calf serum (Cultilab, Campinas, SP, Brazil), 10.000 U L−1 penicillin and 10 mg L−1 streptomycin (Sigma-Aldrich, St. Louis, MO, USA). The number of viable cells was determined based on haemocytometer counts of motile cells. Cells grown to a late logarithmic phase with more than 90% viable cells were harvested for differentiation assays.
Induction of T. vaginalis differentiation to cyst-like forms
Trichomonas vaginalis trophozoites were induced to differentiate into cyst-like forms by an adapted cold shock treatment methodology, previously described for the related parasite Tritrichomonas foetus (Pereira-Neves and Benchimol, Reference Pereira-Neves and Benchimol2009). Cultures grown for 48 h at 36°C in TYM medium were harvested by centrifugation and suspended in complete fresh TYM medium to a density of 107 trophozoites per mL. Then aliquots of 1 mL were distributed to 1.5 mL microtubes and pools of microtubes were immersed and cooled into 4°C water baths, which were kept on refrigeration up to 12 h. Cyst-like forms enriched cultures were then returned to 36°C to allow for the resurgence of typical trophozoites. Microtubes were collected for microscopic verification and RNA extraction immediately before cold shock, after 2 and 12 h of cold induction and after 2 h of trophozoites recovery at 36°C. The proportion of trophozoites and cyst-like forms was determined from counts using a Neubauer haemocytometer. Three microtubes were processed for each experimental point and whole experiments were performed independently four times.
Microscopy analysis
Stained microscopic preparations were made as described by Lun and Gajadhar (Reference Lun and Gajadhar1999), using a modified version of the Fast-Panoptic kit (Laborclin, Pinhais, PR, Brazil) staining protocol. Microtubes containing 1 mL of T. vaginalis cultures were centrifuged at 800 g for 10 min, supernatant was discarded and the cellular pellet was resuspended in 50 μL of fresh TYM medium supplemented with 10% SFB (Cultilab, Campinas, SP, Brazil). Then, thin smears were made in clean glass slides from 20 μL aliquots and parasites were air-dried. These smears were fixed for 1 min by quickly dipping the slides 15 times in the fixative solution (triarylmethane in methyl alcohol) from the kit, followed by blotting of excess fixative solution on filter paper. Following this, the smears were stained for 1 min by dipping 15 times in weak Lugol's iodine solution (Laborclin, Pinhais, PR, Brazil), washed briefly with distilled water and then quickly dipped 15 times in the eosinophilic staining solution (xanthene dye) from the kit. After blotting the excess of staining solution, the smears were finally dipped 10 times for 30 s in the basophilic staining solution (thiazine dye) from the kit, washed with plenty of running distilled water and air-dried. Stained smears were examined in bright field, under 40× and 100× (oil immersion) objective lenses of an Eclipse 80i microscope (NIKON, Tokyo, Japan). Image adjustments were performed with NIH ImageJ software (v. 1.53a; NIH, Bethesda, MD, USA).
The presence of chitin-like polysaccharides during the differentiation assay was investigated by using calcofluor white fluorescent stain (Sigma-Aldrich, St. Louis, MO, USA), as described by Beri et al. (Reference Beri, Yadav, Devi, Narayana, Gadara and Tatu2020). Briefly, 5 μL aliquots parasite culture were mixed with 5 μL of calcofluor white stain (Sigma-Aldrich, St. Louis, MO, USA) directly on a microscope slide and a cover slip was positioned over it before examination under 40× and 100× (oil immersion) objective lenses of an Eclipse 80i microscope (NIKON, Tokyo, Japan), using both bright field and DAPI fluorescence filters. Image adjustments were performed with NIH ImageJ software (v. 1.53a; NIH, Bethesda, MD, USA).
RNA extraction and cDNA synthesis
Total parasite RNA was extracted from 1 mL cultures using TRIzol® reagent (Invitrogen, Carlsbad/CA, USA) according to the manufacturer-recommended procedures. RNA concentration was assessed by spectrophotometry at 260 nm and purity was determined by 260/280 and 260/230 ratios, measured with a Nanodrop 2000 spectrophotometer (ThermoFisher Scientific, Waltham, MA, USA). In total, 2.0 μg of this RNA were submitted to treatment with RQ1 DNAse (Promega, Madison, WI, USA) at 37°C for 30 min followed by enzyme inactivation at 37°C for 10 min. Prior to reverse transcription, samples of each non-treated RNA and DNAse-treated RNA were submitted to conventional PCR using α-actin primers to inspect for genomic DNA contamination. First-strand cDNA was then synthesized from 2.0 μg of DNAse-treated RNA using the High-Capacity cDNA Reverse Transcription Kit (Applied Biosystems, Foster City, CA, USA), according to the manufacturer-recommended procedures.
Selection of candidates for evaluation as reference genes
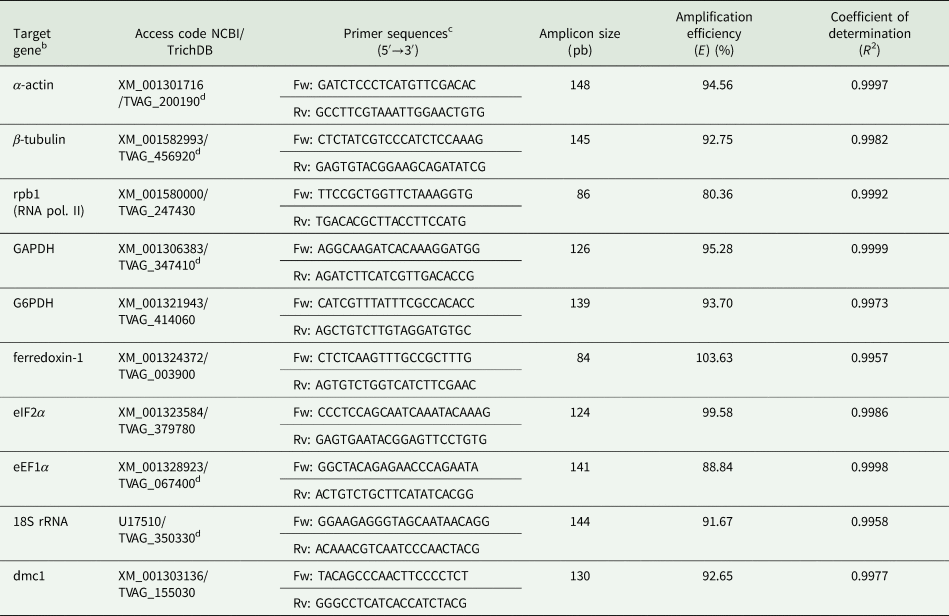
A total of nine candidate reference genes were selected. All primer pairs were designed using the Real Time PCR Tool from IDT - Integrated DNA Technologies (https://www.idtdna.com/scitools/Applications/RealTimePCR/) with predicted T m of 62°C, and were synthesized by Macrogen Inc. (Seoul, South Korea). Full gene names, accession codes at NCBI and TrichDB, primer sequences and expected amplicon sizes are shown in Table 1.
Primer sequences and amplification propertiesa

a All pairs were designed with theoretical T m of 62°C.
b More information and bibliographic references regarding the candidate reference genes are provided in Supplementary Table 1.
c Fw: forward primer; Rv: reverse primer.
d Indicates that other paralogous copies may be amplified by this primer pair (see text). These other gene copies are listed in Supplementary Table 1.
RT-qPCR
RT-qPCR amplifications were performed in 96-well plates on a StepOnePlus™ thermocycler (Applied Biosystems, Foster City, CA, USA) and using SYBR® Green PCR Master Mix (Applied Biosystems, Foster City, CA, USA). Reactions were prepared as follows: 5 μL of 1:100 diluted cDNA, 5 μL SYBR® Green PCR Master Mix, 0.375 μ m of each primer and nuclease-free deionized water to complete a 15 μL final volume. Cycling conditions comprised an initial step of 95°C for 60 s, followed by 40 cycles of denaturation at 95°C for 15 s and annealing/extension at 60°C for 60 s. Reaction temperatures were then gradually raised from 60 to 95°C to obtain the melting curves in order to check the specificity of amplifications. All assays were performed with three technical replicates for each one of three biological replicates and a control lacking cDNA template. Quantification cycle (C q) thresholds were determined by default parameters. The amplification of single products was assessed by analysis of melting curves. In order to avoid outliers influence, for each of three technical replicates, the more discrepant C q was systematically excluded and the two remaining were used to calculate the mean C q.
Determination of RT-qPCR amplification efficiency
Serial dilutions of cDNA samples (1:5, 1:25, 1:50, 1:100 and 1:1000) were assayed in RT-qPCR against cDNAs from T. vaginalis trophozoites to determine the dilution range that most C qs would fall within the optimal analysis range (between 18 and 28) (data not shown). Following this, cDNA was subsequently diluted 100-fold for further amplification studies.
In order to calculate qPCR amplification efficiency (E) and the corresponding coefficient of determination (R 2) for each pair of primers, standard curves were generated in MS Excel 2016 worksheets with C qs obtained from 10-fold serial dilutions of trophozoite cDNA or genomic DNA templates (three technical replicates). Amplification efficiencies were calculated using the formula E = ( − 1 + 10−1/a) × 100, in which ‘a’ corresponds to angular coefficients from the standard curves obtained by linear regression.
Analysis of expression stability
Determination of expression stability was assessed using three freely available algorithms NormFinder (v. 0.935) (Andersen et al., Reference Andersen, Jensen and Ørntoft2004), BestKeeper (v. 1.0) (Pfaffl et al., Reference Pfaffl, Tichopad, Prgomet and Neuvians2004) and geNorm (v. 3.5) (Vandesompele et al., Reference Vandesompele, De Preter, Pattyn, Poppe, Van Roy, De Paepe and Speleman2002), all executable on MS Excel 2016. Besides, we have also applied the comparative ΔC q method (Silver et al., Reference Silver, Best, Jiang and Thein2006), strictly following authors instructions and also on an MS Excel 2016 worksheet. While comparative ΔC q and BestKeeper calculate expression stability using raw C qs values, data input in both NormFinder and geNorm requires C q values to be first converted into relative quantities (Q) via the ΔC q method, using the formula $Q = E^{\Delta C_{\rm q}}$ , in which E corresponds to amplification efficiency and ΔC q is obtained by subtracting the C q of a given sample from the higher C q obtained for that gene and cDNA batch.
Validation of reference genes
Practical validation of the reference genes was achieved by RT-qPCR relative quantification of Dmc1 transcripts, using the same reaction set-up and cycling conditions as described above, except from cDNA dilution (which was adjusted to 1:30). Relative quantification in the four experimental points was performed with the comparative Pfaffl method (Pfaffl, Reference Pfaffl2001), using the geometric average of relative quantities from four reference genes as a denominator. Oligonucleotide primers were designed and synthesized as described above, and related information is shown in Table 1.
Statistical analyses of RT-qPCR data were performed with the GraphPad Prism 6 program (v. 6.01; GraphPad Software Inc., San Diego, CA, USA), using one-way ANOVA, followed by Dunnett's post-hoc test. Statistical significance was considered if P ⩽ 0.1.
Results
Cold-induced differentiation of T. vaginalis trophozoites in cyst-like forms
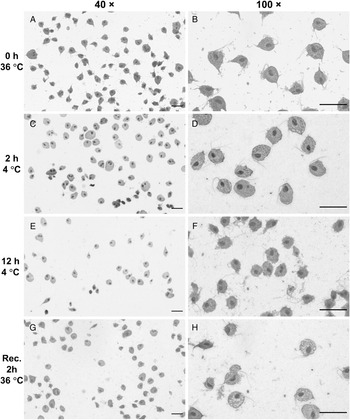
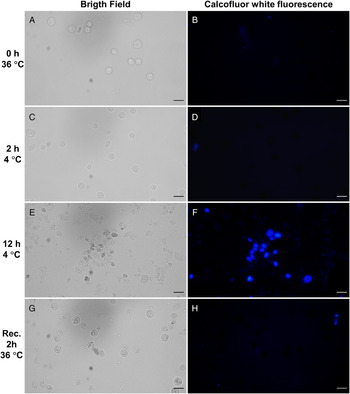
Trophozoites of T. vaginalis (JT strain) were induced to differentiate cyst-like forms by incubation during an extended period in a cold environment, in a similar procedure as the one previously described for T. foetus (Pereira-Neves and Benchimol, Reference Pereira-Neves and Benchimol2009). After 12 h of incubation at 4°C, more than 70% of the cells had adopted the morphology of cyst-like forms. Then differentiated parasites were returned to normal cultivation temperature and, after 2 h, trophozoites had emerged and dominated the culture. Samples were collected (i) immediately before the cold exposure; (ii) 2 h after cold exposition, as this is an adequate time to investigate early transcriptional responses to the induction procedure; (iii) 12 h after cold induction, with cyst-like forms fully differentiated and (iv) 2 h after returning the culture to 36°C (restored trophozoites). Stained bright field microscopic preparations show typical trophozoites at the two first experimental points, while after 12 h at 4°C, the characteristic rounded cyst-like status was evident, with 70–80% of cells displaying this morphology (Fig. 1). Curiously, flagella, if present, appeared atypical and unorganized, and axostyles were undistinguishable. As these cytoskeleton structures are structured mainly by microtubules, it is possible that the prolonged exposure to cold affected microtubule stability to some degree, as seen in other organisms (Wallin and Strömberg, Reference Wallin and Strömberg1995). Trophozoites restored from cyst-like forms were morphologically indistinguishable from original trophozoites (Fig. 1). We have also investigated the staining of cyst-like forms with the fluorescent dye calcofluor white, which reveals chitin and/or cellulose polymers and was recently used in the characterization of cyst-like forms of T. vaginalis (Beri et al., Reference Beri, Yadav, Devi, Narayana, Gadara and Tatu2020). As expected, calcofluor white fluorescence was not apparent in trophozoites grown at 36°C or after 2 h at 4°C. However, it was quite evident and intense after 12 h of cold induction, revealing that cold stress for 12 h generates cyst-like forms similar to the ones observed by Beri et al. (Reference Beri, Yadav, Devi, Narayana, Gadara and Tatu2020) (Fig. 2). Furthermore, 36°C restored cells showed much less fluorescence than 12 h cold-induced parasites, suggesting that rescue to trophozoite stage was efficient (Fig. 2).
Cold-induced differentiation of T. vaginalis trophozoites into cyst-like forms monitored by bright field microscopy and using lugol/panoptic staining. (A, C, E and G) Cells were observed with 40× objective lens. (B, D, F and H) Cells were observed with 100× objective lens. Bars: 20 μm.

Cold-induced differentiation of T. vaginalis trophozoites into cyst-like forms monitored by fluorescence microscopy using calcofluor white stain. (A, C, E and G) Bright field observations of living parasites with 40× objective lens. (B, D, F and H) Calcofluor white fluorescence for the same fields shown on left, observed with 40× objective lens. Bars: 20 μm.

Selection and expression of candidate reference genes
A total of nine candidate reference genes were chosen for the current study. Orthologues from eight of these genes have been widely selected as reference genes in similar studies using other organisms and conditions. We attempted to select genes whose products are involved in different cellular processes, such as metabolism, gene transcription, protein translation and cytoskeleton architecture. Thus, we selected genes coding for T. vaginalis α-actin, β-tubulin, RNA polymerase 2 main subunit (rpb1), glyceraldehyde 3-phosphate dehydrogenase (GAPDH), glucose-6-phosphate dehydrogenase (G6PDH), translation initiation factor 2α (eIF2α), translation elongation factor 1α (eEF1α) and the 18S ribosomal RNA. The ferredoxin-1 gene was also tested, as it codes for a central protein for the hydrogenosomal metabolism. A brief description of the main cellular functions of each candidate gene, as well as bibliographic references of theirs use as reference genes in RT-qPCR assays, is given in Supplementary Table 1.
To ensure comparability between RT-qPCR experiments, amplification efficiency for each primer pair was determined by analysing C qs obtained from reactions using serial dilutions of trophozoite cDNA and taken into account whenever the software asked for this variable. The PCR efficiency for primer pairs ranged from 80.36 to 103.63%, while coefficients of determination (R 2) for amplification standard curves ranged from 0.9957 to 0.9999 (Table 1; Supplementary Fig. 1). RT-qPCR specificity was assessed by agarose gel electrophoresis and analysis of melting curves, which revealed single peaks for all primer sets (data not shown).
During the four time points of the cold-induced differentiation of T. vaginalis trophozoites to cyst-like forms, the expression levels of the nine candidate genes were assayed by RT-qPCR amplification and determined based on quantification cycle (C q) values. All measured C qs were under 38, and average C q values ranged from 9.31 (18S rRNA) to 28.90 (rpb1), reflecting a considerable amplitude of variation (Supplementary Table 2; Fig. 3A). These two genes constitute the extremes of expression among the tested candidates, with 18S rRNA and rpb1 exhibiting the higher and lower levels of expression, respectively, when compared with all other tested candidates (Fig. 3B).
Expression profile of candidate reference genes along cold-induced differentiation of T. vaginalis trophozoites in cyst-like forms and recovery of trophozoites. The expression levels of the candidate reference genes are represented by C q values from four independent experiments. (A) Variation in C q values determined for nine candidate reference genes combining all four experimental points of the encystation process. C q from 32 cDNAs were analysed for each gene. (B) Variation in C q values for each candidate reference gene, in each of the four experimental points during the encystation process. C q from eight cDNAs were analysed for each experimental point. For both A and B, each dot represents a mean C q value, the middle lines represent medians, and lower and upper bars represent 25th and 75th percentiles, respectively. One-way ANOVA was carried out for data in B and none of the genes presented a significant difference in their expression profile along the experiment (P > 0.05).

The plotting of raw C q values obtained for each candidate reference genes in each experimental condition shows no evident pattern of up or downregulation during the course of the experiment, which is corroborated by the absence of significant differences among means, as verified by one-way ANOVA (Fig. 3B). Furthermore, analysis of descriptive statistics from this data suggests that GAPDH and ferredoxin-1 transcripts may work as good reference genes to be used during the differentiation into cyst-like forms, as these two genes present the smallest differences between their highest and lowest means (0.91 and 1.31 C q, respectively) and medians (1.53 and 1.28 C q, respectively), as well as relatively small standard deviations (data not shown).
Analysis of gene expression stability
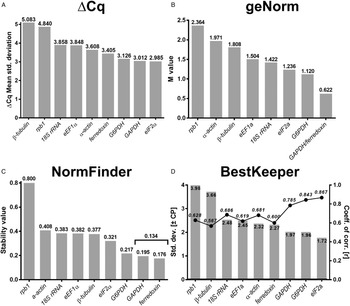
The first approach used for determining the best reference genes for the investigation of the cyst-like differentiation in T. vaginalis was the comparative ΔC q method (Silver et al., Reference Silver, Best, Jiang and Thein2006). This method is based on the assumption that differences in C qs from gene pairs with stable expression tend to remain constant when analysed in distinct experimental conditions. Fluctuations in ΔC q indicate a disparity in expression and pairwise comparison with more genes aids to discern the genes with more stable expression. To employ this approach in the study of T. vaginalis encystation-like process, differences in C qs (ΔC qs) were first determined individually for gene pairs from each cDNA under study. Next, the arithmetic mean and standard deviations (s.d.s) from ΔC qs were calculated for each gene pair across all tested cDNAs (Supplementary Fig. 2). Finally, a mean of standard deviations was obtained for each gene and the resulting values were ranked (Fig. 4A; Supplementary Table 3). eIF2α came out as the gene with a more constant expression (s.d. = 2.985), followed by GAPDH, G6PDH and ferredoxin-1. On the other side, β-tubulin and rpb1 showed exceptional higher mean standard deviations (s.d.s = 5.083 and 4.840, respectively).
Ranking of T. vaginalis candidate reference genes according to expression stability during differentiation of trophozoites in cyst-like forms using four distinct approaches. Genes are ranked from left to right in order of increasing expression stability. (A) Ranking by standard deviation of C q differences, as calculated using the ΔC q method; (B) Ranking by expression stability values (M values), as calculated by the geNorm program; (C) Ranking by stability values, as calculated by the NormFinder program; (D) Ranking by standard deviation (±C q) values (columns), as calculated by the BestKeeper program. The coefficients of correlation (r) to the BestKeeper index are plotted as filled circles connected by a line (with P < 0.001 for all RNAs). Columns in D are associated with the left Y-axis and connected circles with the right Y-axis.

The geNorm algorithm generates expression stability values (M) under an assumption similar to ΔC q method, in which two ideal reference genes should exhibit a constant expression ratio along different experimental conditions (Vandesompele et al., Reference Vandesompele, De Preter, Pattyn, Poppe, Van Roy, De Paepe and Speleman2002). This algorithm calculates these M values based on average standard deviations of logarithmic transformed pairwise expression ratios. Thus, the M values for a given candidate gene represents the mean pairwise variation of that gene with all other genes under study. Then, a procedure of progressive exclusion of higher M values and recalculation leads to a ranking of tested genes according to their expression stability. Six of the nine tested RNAs presented geNorm M values below the recommended 1.5 threshold (eEF1α, 18S rRNA, eIF2α, G6PDH, ferredoxin-1 and GAPDH), with ferredoxin-1 plus GAPDH showing the best combined M value (M = 0.622) (Fig. 4B; Supplementary Table 3).
Next, we applied the NormFinder algorithm to select the most stable transcripts across T. vaginalis differentiation in cyst-like forms. In contrast to geNorm and ΔC q approaches, this method relies on a linear mathematical model to obtain measures of intragroup and intergroup variation in expression (Andersen et al., Reference Andersen, Jensen and Ørntoft2004). In this process, it calculates stability values for each tested gene, with lower stability values indicating the ones with more stable expression. It also determines the stability value for the best pair of genes to be used as a reference. In our analysis, ferredoxin-1 and GAPDH were selected as the best pair of reference genes, with a combined stability value of 0.134 (Fig. 4C; Supplementary Table 3), reiterating the results of geNorm analysis. Once again, the rpb1 transcript exhibited a discrepant higher stability value (0.8).
Finally, we attempted to test the nine candidate reference genes with the BestKeeper method (Pfaffl et al., Reference Pfaffl, Tichopad, Prgomet and Neuvians2004). This algorithm provides descriptive statistics measures for each tested gene, such as arithmetic and geometric means of C qs, standard deviations (s.d.; ±C q), coefficients of variation (CV; %C q) and pairwise Pearson coefficients of correlation with respective P values. The software then calculates a combined BestKeeper index, as well as coefficients of correlation between each candidate gene and this index. Genes exhibiting lower s.d. (±C q) values as well as higher and significant coefficients of correlation with BestKeeper index (r) are regarded as the best ones to be used as a reference of invariant expression. We have examined the output of BestKeeper taking into consideration both s.d. (±C q) and r (with associated P values), and ranked the genes guided by their s.d. (±C q) values (Fig. 4D – right Y-axis/columns; Supplementary Table 3). BestKeeper developers recommend to avoid using genes with s.d. (±C q) > 1, as their transcript starting concentrations may vary by the factor ⩾2. None of our candidates had s.d.s (±C q) satisfying this cut-off, and the lower s.d. values were obtained for eIF2α, G6PDH and GAPDH (values of 1.72, 1.96 and 1.97, respectively) (Fig. 4D – right Y-axis/columns; Supplementary Table 3). As the input to BestKeeper is raw C qs and data are not normalized for each independent experiment, as occurs with geNorm and NormFinder, BestKeeper will tend to be more sensible to interexperimental variation. Nevertheless, we must note that the four genes with lower s.d. (±C q) values pointed by BestKeeper are the same ones indicated by the three other methods used in this work, with a ranking remarkably similar to the one provided using the comparative ΔC q method. Furthermore, when comparing the s.d. (±C q) ranking in combination with the coefficient of correlation to the BestKeeper index (r), there is an inverse and distinct correspondence between these two variables for the first three ranked genes (0.867, 0.843 and 0.785 for eIF2α, G6PDH and GAPDH, respectively; Fig. 4D – left Y-axis/connected dots; Supplementary Table 3).
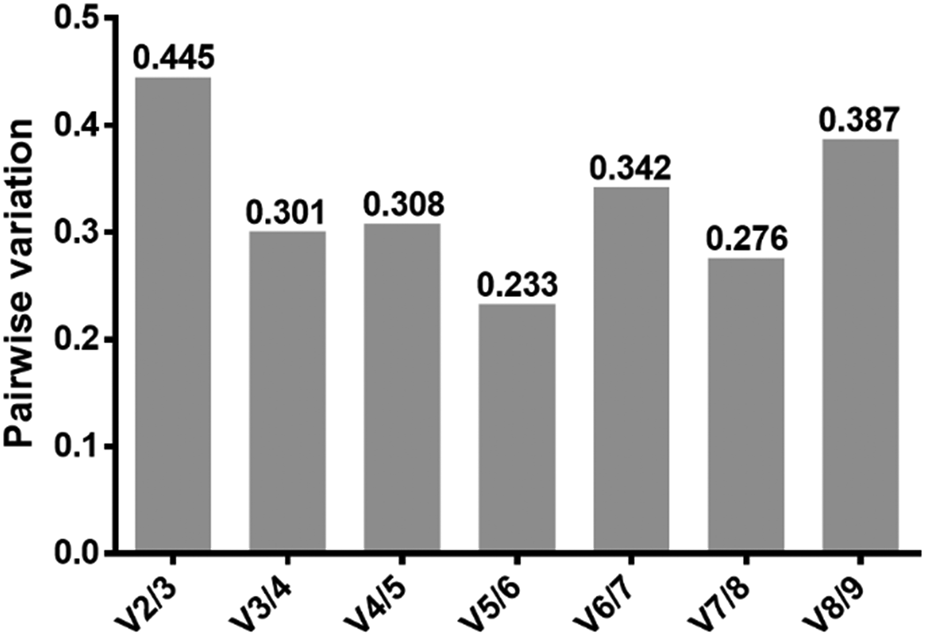
We then returned to the geNorm program to obtain an estimative of the ideal number of reference genes required to perform an accurate analysis of relative gene expression during T. vaginalis differentiation process. This program approaches this task by performing the pairwise variation analysis (V n/V n + 1). The variation value (V) is calculated by stepwise inclusion of more reference genes until noted that the variation contributed by a new gene (V n + 1) has no significant effect on the normalization factor. Although a V value of 0.150 is usually used as the cut-off in this analysis, none of our V values was lower than 0.233 (Fig. 5). In this regard, the geNorm program companion manual states that this threshold is just a recommendation and must not be taken as a strict cut-off, since the trend observed in the graph may be equally informative for this aim. Accordingly, we observe that after adding a 4th reference gene in the analysis, no abrupt changes occur in the pattern of pairwise variation (Fig. 5).
Pairwise variations (V values), as calculated by geNorm program to determine the optimal number of candidate reference genes. Pairwise variations V n/n + 1 were analysed to evaluate the effect of adding new reference genes on the RT-qPCR.

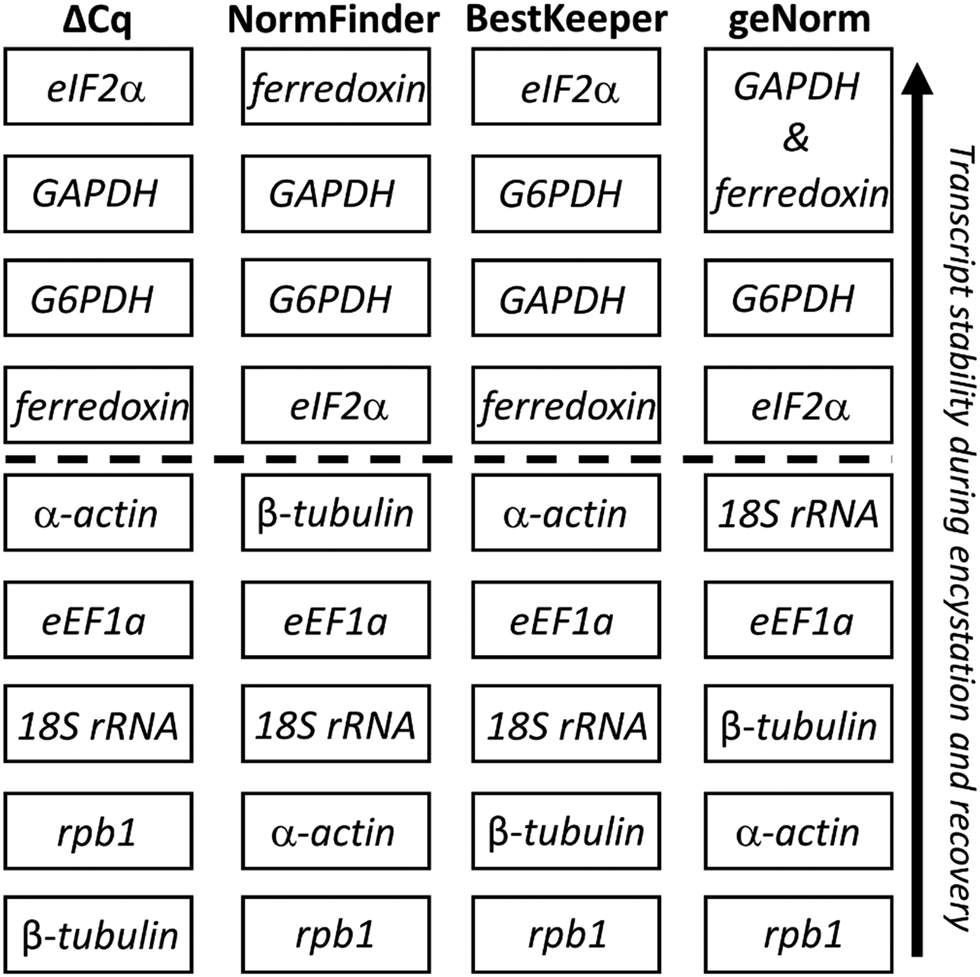
Finally, we have compared the rankings provided by the four methods described above. As each algorithm is mathematically distinct on its premises and calculations, it was expected for the outputs to exhibit some differences, while hopefully retaining a general pattern for transcript stability. Indeed, albeit not in the same ranking order, the top four genes indicated as the more stable were the same for all four approaches (Fig. 6). In order to obtain a final ranking of stability for practical use, we attributed decreasing values (from 4 to 1) for these top four genes in each column and summed these values for each gene, considering the higher sums as indicators of higher stability. Thus, we obtained the following ranking, in descending order of transcript stability: GAPDH (3 + 3 + 2 + 4 = 12) > eIF2α (4 + 1 + 4 + 1 = 10) = ferredoxin-1 (1 + 4 + 1 + 4 = 10) > G6PDH (2 + 2 + 3 + 1 = 8).
Schematic comparison of expression stability rankings calculated following four distinct methods for the determination of reference genes. Genes with higher calculated stability are ranked on top. The dashed line separates the four most stable transcripts from the remaining ones, with less stable expression.

Validation of the stability of selected reference genes via expression analysis of the mRNA from the meiotic recombinase Dmc1
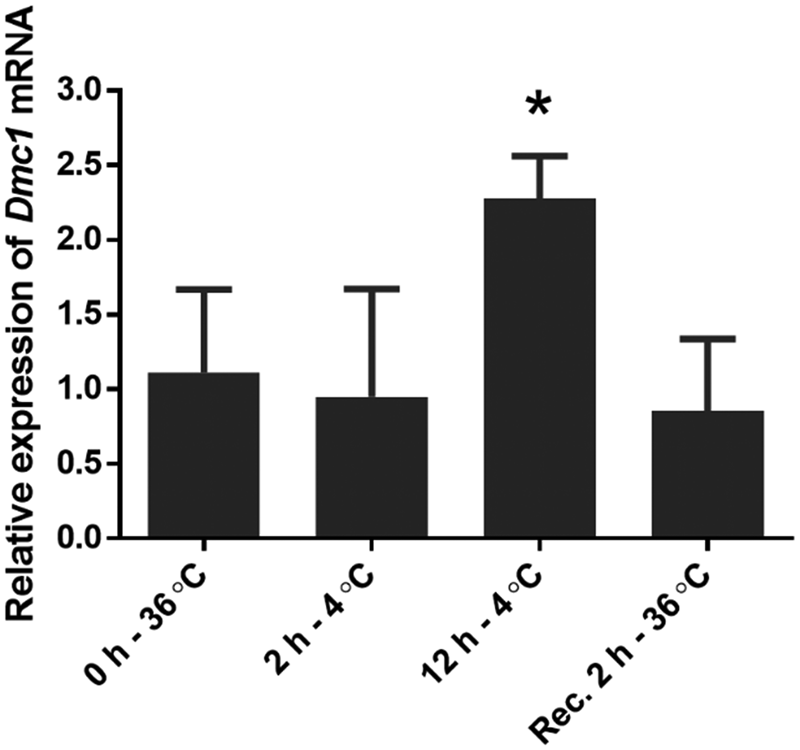
In order to validate the selected reference genes and also to further explore the nature of cyst-like stage of this parasite, we have examined the relative expression of the meiotic recombinase Dmc1 during the cold-induced differentiation of T. vaginalis. The Dmc1 gene is part of the meiosis detection ‘toolkit’, a set of genes whose products are considered exclusive of the meiotic process and which are widely employed to investigate the occurrence of cryptic sexual reproduction across the eukaryotic domain. Although the Dmc1 gene is poorly expressed in all studied T. vaginalis stages (as C qs in 1:100 diluted mRNA were barely detected, no EST (expressed sequence tag) was found in TrichDB databases, neither protein evidence was registered in proteomic studies), its transcripts increase in abundance to more than 2-fold after 12 h at 4°C, returning to basal levels after trophozoite rescue at 36°C (with P = 0.0377; Fig. 7).
Expression profile of dmc1 mRNAs during the cold-induced differentiation of T. vaginalis trophozoites into cyst-like forms and reversal to the trophozoite stage. Normalizations were made using a combination of the four most stable reference genes (GAPDH, ferredoxin-1, eIF1α and G6PDH). Relative expression levels are expressed as the mean ± standard deviation, calculated from three independent biological replicates. *P = 0.0377 (α set to ⩽0.1).

It has been previously demonstrated that T. vaginalis genomes encode most of the genes belonging to the meiosis detection ‘toolkit’ (Malik et al., Reference Malik, Pightling, Stefaniak, Schurko and Logsdon2008; Schurko and Logsdon, Reference Schurko and Logsdon2008; Bradic and Carlton, Reference Bradic and Carlton2018), but the specific physiological conditions in which these genes are expressed are still unknown. We have further investigated the expression of Dmc1, and also of eight other meiotic ‘toolkit’ genes (Msh4, Msh5, Spo11, Hop1, Hop2A, Hop2B, Mnd1 and Mer3), through searching of public available RNA-Seq data from parasites grown in culture medium deprived of glucose (Huang et al., Reference Huang, Chen, Fang, Cheng, Cheng, Chen, Wu, Ku, Chen, Lin and Tang2014) or depleted of iron for 6 h (Cheng et al., Reference Cheng, Huang, Huang, Hsu, Fang, Chiu and Tang2015). We noticed that, with the exception of Hop2A, all of these mRNAs are poorly expressed in control trophozoite cultures. Furthermore, the majority of these transcripts increase in abundance from 2- to 20-fold under these two stressful conditions (Supplementary Fig. 3A and B). Interestingly, Hop2A, which presents higher basal expression levels, does not seem to alter its expression levels along with other meiotic genes, while Hop2B does so. Therefore, we suggest that the Hop2B may be the paralogue of Hop2 directly involved with meiosis in these organisms. As observed for Dmc1, although being detected in these sensible RNA-Seq approaches, due to their low expression levels, most of these genes were not detected at all in EST or proteomic surveys (Fang et al., Reference Fang, Huang, Huang, Lin, Chao and Tang2015; Dias-Lopes et al., Reference Dias-Lopes, Wiśniewski, de Souza, Vidal, Padrón, Britto, Cuervo and De Jesus2018; Beri et al., Reference Beri, Yadav, Devi, Narayana, Gadara and Tatu2020)
Discussion
Since it was recognized that the selection of adequate reference genes was essential for the accuracy of relative gene expression studies using the RT-qPCR methodology, hundreds of articles have been published examining and validating candidate reference genes in a wide variety of organisms and experimental conditions. These studies are of utmost importance, as they provide support for subsequent research and also because it is well known that careless choice of a reference gene will potentially lead to misleading experimental results and conclusions (Matta et al., Reference Matta, Bitner-Mathé and Alves-Ferreira2011). Strikingly, we noted that there are not many publications addressing the establishment of reference genes in parasitic protists, with exceptions made for studies in Phytophthora parasitica, Leishmania major, Trypanosoma brucei, T. vaginalis, Giardia lamblia and Theileria parva (Yan and Liou, Reference Yan and Liou2006; Ouakad et al., Reference Ouakad, Bahi-Jaber, Chenik, Dellagi and Louzir2007; Brenndörfer and Boshart, Reference Brenndörfer and Boshart2010; dos Santos et al., Reference dos Santos, de Vargas Rigo, Frasson, Macedo and Tasca2015; Marcial-Quino et al., Reference Marcial-Quino, Fierro, De la Mora-De la Mora, Enríquez-Flores, Gómez-Manzo, Vanoye-Carlo, Garcia-Torres, Sierra-Palacios and Reyes-Vivas2016; Tsotetsi et al., Reference Tsotetsi, Collins, Oosthuizen and Sibeko-Matjila2018).
Notwithstanding that accurate normalization usually relies upon averaging more than one reference gene, it is known that many publications report RT-qPCR relative expression studies employing a single normalization gene, many times without appropriate validation. Here we provide evidence of four transcripts presenting relatively low levels of variation during T. vaginalis differentiation from trophozoites in cyst-like stages. We strongly recommend that any study regarding this differentiation process should make use of at least the three ones with more stable expression (GAPDH, eIF2α, ferredoxin) as internal controls for invariant expression.
Normalizing expression with GAPDH is one of the most common practices in RT-qPCR relative expression studies in mammal models (Chapman and Waldenström, Reference Chapman and Waldenström2005; Sharan et al., Reference Sharan, Vaiphei, Nongrum, Keppen and Ksoo2015). Interestingly, the same appears to be true regarding the encystation-like process of the highly divergent eukaryote T. vaginalis, as GAPDH gene presented one of the most stable transcripts across all used algorithms. Strikingly, dos Santos et al. (Reference dos Santos, de Vargas Rigo, Frasson, Macedo and Tasca2015) reported that T. vaginalis GAPDH and β-tubulin were among the least stable transcripts in their search for reference genes to be applied in studies approaching the nutritional status of trophozoites. Curiously, actin appeared as one of the more stable transcripts in their study, while we did not observe α-actin in any of our rankings of more stable transcripts. As aforementioned, the work from dos Santos et al. was focused on studying different nutritional conditions, while in our assays, we kept parasites in complete culture media in all experimental points, just altering environmental conditions to induce differentiation into cyst-like forms. Even though the purposes of the two works are quite distinct, we assume that high instability of a transcript in the trophozoite stage would potentially influence the overall analysis of stability along the differentiation into cyst-like forms. One first issue to discuss is that the two works have experimented on distinct strains of T. vaginalis, and there is a possibility that different lineages may exhibit distinctive profiles of gene expression and RNA stability. Thus, we strongly recommend that any further study approaching differential gene expression during the transition between trophozoite and cyst-like forms in other T. vaginalis strains should first confirm the stability of the reference genes described here.
Still considering the differences observed between this work and the previous one from dos Santos et al. (Reference dos Santos, de Vargas Rigo, Frasson, Macedo and Tasca2015), we have performed an analysis of potential amplification targets from primer sets used in both works. It is well known that T. vaginalis presents a remarkably huge genome for a single-celled eukaryote, containing many paralogue copies for most of its housekeeping genes (Carlton et al., Reference Carlton, Hirt, Silva, Delcher, Schatz, Zhao, Wortman, Bidwell, Alsmark, Besteiro, Sicheritz-Ponten, Noel, Dacks, Foster, Simillion, Van de Peer, Miranda-Saavedra, Barton, Westrop, Müller, Dessi, Fiori, Ren, Paulsen, Zhang, Bastida-Corcuera, Simoes-Barbosa, Brown, Hayes, Mukherjee, Okumura, Schneider, Smith, Vanacova, Villalvazo, Haas, Pertea, Feldblyum, Utterback, Shu, Osoegawa, de Jong, Hrdy, Horvathova, Zubacova, Dolezal, Malik, Logsdon, Henze, Gupta, Wang, Dunne, Upcroft, Upcroft, White, Salzberg, Tang, Chiu, Lee, Embley, Coombs, Mottram, Tachezy, Fraser-Liggett and Johnson2007). Although many of these paralogues share a high degree of identity in their nucleotide sequences (>97%), it is likely that their expression may be differentially regulated to some degree, depending on the physiological context faced by the parasite. In this regard, we noticed that some of our primer pairs could actually amplify more than one of those paralogue copies, especially if one or two base mismatches are allowed to occur (Table 1; Supplementary Table 1). In this context, we realized that our GAPDH primers can amplify transcripts from four different GAPDH gene copies (TVAG_347410 [perfect match], TVAG_476100, TVAG_146910 and TVAG_366380), while the primers described by dos Santos et al. were designed against a distinct paralogue GAPDH (TVAG_475220), but are equally able to amplify transcripts from TVAG_146910, TVAG_366380 and TVAG_412780 (and probably, to a lesser extent, also transcripts from TVAG_347410, TVAG_476100 and TVAG_193790). Thus, although the repertoire of paralogous GAPDH targets from dos Santos et al.'s primers overlaps with ours, three of their putative targets are not covered at all by our primers. We hypothesize that possible differences in the expression profiles of these three GAPDH copies (TVAG_475220, TVAG_41270 and TVAG_193790) may explain the lower expression stability reported by dos Santos et al. and, therefore, the discrepancy between our results.
Regarding the β-tubulin coding gene, the primer pair described by dos Santos et al. was designed against a distinct β-tubulin (TVAG_073800), but is also equally able to amplify transcripts from other seven paralogous copies: TVAG_456920, TVAG_062880, TVAG_034440, TVAG_008680, TVAG_525430, TVAG_200200 and TVAG_148400. On the other hand, our β-tubulin primers can amplify transcripts from six different paralogous copies TVAG_456920 [perfect match], TVAG_062880, TVAG_034440, TVAG_008680, TVAG_525430 and TVAG_073810. Once again, we can note an overlap between both assortments, but this time there are three paralogous copies that are not amplified by our primers (TVAG_073800, TVAG_200200 and TVAG_148400) and one copy in ours that is not amplified by dos Santos et al.'s primers (TVAG_073810). Thus, one possibility to explain the differences observed between the two works is that the β-tubulin encoded by TVAG_073810 may present a highly variant expression profile that reduces the overall stability of β-tubulin transcripts, as seen in our analysis. Similar findings were also observed with primers designed by our groups for α-actin and eEF1α. An important lesson from these findings is that, as T. vaginalis genome encodes many nearly identical copies for most of its housekeeping genes, close attention must be paid when designing RT-PCR primers, as well as extra-care should be taken when planning analysis of relative gene expression in this organism.
In the last two decades, high-throughput transcriptomic and proteomic studies became powerful and relatively accessible approaches to unveil the molecular mechanisms underlying complex phenomena such as cellular differentiation (Huang et al., Reference Huang, Huang, Ku, Lin, Alderete and Tang2012; Vogel and Marcotte, Reference Vogel and Marcotte2012). Although RT-qPCR and RNA-seq studies consist of reliable strategies to investigate the abundance of cellular mRNAs, RT-qPCR is desirable and more affordable when screening a relatively small number of transcripts (<50; Nonis et al., Reference Nonis, De Nardi and Nonis2014). However, its accuracy depends heavily on the establishment of suitable reference RNAs. In fact, high-throughput ‘omics’ and RT-qPCR-based studies are usually complementary and can be employed both ways, in order to reinforce and confirm experimental results (see Huang et al., Reference Huang, Huang, Ku, Lin, Alderete and Tang2012; Fang et al., Reference Fang, Huang, Huang, Lin, Chao and Tang2015). As some of these high-throughput approaches have been applied to survey gene expression in T. vaginalis, we attempted to examine the expression profiles of the four more stable genes from our study during other previously reported stressful experimental conditions.
We first examined the datasets generated by Fang et al. (Reference Fang, Huang, Huang, Lin, Chao and Tang2015), who compared gene expression in EST libraries from cold-stressed (4°C for 4 h) and conventionally cultured trophozoites (Supplementary Fig. 4A). With the exception of GAPDH (pooled TVAG_476100, TVAG_146910 and TVAG_366380 ESTs), all the transcripts are represented by <4 ESTs per library, which makes it difficult to compare the relative abundance of these genes. In particular, eIF2α did not match any EST in both libraries, which is in agreement with higher C q values presented by this gene (see Fig. 3A). In general, no larger discrepancies were observed for GAPDH and G6PDH, with none of the databases varying more than twice in their number of ESTs. This is in reasonable agreement with our findings of combined stable expression of these mRNAs during cold-induced differentiation in cyst-like forms. We must remark that these profiles are from the first 4 h of cold treatment, while, at least in our experiments, cyst-like forms became abundant only after 12 h at 4°C.
Next, we examined the RNA-Seq dataset produced by Cheng et al. (Reference Cheng, Huang, Huang, Hsu, Fang, Chiu and Tang2015), who compared gene expression between iron-depleted parasites (treated with dipyridyl for 6 h) and normal trophozoites (Supplementary Fig. 4B). GAPDH (pooled) and G6PDH seem to increase their expression (in RPKM units) by 2-fold in iron-depleted parasites, while ferredoxin-1 and eIF2α show 3- to 4-fold increases in the absence of iron. Analogously to what was seen before for cold-stressed parasites, these expression profiles are from the first 6 h of treatment with dipyridyl, while Dias-Lopes et al. (Reference Dias-Lopes, Saboia-Vahia, Margotti, Fernandes, Castro, Oliveira-Júnior, Peixoto, Britto, Silva-Filho, Cuervo and Jesus2017, Reference Dias-Lopes, Wiśniewski, de Souza, Vidal, Padrón, Britto, Cuervo and De Jesus2018) treated their cultures for at least 24 h with the same drug in order to observe the abundance of cyst-like forms/pseudocysts.
Finally, we examined the RNA-Seq datasets generated by Huang et al. (Reference Huang, Chen, Fang, Cheng, Cheng, Chen, Wu, Ku, Chen, Lin and Tang2014), who compared gene expression along 36 h in trophozoites grown in glucose-restricted culture medium (Supplementary Fig. 4C). In these conditions, GAPDH has its expression drastically decreased in a time-dependent manner, G6PDH increases its expression during the first 24 h and gets back to initial levels in 36 h, eIF2α expression tends to be downregulated and ferredoxin-1 seems to keep a more stable expression over the time course of glucose restriction. Glucose restriction is a microenvironmental challenge that has a drastic impact over energetic metabolism and, consequently, it is expected that the expression of enzymes such as GAPDH and G6PDH will be modulated accordingly. It is important to note that, despite being a relevant nutritional stress for this parasite, neither the manuscript from Huang et al., nor other works investigating the aspects of glucose restriction in T. vaginalis physiology, have reported this stimulus as an inducer of T. vaginalis differentiation into cyst-like forms (Hernández-García et al., Reference Hernández-García, Miranda-Ozuna, Salazar-Villatoro, Vázquez-Calzada, Ávila-González, González-Robles, Ortega-López and Arroyo2019; Huang et al., Reference Huang, Chen, Lin, Cheng, Lin, Lin, Huang, Chiu and Tang2019; Miranda-Ozuna et al., Reference Miranda-Ozuna, Rivera-Rivas, Cárdenas-Guerra, Hernández-García, Rodríguez-Cruz, González-Robles, Chavez-Munguía and Arroyo2019).
In addition, two proteomic studies are available concerning cyst-like/pseudocyst forms in T. vaginalis. In particular, Dias-Lopes et al. (Reference Dias-Lopes, Wiśniewski, de Souza, Vidal, Padrón, Britto, Cuervo and De Jesus2018) have performed a comprehensive quantitative analysis of pseudocysts and trophozoite proteomes and we have also searched through their data to investigate protein expression profiles related to the four more stable RNAs of our analysis. Substantial differences in protein amount per cell type (more than 2-fold) could be noted for most of the genes, although none of them was statistically significant (Supplementary Fig. 5). However, even if there are significant differences in protein amount between these two parasite forms, it will not implicate in substantial differences in transcript levels, as it is known that a direct correlation between mRNA and protein levels is not a mandatory rule, as their concentration is influenced by diverse and independent factors, such as half-lives of both transcripts and their protein products (Vogel and Marcotte, Reference Vogel and Marcotte2012). The article from Beri et al. (Reference Beri, Yadav, Devi, Narayana, Gadara and Tatu2020) also includes a proteomic investigation between cyst-like forms and trophozoites, but on a qualitative and less comprehensive scale. Of note, Ferredoxin-1 was present in all of the three replicates of trophozoites proteins and two of three replicates of cyst-like forms, consisting of a protein common in both parasite stages. Thus Ferredoxin-1 seems not to be up or downregulated during the differentiation to cyst-like form, corroborating our findings for its transcript stability.
Sexual reproduction and meiotic nuclear division are currently regarded as ancestral traits of the eukaryotic domain, as they have been demonstrated in the members of all the major supergroups of eukaryotic organisms (Malik et al., Reference Malik, Pightling, Stefaniak, Schurko and Logsdon2008; Hofstatter and Lahr, Reference Hofstatter and Lahr2019). It has been proposed that these mechanisms evolved in eukaryotic evolution as a way to deal with harsh environmental conditions, allowing the emergence of new genetic combinations that could improve fitness and survival (Speijer et al., Reference Speijer, Lukeš and Eliáš2015; Ram and Hadany, Reference Ram and Hadany2016). In fact, diverse microbial eukaryotes, such as Saccharomyces cerevisae and Chlamydomonas reinhardtii, are known to undergo meiosis and fertilization when challenged with stressful environments (Mitchell, Reference Mitchell1994; Goodenough et al., Reference Goodenough, Lin and Lee2007). Meiotic division and plasmogamy are long known to occur in symbiotic Parabasalia flagellates living in the gut of wood-feeding insects, as compelling morphological evidence was provided by Lemuel R. Cleveland in the 1950s (Cleveland, Reference Cleveland1956). Curiously, in some species, as in Trichonynpha sp., Macrospironynpha sp. and Leptospironynpha eupora, these sexual processes involve cyst-like intermediates (Cleveland, Reference Cleveland1956). In addition, meiotic-like features were also described in the cyst-stage of the diplomonad parasite Giardia intestinalis (Poxleitner et al., Reference Poxleitner, Carpenter, Mancuso, Wang, Dawson and Cande2008), that, together with Parabasalia, is part of the Metamonada clade of anaerobic eukaryotes. Despite the lack of direct cellular evidence concerning the occurrence of meiosis and sex in T. vaginalis, its genome contains most of the genes from the meiosis detection ‘toolkit’ (Malik et al., Reference Malik, Pightling, Stefaniak, Schurko and Logsdon2008; Schurko and Logsdon, Reference Schurko and Logsdon2008; Bradic and Carlton, Reference Bradic and Carlton2018). We show here that a diversity of stress stimuli may lead to increased expression of meiotic genes in T. vaginalis, which is probably associated with meiotic recombination and other sex-related events. As the cyst-like/pseudocysts are recognized as a resistance stage for this parasite (Pereira-Neves et al., Reference Pereira-Neves, Ribeiro and Benchimol2003), it is conceivable to hypothesize that these forms may represent the life cycle stage in which these sex-related phenomena will naturally occur in these organisms. Thus, although many details remain to be investigated, the upregulation of a meiosis-specific mRNA during cold-induced cyst-like differentiation in T. vaginalis may indicate that, as in some other metamonad microorganisms, cryptic sexual phenomena may occur in these resilient cyst-like stages.
Although T. vaginalis cyst-like forms, also known as pseudocysts, are known since the first half of the 20th century (e.g. Hogue, Reference Hogue1943), it was only recently that significant progress has been made in revealing the aspects of their ultrastructure, proteomics and physiology (Pereira-Neves et al., Reference Pereira-Neves, Ribeiro and Benchimol2003; Yeh et al., Reference Yeh, Huang, Richie-Gan, Huang, Wang and Tang2013; Dias-Lopes et al., Reference Dias-Lopes, Saboia-Vahia, Margotti, Fernandes, Castro, Oliveira-Júnior, Peixoto, Britto, Silva-Filho, Cuervo and Jesus2017, Reference Dias-Lopes, Wiśniewski, de Souza, Vidal, Padrón, Britto, Cuervo and De Jesus2018). However, many questions remain to be addressed, such as their precise role on T. vaginalis life cycle, the specific natural microenvironmental stimuli that promote both differentiation and trophozoites resurgence, their role on parasite virulence, etc. We hope that our work will be of great benefit for future investigations approaching these questions and that the reference genes stablished here will be of help in setting up a more accurate analysis of gene expression profiles during the cyst-like differentiation events in T. vaginalis.
Supplementary material
The supplementary material for this article can be found at https://doi.org/10.1017/S0031182021000585
Data
The datasets used in this study are available from the corresponding author upon reasonable request.
Acknowledgements
We thank Professor José Batista de Jesus (UFSJ/MG, Brazil) for kindly providing the JT strain of T. vaginalis, and Professor Petrus Tang (Chang Gung University/Taiwan, China) for kindly proving datasets generated by his laboratory. We would also like to thank the anonymous reviewers for their valuable suggestions regarding this manuscript.
Author contributions
J.F.P., R.N.F. and J.L.N.S. conceived and designed the study. J.F.P., J.L.N.S., V.S.C.O., D.G.S. and L.R. performed experiments. J.F.P. and J.L.N.S. wrote the article.
Financial support
This research was supported by an undergraduate scholarship to J.F.P. from the National Council for Science and Technology (CNPq), under the PIBIC-UFRJ/CNPq program.
Conflict of interest
None.
Ethical standards
Not applicable.