I. INTRODUCTION
Two-phase titanium alloys, such as Ti–6Al–4V, have been widely used as an excellent structural material in aeronautic, astronautic, automobile, chemical, and biomedical industries and thanks to its ideal properties like low density, high strength-density ratio, superior corrosion resistance, and fantastic biocompatibility.Reference Boivineau, Cagran, Doytier, Eyraud, Nadal, Wilthan and Pottlacher1–Reference Khan, Williams and Williams3 However, great resistance of deformation at an ambient condition inhibits the large-scale application especially for civilian use. For better formability, various traditional heating treatments (THTs) have been brought out in the materials post-processing treatments. Unfortunately, grain growth and severe oxidation layer on materials surface under the condition of high temperature and long-time furnace-heating, which deteriorates mechanical and in-service property.Reference Gil and Planell4 Electropulsing treatment (EPT), as a promising post-processing treatment technique, has been applied for improving the plasticity of metals and alloysReference Troitskii and Likhtman5–Reference Potapova and Stolyarov8 and transforming the microstructure.Reference Gromov and Petrunin9–Reference Zhu, Liu, Tang, Shi and Fu12 Conrad et al.Reference Conrad13,Reference Okazaki, Kagawa and Conrad14 found that DC pulses facilitate the recovery and recrystallization in the annealing of cold-worked copper. Gromov et al.Reference Gromov, Ivanov, Stolboushkina and Konovalov15–Reference Gromov, Gorbunov, Ivanov, Vorobiev and Konovalov17 studied dislocation substructure evolution on Al creep under weak electric potential and formation of surface gradient structural-phase states under electron-beam treatment of stainless steel. Zhu et al.Reference Zhu, To, Lee, Liu, Jiang and Tang18,Reference Zhu, To, Lee, Liu, Jiang and Tang19 studied the microstructure and elongation of Zn–Al alloy under electropulsing, which pointed out the processing increased the elongation by 437% remaining the instant tensile stress unchanged. Zhang et al.Reference Zhang, To, Zhu, Wang and Tang20 conducted the research on microstructural changes and their effect on the ultra-precision machining of cold-rolled (CR) AZ91 magnesium alloy under static EPT. The short time and low temperature in the process of EPT have advantages in the materials processing to improve the microstructures, but relevant research studies in the titanium alloy are scarce. In this paper, the effect of the EPT on the microstructure and the mechanical properties of the CR Ti–6Al–4V strip is reported and the mechanism of the effect is discussed.
II. EXPERIMENTAL
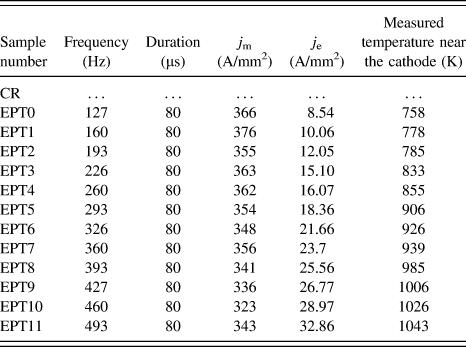
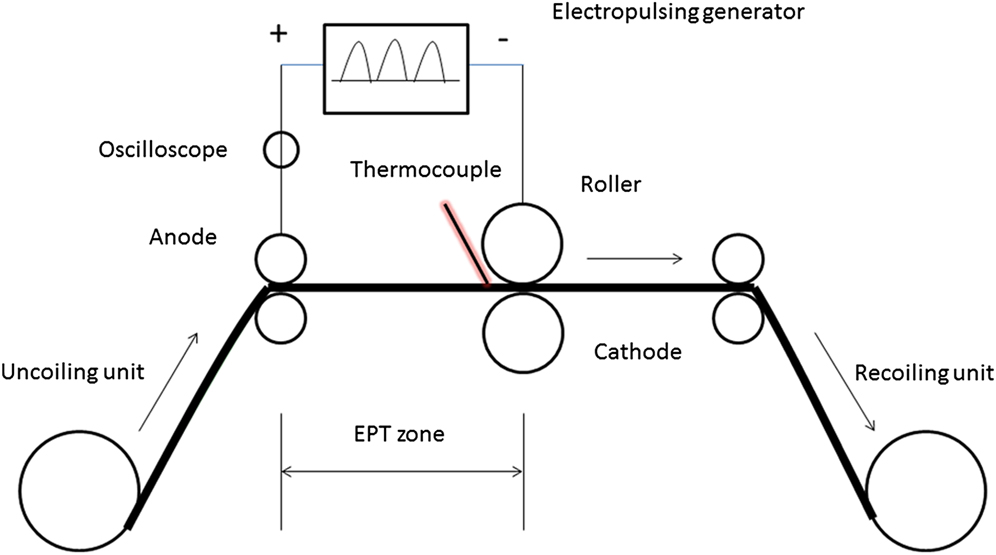
The commercial titanium alloy Ti–6Al–4V (6.66% Al, 5.13% V, 0.21% Fe, 0.03% Mo, balance Ti) was utilized. After annealing at α + β two-phase fields for 1 h, the Ti–6Al–4V strip was cold rolled in a single pass down to 1.36 mm from 1.6 mm thick corresponding to a compressive deformation rate of 15% without the side crack. Samples under EPT were subjected to multi-frequency high-energy current pulses with various parameters (see Table I). The entire on-line EPT process is shown schematically in Fig. 1. The Ti–6Al–4V strips moved through two electrodes (distance is 225 mm) at a speed of 3.6 m/min within multiple frequency electropulses. A self-made electropulsing generator supplied the positive pulses within the minimal time duration. The pressure between the two electrodes and the strips was sufficient to keep good electrical contact without deforming the materials. Electropulsing treatment was applied to the moving strips with various frequencies and the same duration. The electrical parameters including frequency, root-mean-square current (RMS), amplitude, and duration of current pulses were monitored by a Hall effect sensor connected to an oscilloscope. The temperature of strips near the cathode was measured by a thermocouple. Hitachi S-4800 FEG scanning electron microscope (SEM; Japan) was utilized to study the fracture surface of the samples. HiROX KH-7700 optical microscope (Australia) was used in the research of microstructure observation. X-ray diffraction (XRD) was utilized to characterize the constitution of phases by a Rigaku micro-diffraction goniometer equipped with a one-dimensional detector using Cu radiation operated with 40 kV/200 mA. The uniaxial tensile tests at an ambient temperature were conducted to measure the mechanical properties by a mechanical tensile testing machine. With the help of electron backscatter diffraction (EBSD) technique, the evaluation of the texture and misorientation angle (MA) distribution can be feasible and accurate.
EPT parameters during the processing.

Note: j m is the amplitude of the current density during EPT and j e represents the RMS value of current density during EPT.
Schematic view of EPT process.

III. EXPERIMENTAL RESULTS
A. Mechanical property during EPT
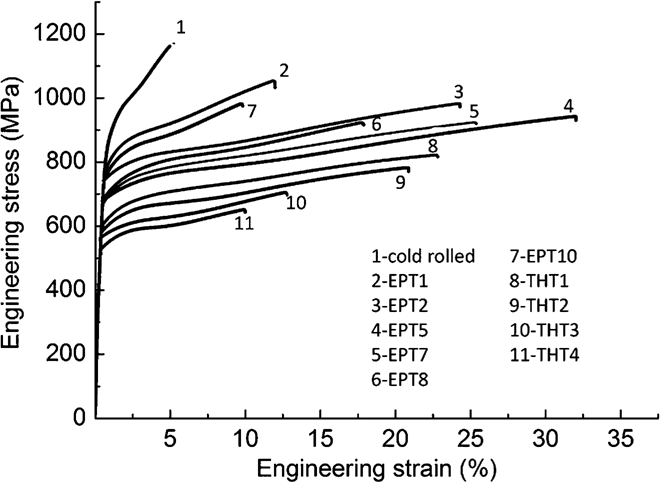
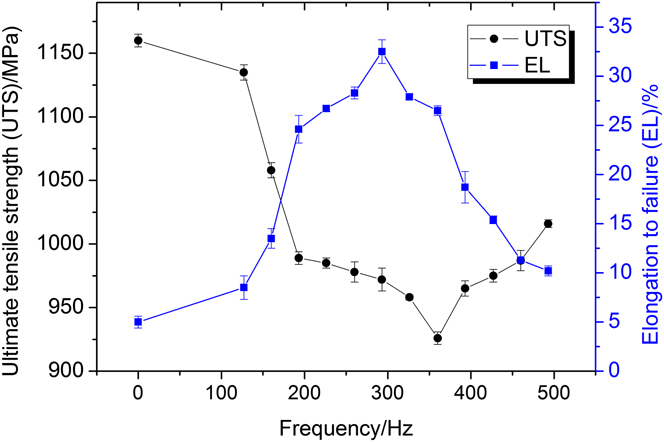
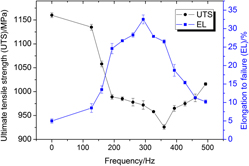
The engineering stress–strain curves of the CR titanium alloy specimens and EPT samples that have been conducted with the uniaxial tensile testing tests are presented in Fig. 2. Then, a meaningful outcome of the dependency of the ultimate tensile strength (UTS) and the elongation to failure (EL) of the EPT samples on the processing frequency has been conducted and shown in Fig. 3. When the EPT frequency increased (from 160 Hz), EL sharply reached a maximum value (32.5%) at 293 Hz in the low-frequency period and then decreased slightly with further increasing frequency. UTS of the specimens decreased at this similar process slowly to the 360 Hz but gradually rises in the high-frequency period. In the low-frequency part, compared with the 427 Hz-EPT specimen (the strength is at the same level with 293 Hz-EPT, EL was as low as 15.4%), 293 Hz-EPT specimen presented an outstanding elongation at more than twice that of 427 Hz-EPT EL (111.04% increment). While at this increasing EL trend, the UTS for the low-frequency specimen has just a slight decrease. It is convenient to determine the relative characteristics Δσ and Δδ as measuring the effects of the EPT on the mechanical property with the changes in the frequency:
 $$\Delta \sigma = {{\sigma _{{\rm{cr}}} - \sigma _{\rm{t}} } \over {\sigma _{{\rm{cr}}} }} \times 100\% \quad ,$$
and
 $$\Delta \delta = {{\delta _{\rm{t}} - \delta _{{\rm{cr}}} } \over {\delta _{{\rm{cr}}} }} \times 100\% \quad ,$$
where σt means the UTS of the samples under EPT and σcr means the UTS of the CR samples, δt is the EL of the samples under EPT, and δcr means the EL of the CR samples. For the 293 Hz-EPT, the Δδ can be 550% and Δσ is 16.2%, so it is obvious that EPT enhanced the ductility greatly just sacrificing a little strength. In the following increased frequency of EPT to 360 Hz, the UTS and EL both obtained a bit decrease. In the high-frequency EPT, the EL of the samples dropped at a certain extent but specimens obtained increasing tensile strength to show a nice comprehensive mechanical performance.
Engineering stress–strain curves of the specimens under EPT and THT.

Dependency of the UTS and the EL of the EPT samples on the EPT processing frequencies.

Obviously, EPT improved the materials ductility largely just having a minor side effect on the strength property. It is reasonable to conclude that EPT technique brought in noticeable benefits to the materials mechanical property. What is more abstracting, it is feasible to select the suitable EPT parameters to obtain the needed property to fulfill the different applications (high ductility materials or outstanding comprehensive ones). This process is clean and highly efficient under the EPT within just several seconds and low temperature.
Figure 4 demonstrated the SEM fractographs of CR specimen and ones under EPT with different frequencies. For the CR sample, typical brittle fracture behavior of the poor ductility presented 10–20 μm wide river patterns, microcracks, and smooth cleavage plane. At 160 Hz-EPT [Fig. 4(b)], the improved ductility lead to the quasi-cleavage characterized as 20 μm cleavage planes, and surrounding them little and shallow dimples appeared. By increasing the frequency to 226 Hz, the fractographs with more than 50 μm long tear ridge and some more large-sized dimples denoted the characteristics of an intermediate ductile fracture mode. When the frequency of EPT was 293 Hz, 20 μm and 5 μm large and deep dimples presented the ductile fracture corresponding to the optimal ductility as shown in Figs. 2 and 3. By increasing the frequency of EPT to 360 Hz, around the dimples there appeared tear ridges again to present the intermediate ductile fracture presented in Fig. 4(e). The characteristic fracture explained the decreased ductility due to the grain coarsening. When the frequency of EPT was 460 Hz, further decreased ductility lead to the quasi-cleavage fracture composing of dimples and cleavages, which is similar to the fracture behavior of 160 Hz EPT because of nearly the same level plasticity.
SEM fractographs of (a) CR sample and samples under EPT with various frequencies: (b) 160 Hz-EPT, (c) 226 Hz-EPT, (d) 293 Hz-EPT and (e) 360 Hz-EPT and (f) 493 Hz-EPT.

B. Microstructure evolution during EPT and THT
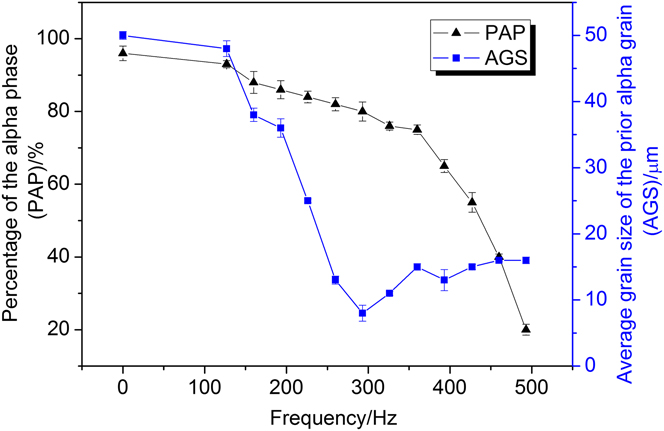
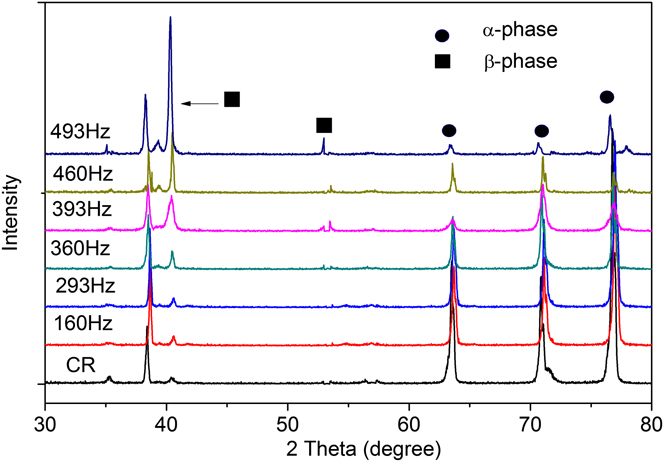
Figure 5 demonstrated the typical microstructure evolution of the CR and EPT samples under various EPT parameters. Figure 6 shows the relationship between the frequencies and microstructure characteristics to present the percentage of the alpha phase (PAP) and the average grain size of the prior alpha grain (AGS). The CR sample was characterized [Fig. 5(a)] as generally inhomogeneous deformed microstructure with fragmented small grains and elongated grains with the average grain size 50 μm. The deformed twins can be seen in the large grains. By increasing the frequency to 160 Hz, the early state of the recrystallization and recovery process can be shown in Figs. 5(b) and 5(c). Polygonal grain boundaries occurred at the margin of the large grains are denoted by white arrows in Fig. 5(c). Inhomogeneous nucleation of preliminary recrystallization occurred along the intensive strain area (grain boundaries and deformed twins) is denoted by black arrows in Fig. 5(c). When frequency went up to 193 Hz, the deformed microstructure and grain boundary gradually weakened accompanied by the augmented volume fraction of recrystallization and diminished AGS (36 μm). By further increasing the frequency to 260 Hz, deformed microstructure comes to be indistinct accompanied by the occurrence of the homogeneous nucleus recrystallization. The original grain boundary is ambiguous by the formation of new grains and the AGS of refined grains is 13 μm. At 293 Hz-EPT shown in Fig. 5(f), the microstructure full of complete recrystallization consumes large amounts of deformed structure and microtwins. At the same time, the microstructure consisted of dual size grains (5 μm and 20 μm). The microstructure presented in Fig. 5(g) is homogenized to the uniform equiaxed grains (11 μm) under the 326 Hz-EPT. By increasing the frequency to 360 Hz, the grains grow up slightly to 15 μm within the low temperature and short time treatment. Meanwhile, a small amount of β phase appeared from the alpha matrix which is shown by XRD patterns. The morphology of β phase exhibited two forms as shown in Fig. 5(h): (a) long and consecutive grains along the alpha grain boundaries and grow into the interior of the grains; (b) agglomerated and tended to be equiaxial at trigeminal point of alpha grains. By increasing the frequency to 393 Hz, more β phase transformations appeared as shown in Fig. 5(i), AGS decreased to 13 μm instead of coarsening grains compared with the previous result [Figs. 5(f)–5(h)] and PAP dropped rapidly to 65% with the XRD peaks of beta phase strengthened. When the EPT frequency went up to 427 Hz, α and β phase transformation continued with PAP decreasing to 55% and AGS growing up slightly to 15 μm. Two forms of β phase have an additional change: (a) the thickness of the strip-like beta grows to be 3 μm; (b) equiaxed grains grow up to be 5 μm and 20 μm as dual-size grains microstructure. At 460 Hz, discontinuous equiaxed α grains and fine lamellar grains presented the characteristic duplex microstructure with 40% PAP. Due to the transient electropulses of high-frequency EPT and β phase growing into the interior α grains, high-level frequency EPT did not lead to the grains growth severely. Additionally, fine equiaxed α grains and lamellar grains existed in the transformed β grains. When the frequency came to 493 Hz, the phase transformation predominantly appeared to make a complex microstructure including retained equiaxial α grains at the intersection of beta grains and α colony (30 μm) precipitated from the original β phase. But there are no obvious consecutive mesh grain boundaries for the transformed β grains.
Typical microstructures of (a) CR sample and samples under different frequency-EPT at (b) and (c) 160 Hz, (d) 193 Hz, (e) 260 Hz, (f) 293 Hz, (g) 326 Hz, (h) 360 Hz, (i) 393 Hz, (j) 427 Hz, (k) 460 Hz, and (l) 493 Hz.

The duplex relationships between the frequency and microstructure characteristics: left side—the PAP, right side—AGS.

The more characteristic details (PAP, AGS) of the microstructure had been concluded in Fig. 6. From the PAP evolution with the changed frequency it could be divided into two parts: (a) lower than 360 Hz the percentage gradually decreased on account of mainly recrystallization existed in the microstructure of the material by increasing the frequency; (b) from 360 to 493 Hz, α phase sharply dropped from 75% to 20% by the account of predominant phase transition from α phase to β phase. On the other part, there were chiefly three parts in the AGS-frequency relationship: (a) from CR state to 293 Hz-EPT state, the grain size sharply decreased lower than 10 μm owing to the incomplete and complete recrystallization effect to form new and fine grains replacing the original great grains; (b) for the 326 Hz-EPT and 360 Hz-EPT, the grains came to grow up to 15 μm large grains; (c) larger than 360 Hz-EPT samples, AGS remained nearly 15 μm instead of the grain coarsening like the previous state. For the (c) part, AGS could be stabilized at a low level mainly due to three reasons: (i) the temperature of EPT is relatively low and persisting time is short to restrict the grains coarsening; (ii) in the process of the α phase transforming into β phase, the β phase grows into the interior of α grains to make the smaller grains; (iii) in the cooling process fine lamellar α grains (1–2 μm) precipitated from the transformed β phase.
To compare the results in the different EPT conditions, microstructure of THT conducted in the different heating parameters is presented in Fig. 7. Inhomogeneous nucleus of primary recrystallization in the severe strain area occurred accompanied by a small amount of phase change shown in Fig. 7(a) at a temperature of 1025 K in isothermal heating furnace for 1 h. The parameter (1025 K, 1 h) of THT is selected as the original temperature and heating time for primary recrystallization process in the CR state titanium alloy. Similarly, the EPT parameter for primary recrystallization period is EPT-160 Hz as shown in Figs. 5(b) and 5(c). However, the processing temperature (778 K) of EPT is much lower than the temperature of THT (1025 K), the decreasing temperature can be 247 K. In addition, unlike the THT process, the processing time for EPT is as short as about 17 s for 1 m material which is faster than the whole procedure for THT to make the similar microstructure. Due to high temperature in long lasting time furnace annealing the grains of THT grow up easily to 23 μm equiaxial grains and more than 60 μm long size lath grains. Another parallel example of THT parameter is selected as heating temperature 1225 K and isothermal time 30 min for obtaining the typical duplex microstructure as presented in Fig. 7(c). Consecutive mesh α phase grain boundaries and about 60 μm original β grains occurred to deteriorate the relative mechanical property by the high temperature and long heating time of THT. At the same time, about 10% coarsening α phase grain exhibited in the intersectional position. Similarly, the treatment process of 460 Hz-EPT is faster and at a lower temperature (1026 K), the decreasing temperature can be 199 K and decreasing time can be from 30 min to tens of seconds. Thanks to low temperature-fast process, the transformed beta grains are smaller and there are no mesh alpha grain boundaries to maintain the mechanical property as shown in Fig. 3. Unlike the EPT processing, furnace heating cannot obtain the complete recrystallization microstructure as EPT (293–360 Hz). Instead, typical phase change example occurred in the THT (1125 K, 1 h) instead of further recrystallization process with the increasing temperature from primary recrystallization THT (1025 K, 1 h). At high temperature, the thermodynamic driving force for phase change is greater than that for recrystallization process. So the phase change is prior to occur under the THT processing. While temperature for EPT processing (193–360 Hz) is lower to be 785–939 K to guarantee the thermodynamic driving force for recrystallization is greater to proceed as can be seen from Figs. 5 and 8. At low frequency (160–360 Hz), the peaks of β phase nearly stayed at a weak level nearly unchanged as shown by XRD pattern in Fig. 8. And in this period, the recrystallization gradually occurred and grew up as shown in Figs. 5(b)–5(h). Additionally, with the help of the athermal effect of EPT, the atoms flux is accelerated to facilitate dislocations climbing and the formation of subgrains so that the thermodynamic energy barrier can be decreased. Therefore, recrystallization process can appear at a low temperature and in a rapid process of EPT. After the occurrence of duplex microstructure (equiaxed grains and lamellar grains from transformed beta phase) in the THT (1225 K, 30 min), higher temperature experiment (1253 K, 6 min) in the upper two-phase region is conducted by the comparison of high-frequency EPT experiment. Under this THT condition, about 5 μm thick mesh α phase boundaries appeared as denoted by black arrows presented in Fig. 7(d) which is badly deleterious to the mechanical properties. At the same time, 60 μm α colony and 30 μm intersect basket microstructure occurred inside the 200 μm β grains. Not only has the mechanical property deadly been diminished, but also the serious surface oxidation phenomenon appeared in this high temperature process. However, it is totally different for increasing the frequency of EPT on the basis of duplex microstructure (460 Hz) to 493 Hz. Although the beta phase further increased with the increasing frequency, alpha grains with the various shapes distributed in the transformed beta grains in disorder instead of mesh grains boundaries formation as high temperature 1253 K of THT. The mechanical property of high-frequency EPT sample shows that the strength is increased and plasticity is diminished slightly.
Typical microstructures of CR samples under THT1-THT4 (traditional heat treatment): (a) 1025 K, 1 h; (b) 1125 K, 1 h; (c) 1225 K, 30 min; and (d) 1253 K, 6 min.

XRD patterns for samples at various processing conditions.

XRD patterns (Fig. 8) presented the phase transition of specimens under the various frequency-EPT. At 160 Hz, α phase slightly transformed into β phase with the peaks of beta phase strengthening slightly. However, at 293 Hz seldom phase transformation occurred during this process. So, at low frequency (160–293 Hz), no obvious phase transition appeared with unchanged peaks of beta phase. In fact, there was no obvious phase change until 393 Hz-EPT from the pattern. In the high-frequency period from 393 to 493 Hz, large amount of phase transition appeared. From the XRD patterns, the conclusion could be drawn that at low frequency there was not much phase change (in fact recrystallization at this stage in Fig. 5) but at high frequency especially after 360 Hz phase change played a predominant role under EPT. Interestingly, different phenomena appeared due to thermal effect and athermal effect under different frequency-EPT which will be discussed in the discussion section B and section C in detail.
C. Texture evolution during EPT
The  $\left\{ {0001} \right\}$ and
 $\left\{ {10\bar 10} \right\}$ pole figures through the EBSD analysis of the titanium alloy under EPT have been presented in Fig. 9. Figure 9(a) showed the strong basal texture of the samples in the CR state with the maximum intensity of 17.12, which explained the poor plasticity due to scarce slip systems under strong basal texture. By increasing the frequency to 160 Hz and 293 Hz as demonstrated in Figs. 9(b) and 9(c), the basal texture weakened gradually that is one of the reasons of the improved EL. At the same time, the (10 − 10) tended to turn to rolling direction. More slip systems according to the texture under the EPT lead to better ductility of the samples. When the frequency was up to 360 Hz, the basal texture in the contrary increased a bit to 9.55 from 8.86 which is in agreement with slight decreasing ductility due to the grown up grains. If the EPT frequency came to 393 Hz and 493 Hz, the basal texture pointed out in Figs. 9(e) and 9(f) gradually further increased to 13.73 that leads to the decreased plasticity of the high-frequency EPT specimens.
The  $\left\{ {0001} \right\}$ and
 $\left\{ {10\bar 10} \right\}$ pole figures of the Ti–6Al–4V alloy at (a) CR situation and under EPT situations: (b) 160 Hz, (c) 293 Hz, (d) 360 Hz and (e) 393 Hz and (f) 493 Hz.

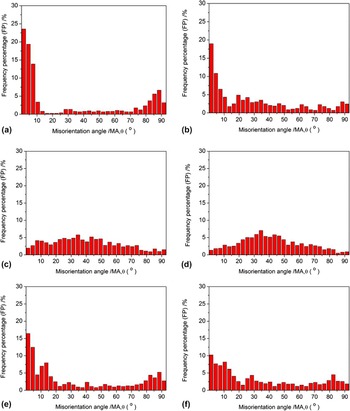
MA distributions of the titanium alloy at CR state and under EPT situations have been demonstrated in Fig. 10. Low angle grain boundaries (LAGB defined as lower than 15°) and large angle grain boundaries (LGAGB defined as larger than 80°) accumulated for the CR specimen pointed out in Fig. 10(a). The MA evolution with the changed EPT frequency could be separated into two parts roughly: (a) recovery and recrystallization period and (b) phase change period.
MA distribution of the titanium alloy at (a) CR status and under EPT situations: (b) 160 Hz, (c) 293 Hz, (d) 360 Hz and (e) 393 Hz and (f) 493 Hz.

When the frequency went up from 160 to 360 Hz, LAGB and LGAGB decreased by the incomplete recrystallization and 20–60° grain boundaries distributed more intensively and uniformly denoted in Figs. 10(b)–10(d). Because dislocation and twins accumulated and piled up during the cold-rolling, MA prefers to locate LAGB and LGAGB. Low-frequency EPT effect inducing recrystallization nucleation and growth sacrificed large amounts of microdefects like piled-up dislocations and twins. Therefore, relative plasticity improved by breaking up the dislocation tangling and decreasing deformation twins. It is this change in the substructure to bring in the LAGB and LGAGB slight diminishment in the 160 Hz inhomogeneous recrystallization process with the consumption of small amounts of defects. When the frequency was up to 293 Hz, 20–60° grain boundaries sharply accumulated by the consumption of large amount of LAGB and LGAGB. At this process, complete recrystallization occurred and nucleated consuming the line defect and deformed twins. If the frequency is 360 Hz, mediate grain boundaries further accumulated sacrificing large amounts of dislocations and the grains grow up rapidly due to weakened dislocation pinning effect.
When the frequency came to 393 Hz, the thermal effect of EPT played a predominant role in the microstructure evolution [also demonstrated in Fig. 5(i)], so phase transition took advantage in the nucleation and growth exhausting the less defects like dislocation and twins to retain more LAGB and LGAGB than the recrystallized process presented in Fig. 10(e). Due to more residual dislocations and twins, the plasticity of the high-frequency specimens is therefore lower than that of complete recrystallization (293 Hz). By further increasing the frequency to 493 Hz, medium angle grain boundaries had a slight increment. Owing to limited ability to reduce the amount of defects by phase change in the short time and low-temperature EPT processing, the UTS remained at a relatively high level. Thus, it's concluded as three laws by comparing these two points: (a) The phase transformation occurred at high-frequency period and recrystallization at low-frequency period. (b) The abilities in consuming defects (dislocations and twins) for nucleus and growth for recrystallization and phase transition are different. The consuming rate of defects for recrystallization is larger than that for phase transition. (c) Only through the phase transformation deformed substructure still remains but recrystallization process could not.
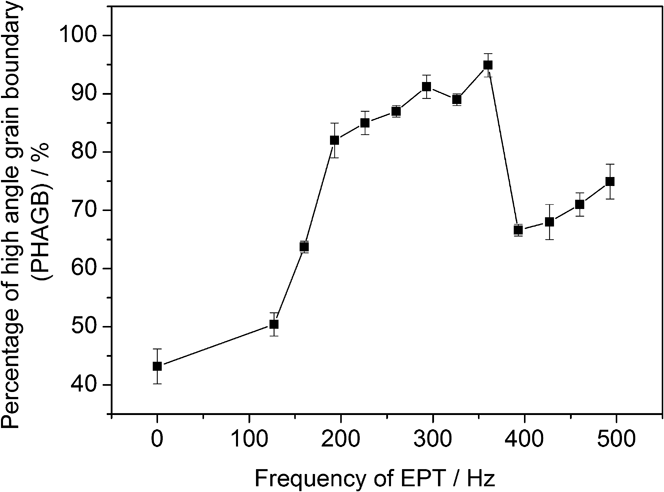
High angle grain boundaries (HAGB) are defined as the MA, which is more than 15°. Thus, percentage of high angle grain boundaries (PHAGB) evolution with the change in the frequency in the EPT processing system has been concluded as shown in Fig. 11. With the change in the frequency from 127 to 193 Hz, PHAGB roar rapidly on account of discontinuous nucleus in the incomplete recrystallization process,Reference Doherty, Hughes, Humphreys, Jonas, Jensen, Kassner, King, McNelley, McQueen and Rollett21 while in the next part (226–293 Hz) it increased slowly due to continuous nucleus in the complete recrystallization. By the effect of complete recrystallization (293 Hz), LAGB left little. Therefore, in the process of grain growth under EPT (326 Hz and 360 Hz), PHAGB remained unchanged.
The evolutional PHAGB in the EPT system with the change of the EPT frequency.

For the 393 Hz-EPT at which PHAGB suddenly fell to 65% due to phase change playing a leading role in competing with the recrystallization. When the EPT frequency is increased to 493 Hz, PHAGB gradually added up because the nucleus of the phase change was preferential to appear in the defects to consume some LAGB so that PHAGB obtained a slow increment.Reference Oxtoby22
IV. DISCUSSION
A. Microstructure and mechanical property of the CR samples
Just as shown in Figs. 5(a) and 10(a), coarsened grains (50 μm), entangling dislocations, and deformed twins made the CR samples of bad plasticity with little movable slip systems. Strong  $\left\{ {0001} \right\}$ basal texture in Fig. 9(a) presented plastic deformation with much difficulty. Brittle fracture surface with river patterns and wide cleavage planes shown in Fig. 4(a) could also be another phenomenon of bad ductility. Low percentage of the HAGB presented that many dislocations piled up to make the concentrated stress distribute inside and at the grain boundaries. Thus, the ductility of the CR specimens is not ideal to be improved by EPT.
B. Microstructure and mechanical property of the samples after low-frequency EPT
At low-frequency period (127–293 Hz), recrystallization process obtaining the newly formed grains with the disappearance of deformed microstructure occurred. At this process, plasticity of the samples in the CR state enhanced noticeably while affecting the strength not much. Complete recrystallization at 293 Hz-EPT brought in the fine grains microstructure as shown in Fig. 5(f) and maximum ductility (32.5%). Increasing the frequency to 360 Hz, the grains get coarsening to decrease both the strength and ductility. In comparison, high-temperature THT in the long lasting time is prior to lead the phase change and thus maintaining deformed microstructure shown in Fig. 7(a). Through EBSD analysis, MA in Figs. 10(b)–10(d) presented the expenditure of the LAGB and LGAGB facilitated the nucleus and growth of the recrystallization. In further analysis in Fig. 11, the increasing rate of PHAGB is sharp to present the incomplete recrystallization with discontinuous nucleation from 127 to 193 Hz EPT. Growth rate for PHAGB is decreased in the next part (226–293 Hz) to stand for the complete recrystallization with continuous nucleation. In other words, increasing PHAGB lowers the dislocation density expressed as LAGB by breaking up the entangled dislocations and forming the new grains. Thus, the concentrated stress is relieved and fine grains are newly formed by the EPT to improve the ductility while affecting little tensile strength. Texture evolution [Figs. 9(b)–9(d)] also explained the reason of the enhanced ductility can be weakened basal texture adding more slipping systems.
In comparison of THT, EPT exerted momentum high-energy electropulses to make the rapid complete recrystallization. Previous studies have pointed out that the electron-wind forceReference Okazaki, Kagawa and Conrad23 and additional driving forceReference Guan, Tang, Chu and Jiang24 to push the dislocations rearrangement and grain boundaries migrating so that the nucleation rate and growth of the recrystallization can be accelerated greatly. In fact, the mechanism of the recrystallization is not fully clear currently. One possible mechanism is that acceleration of dislocation climb into the subgrain boundaries by coupling effect of thermal and athermal effects. Previous studiesReference Yanbin, Guoyi, Lei, Shaonan, Zhuohui, Chanhung and Yaohua25 showed that this climb process is greatly related to the atomic flux. Under low-frequency EPT for Ti–6Al–4V alloy, the atomic flux can be expressed as positive to the frequency.
Based on the above analysis, EPT under low frequency could speed up the recrystallization process due to increasing atomic flux by the coupling effect of thermal and athermal effect in the short processing time. Instead of continuous heating on the specimen EPT supplied multi-momentum energy pulses and athermal effect to push the climb of dislocations to fulfill the recrystallization under low temperature and short persisting time. However, lower than 127 Hz-EPT cannot obtain the phenomenon so that it is necessary to take the thermal effect for consideration. Certain temperature is needed because temperature is an important factor for the atomic flux in EPT process.
C. Microstructure and mechanical property of the samples after high-frequency EPT
Obvious phase change occurred at high-frequency EPT (360–493 Hz) and was observed by the help of the XRD and microstructure. At this period, there is an occurrence of duplex microstructure with the equiaxed grains and lamellar grains. As shown in Figs. 5(i)–5(l) with the increasing β phase induced the more phase boundaries to make the start of slipping system with more difficulty. So the ductility of the samples decreased at a certain extent with the strength improving. Accordingly, fracture surface evolved from ductile fracture to quasi-cleavage fracture in this stage as shown in Figs. 4(a)–4(d). At the same time, newly formed β phase retarded the compatible deformation of the samples to decrease the plasticity. Precipitated thin palette α phase formed in the cooling process increased the slipping distance of the transformed β phase decreasing the ductility. Strengthened basal texture of high-frequency treated material also explained the declined ductility as shown in Figs. 9(e) and 9(f). MA at high-frequency EPT shown in Figs. 10(e) and 10(f) demonstrated phase transition decrease the consumption of LAGB and LGAGB which represented the dislocations piling and twins, respectively. Meanwhile, phase change is preferential to occur on the defects to decrease the thermodynamic energy barrier, so that the nucleus and growth of the phase transition consumed some dislocations and twins to make the 20–60° grain boundaries intensive gradually. The phenomenon can also be depicted by the high-frequency part of Fig. 11.
High-frequency EPT brought in the Joule heating effect to accelerate phase transition instead of the recrystallization. While it is not caused by the single thermal effect which can be demonstrated by the phase change just occurred in the long-time THT. EPT decreases the thermodynamic barrier and accelerates the nucleus of phase change with the help of athermal effect.
By increasing the frequency of the EPT to 493 Hz EPT process could be formed due to the drop of the thermodynamic barrier during phase transformation.Reference Wang, Guo, Wang, Wu and Wang26
 $$\Delta G = \Delta G_0 + \Delta G_{\rm{e}} \quad ,$$
 $$\Delta G_{\rm{e}} = \mu g\varepsilon \left( {\sigma _1 ,\sigma _2 } \right)sj^2 \Delta V\quad ,$$
 $$\varepsilon \left( {\sigma _1 ,\sigma _2 } \right) = {{\left( {\sigma _2 - \sigma _1 } \right)} \mathord{\left/ {\vphantom {{\left( {\sigma _2 - \sigma _1 } \right)} {\left( {\sigma _1 + 2\sigma _2 } \right)}}} \right. \kern-\nulldelimiterspace} {\left( {\sigma _1 + 2\sigma _2 } \right)}}\quad ,$$
where ΔG is the free energy change for the beta-alpha phase change, ΔG 0 means the change of free energy in an EPT and current-conductive system, ΔG e is the energy change from the changed distribution of the current in the formation of a new phase nucleus, μ is the magnetic susceptibility in vacuum, g is the geometric factor for coarse-grained materials, j stands for the current density, ΔV means the volume of the newly formed nucleus, ε(σ1, σ2) is the criterion factor depends on the relationship between the nucleus and medium, σ1 and σ2 are the conductivity of two phases, respectively. During the α → β phase transformation, ε(σ1, σ2) < 0 results from (σβ = σ2) < (σα = σ1), thus leading to ΔG e < 0 according to Eq. (3). From the free energy change is minus to drive the α → β phase transformation by decreasing the thermodynamic barrier in an electropulse current carrying system. Free energy change was minus to drive the transformation occurred and guarantee the average number of stable nuclei increasing in the high frequency-EPT system.
On the other hand, this rapid process of phase change in the titanium alloy could be explained by the atomic flux. This implied that the Al and V atoms completed the exchange rapidly in the two phases of the material thanks to the coupling effect of EPT. The fast rearrangement of the atoms completed the phase transition.
D. Competitive mechanism of the recrystallization and phase transition in the process of EPT
In the process of increasing frequency EPT, the competitive relationship occurred between the recrystallization process and phase transition. With the increment of the frequency, atomic flux speed up for both situations as discussed in the previous part. While the thermodynamic driving force of phase transition is relatively positive to the temperature while it is not sensitive to temperature for recrystallization process. At low frequency, thermodynamic driving force for recrystallization is greater than phase change. Moreover, the athermal effect speeded up the atoms flux to decrease the thermodynamic energy barrier for forming the recrystallized grains. Therefore, at low frequency EPT, the recrystallization played a leading role in a rapid and low temperature process as shown in Figs. 5(a)–5(h). At high frequency, thermodynamic driving force for recrystallization is smaller than phase change due to high temperature induced by Joule heating effect, so that the phase transition which is sensitive to temperature change is predominant as shown in Figs. 5(i)–5(l).
E. Strain hardening characteristics of EPT samples in the uniaxial tensile tests
According to the engineering stress–strain curves (as depicted in Fig. 2) in the uniaxial tensile tests at room temperature, the strain hardening characteristics in the plastic deformation periods present the nearly same trend in strain hardening rate (SHR) despite the different microstructures under EPT. While there is a minor difference among the titanium alloy strips under various frequency EPT process. SHR for deformed materials is a constant value expressing the change rate of flow stress on the true strain (θ = dσ/dε), which implicates the interior microstructure characteristics based on the engineering stress–strain curves.Reference Renard, Idrissi, Schryvers and Jacques27,Reference Kim, Park, Chun, Kim, Bae, Kim and Lee28 In many research studies, effective strain, temperature, and strain rate are commonly considered as the sole plastic deformation process variables; there are many scientists focusing on the effects of strain path changes in the work hardening behavior compared with those previously obtained for monotonic tensile and torsion tests.Reference Correa, Aguilar, Silva and Cetlin29 The SHR of engineering stress–strain curves 1, 2, and 7 (dedicated as CR sample, 160 Hz-EPT1 sample, and 460 Hz-EPT10 sample, respectively) is relative higher than that of others. In addition, the SHR of curves 3–6, 8, and 9 is very close and the difference between curves of 10 and 11 is also small. Cold rolling deformation brings in large amounts of dislocations increasing the dislocations density and facilitating the entanglement and accumulation of dislocation colony. Moreover, many microcracks formed in the aggregation of voids and formation of deformed twins due to uncoordinated deformation prefer to cause the stress concentration in the tensile plastic deformation process at an ambient condition so that the average SHR of CR sample is as high as 5.714 GPa under obvious strain hardening effect. While 160 Hz-EPT1 dramatically breaks down the entangled dislocations increasing the mobility of dislocations participating in the formation of recrystallized grains more positively with the help of coupling of thermal and athermal effects of high-energy EPT and large stored energy in the prior deformation process so that the dislocations density is decreased and obstacle in the tensile stretch deformation is also relieved to lower the degree of local stress concentration and uncoordinated deformation, as shown in Figs. 5(b) and 5(c). Therefore, strain hardening effect is decreased to a lower standard with SHR changing down to 1.6 GPa. Further increasing the frequency of EPT or thermal effect can additionally relieve the stored energy and dislocation density accompanied by improving the ability of accommodated deformation so that dislocations are difficult to accumulate and form the entangled colony, which lowers the SHR to 0.36–0.66 GPa. Under 460 Hz-EPT10 effect, duplex microstructure is formed [shown in Fig. 5(k)] with secondary lamellar alpha phase in the transformed beta grains lowering the slip effective length, which increases the obstacle effect of dislocations motion as predicted. In addition, small-sized lamellar alpha phase prefer to originate the dislocations entangling increasing the dislocations density rapidly. Thus, stress concentration is easily accumulated around the primary beta phase in the tensile deformation at room temperature, which enhances SHR again to 1.6 GPa.
However, the SHR in the same curve varies in the different deformation periods, which is a complicated problem relative to many factors. The strain hardening phenomena appear in the materials deformation and processing. The change of the flow stress is caused by the change of the dislocation density. And the relationship among the flowing stress, strain, and dislocations is according to the following equationReference Demir, Raabe and Roters30:
 $${{{\rm{d}}\rho } \mathord{\left/ {\vphantom {{{\rm{d}}\rho } {{\rm{d}}\varepsilon }}} \right. \kern-\nulldelimiterspace} {{\rm{d}}\varepsilon }} = k_1 \sqrt \rho - k_2 \sqrt \rho \quad ,$$
 $$\sigma = Ma\mu b\sqrt \rho \quad ,$$
where σ is the flowing stress in the tensile deformation (MPa), ε means the true strain in the uniaxial test, ρ is the density of dislocations (m−3), M is the Taylor factor, μ is the shear modulus, other parameters are constants relative to the specific materials. According to the above equations, rate of strain hardening (RSH) defined by the flowing stress and engineering strain is relative to the dislocations density. McQueen and ImbertReference McQueen and Imbert31 demonstrated that dislocation mobility upsurge usually causes significant improvement in the plasticity of crystalline solids, partly through its ability to deter crack formation and dynamic recrystallization (DRX) that proceeds during deformation reduces the flow stress and markedly raises the ductility, characterizing the hot working range.Reference McQueen and Imbert31 Therefore, large strain hardening curve and criterion of DRX process have been put forward with the help of thermal simulation experiment on the basis of dislocation theory by many researchers.Reference Liu, Salahshoor, Melkote and Marusich32,Reference Mataya, Nilsson, Brown and Krauss33 Liu et al.Reference Liu, Salahshoor, Melkote and Marusich32 present a unified material model to compare well with experimental data for the deformation of SS304 alloy that explicitly accounts for dislocation and grain size evolution processes associated with inelastic deformation. The corresponding microstructure evolution laws are formulated and integrated into the constitutive model, which is derived from thermal activation theory and is an additive decomposition of athermal and thermal components representing the effects of long- and short-range obstacles, respectively. Xiao et al.Reference Xiao, Li, Xie and Wang34 conducted the high-temperature deformation behavior of powder metallurgy molybdenum based on a series of isothermal hot compression tests, which were carried out on a Gleeble-1500 thermal mechanical simulator (Australia) in a wide range of temperatures (900–1450 °C). Through the research on the experimental stress–strain curves, it reveals that DRX softening effect of powder metallurgy molybdenum occurs in the temperature range from 1200 °C to 1450 °C, in which the flow stress is significantly sensitive to temperature.
However, the factors of influencing RSH in the deformation are abundant as chemical components, deformation rate, deformation extent, microstructure, phase constitution, dislocations configuration, deformation twins, strain induced phase transformation, and deformation/processing paths, which are multifactors and complicated problems for research.Reference Zhang, Li, Lei, Qiu and Luo35 As for this series, tensile tests for the Ti–6Al–4V alloy strips the chemical components and deformation rate are the same in the experiments. In fact, deformation temperature, dislocations configuration, density, distribution and deformation modes are more sensitive for the samples in influencing the RSH, which have been conducted by many researchers focusing on the relationship study between the DRX and RSH in the hot deformation.Reference Wang, Li, Wang, Zhou and Chiba36,Reference Chen, Cui and Chen37 Lin et al.Reference Lin, Deng, Jiang, Wen and Liu38 conducted uniaxial tensile tests of a typical Ni-based superalloy in the deformation temperature range of 920–1010 °C and strain rate range of 0.01–0.001 s−1. Their results show that the increase of initial delta phase increases the density of nucleus for the formation of DRX, and promotes the nucleation and coalescence of microvoids in the tensile tests. While there are seldom reports about RSH in the ambient tensile tests, which is much more complicated and relative to many factors discussed before. Thus, this research in fact is out of our study range in this paper, which will be further studied in the future work.
Obviously, microstructure evolution is influential in the RSH of the materials in the uniaxial tensile tests at room temperature. But what is more difficult is the complicated microstructure evolution under various frequencies EPT including the recrystallization and phase transformation which is lack of relative research in the relationship between the phase change and work hardening due to complicated mechanism. In addition, various kinds of microstructure (deformation, recrystallization, phase transition, lamellar or the mixture microstructure) are different in the sensitivity to the RSH inducing the difficulty of drawing out the relationship between the microstructure and RSH. Moreover, RSH is also strongly connected to the treatment paths and the influence of the athermal effect of EPT on the RSH is seldom reported, which can just be conducted in the future research work.
The strain hardening characteristics of EPT samples in the uniaxial tensile tests is therefore meaningful but too difficult in the current research and is not our focus in this paper, which will be fully developed in the future exploration work including the effects of dislocations configuration, local deformation temperature (internal energy), microstructure evolution, and coupling of thermal and athermal effects of EPT on the RSH relying on the engineering stress–strain curves.
V. CONCLUSIONS
EPT provided a promising technology to improve the microstructure and plasticity of the CR Ti–6Al–4V noticeably while only affecting the strength mildly. Thus, titanium alloy of high plasticity and good comprehensive property can be obtained by this method. What is more, the processing is under a relative low temperature within a few seconds so that this method could be energy saving and beneficial for microstructure and surface quality. The research found that the tensile ductility could be improved largely with the increasing frequency and at 293 Hz the maximum ductility (32.5%) could be obtained. Under high-frequency EPT, plasticity has a slight decrease but the tensile strength increases at a certain extent. The meaningful and interesting phenomena are obtained through the uniaxial tensile testing but also explained by means of multi-characterization. It is abstracting that with the increasing frequency the process can be divided roughly into two periods: (a) recrystallization period, at this period athermal effect of the EPT played a leading role and (b) phase change period, at this period the other important factor of the EPT thermal effect was predominant. As a comparison, furnace heat treatment is conducted to prove the preferential phase transition under the single heating effect.
Fractographs demonstrated the fracture mode transformed from brittle fracture to ductile fracture for the part (a) and gradually to quasi-cleavage fracture for part (b) with the increasing frequency. Complete recrystallization occurred with fine grains at 260–293 Hz and phase transition at 360–493 Hz. The strength of basal texture weakened at low-frequency period and enhanced at high-frequency period which also explained the evolution of plasticity. MA distribution revealed complex interior grain boundaries evolution to explain the difference and reason for two-part EPT period. The mechanism of the results can be discussed by the atomic flux and competitive mechanism of recrystallization process and phase change in the EPT processing.
ACKNOWLEGMENTS
The work is supported by National Natural Science Foundation of China (No. 50571048) and Shenzhen science and technology research funding project of China (No. SGLH20121008144756946).