INTRODUCTION
Understanding the mechanisms driving the maintenance of species diversity in plant communities has remained central to ecology (Callaway Reference CALLAWAY2007). It is well known that plant–plant interactions and especially positive ones have strong direct and indirect effects on plant diversity at different spatial scales (Callaway Reference CALLAWAY1997, Crain & Bertness Reference CRAIN and BERTNESS2006, Soliveres et al. Reference SOLIVERES, ELDRIDGE, MAESTRE, BOWKER, TIGHE and ESCUDERO2011). Nurse plants improve habitat conditions for less-tolerant species and, as a consequence, it may locally increase species diversity (Hacker & Gaines Reference HACKER and GAINES1997) and expand species distribution over environmental gradients (Crain & Bertness Reference CRAIN and BERTNESS2006).
In drylands, vegetation usually occurs as conspicuous patches embedded in a matrix of bare ground (Aguiar & Sala Reference AGUIAR and SALA1999). These vegetation patches play an important role in community diversity and ecosystem function through seed trapping (Escudero et al. Reference ESCUDERO, GIMÉNEZ-BENAVIDES, IRIONDO and RUBIO2004), alleviating harsh conditions (Maestre & Cortina Reference MAESTRE and CORTINA2005) and as a refuge for herbivores (Aguiar & Sala Reference AGUIAR and SALA1999). Several studies have evaluated the differences in diversity between cushions and open areas by using well-known interaction indices based on pairwise comparisons between microsites (Armas et al. Reference ARMAS, PUGNAIRE and SALA2008). However, few studies have scaled up the importance of facilitation to the entire community (Cavieres & Badano Reference CAVIERES and BADANO2009, Tewksbury & Lloyd Reference TEWKSBURY and LLOYD2001, Xu et al. Reference XU, MICHALET, ZHANG, WANG, CHU and XIAO2010).
Although climate and grazing are acknowledged to be two of the most crucial limiting forces determining plant community assemblage there is little information about the joint effect of the two factors on the effects of nurse plants (Maalouf et al. Reference MAALOUF, BAGOUSSE-PINGUET, MARCHAND, BÂCHELIER, TOUZARD and MICHALET2012) and eventually on community properties. Our main goal was to evaluate the joint effect of climate stress and grazing pressure on the magnitude of the nurse effect on several community attributes (richness, diversity and plant cover) at two spatial scales (microsite and the entire community). We used altitude as a surrogate of predictable climate variation (Körner & Paulsen Reference KÖRNER and PAULSEN2004)
A huge effort has been devoted to describing facilitation processes in very different ecosystems. Nevertheless, there are no studies exploring this topic in tropical dry ecosystems. We conducted a field survey in the Ecuadorian dry montane scrub ecosystem, which is especially suitable because the community is dominated by a single nurse plant along a very long altitudinal gradient. In this dry ecosystem, the relationship between environmental stress and altitude is opposite of that in other latitudes: climate at low altitudes is more stressful, with low water availability and high temperatures, while climate becomes milder towards higher altitudes with an increase in precipitation (Espinosa et al. Reference ESPINOSA, LUZURIAGA, DE LA CRUZ, MONTERO and ESCUDERO2013).
The working hypotheses are: (1) nurse plants increase species performance and diversity both at the microsite and at the entire community scales under stressful conditions; (2) the nurse effect on community properties is jointly modulated by abiotic stress (altitude) together with biotic disturbance levels (grazed vs. ungrazed); (3) the proportion of species that expanded their distribution range due to the presence of nurse plants, will increase with climatic stress and grazing pressure, since nurse plants would improve local environmental conditions and create herbivore-free gaps; (4) nurse plants exert species-specific facilitation effects.
METHODS
Study area
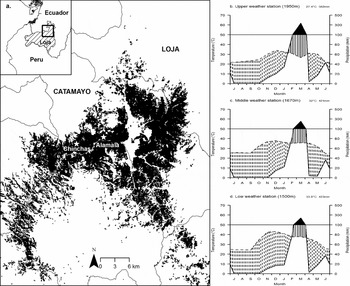
Our study was conducted in the Ecuadorian dry montane scrub ecosystem. This ecosystem occurs in some inter-Andean dry valleys between 1400 and 2500 m asl and it is characterized by a strong and long dry season (Figure 1). Vegetation cover appears as patches dominated by Croton wagneri Müll. Arg. embedded in a matrix of bare ground. Croton wagneri is an endemic but locally abundant shrub (Ulloa & Jørgensen Reference ULLOA and JØRGENSEN1995). It grows together with other rare xerophytic and spiny perennial species (Sierra Reference SIERRA1999).
Study area in southern Ecuador and climatic diagrams of three weather stations at different altitudes. The small figure represents the Loja province (striped). The large figure shows distribution area of the Ecuadorian dry montane scrub ecosystem (black) in the Catamayo and Loja districts, and the two surveyed locations: Chinchas and Alamala (white stars) (a). Climatic diagram in the upper weather station (b), middle weather station (c) and lower station (d) in Alamala. Black areas and solid lines represent humid months, dotted areas arid months. Altitude, mean annual temperature and total annual precipitation of each weather station are shown. Mean temperature and total precipitation per month are represented from July 2010 to June 2011.

The valley of Catamayo (Loja province, Ecuador), one of the best-preserved dry montane scrub ecosystems, constitutes an ideal natural model because the shrubby community dominated by C. wagneri extends throughout a long altitudinal gradient. We selected one of these stands, in the locality named Chinchas, which has experienced seasonal grazing by cattle over the last 20 y. Grazing occurs during the short rainy season (between January and April) with stock densities of 1–3 animals ha−1. We selected also another locality 4 km away (Alamala) that has remained undisturbed during the same period. Both localities were similar in relation to the geological substrata, inclination, orientation and rainfall distribution.
As there are no reliable climatic data available in the area, temperature and precipitation sensors (Extech RHT10) were placed directly on the soil at three altitudinal levels (1500, 1690 and 2100 m asl) in Alamala. Measures were recorded each minute between January 2010 and December 2011. We built a climatic diagram (Walter & Lieth Reference WALTER and LIETH1960) using the package climatol implemented in R environment (Guijarro Reference GUIJARRO2011). Around 80% of precipitation was recorded between February and March (Figure 1). Mean temperature at soil level and mean precipitation differences between upslope and downslope locations were 4.5 °C and 139 mm respectively (Figure 1). Water deficit (P < 2T) was prevalent 10 months a year. This pattern was consistent at the three altitudinal levels.
Sampling design
In both localities, the altitudinal range was evenly divided to establish sampling sites at four altitudes, grazed locations were located between 1450 m to 2100 m and ungrazed locations between 1550 m and 1950 m. At each altitude, two 30 × 30-m plots were established (16 plots) on a representative and homogeneous portion of the scrubland. Plots at each altitude were located no more than 500 m apart from each other (mean distance was 200 m). In each plot four 30-m-long transects parallel to the maximum slope and 8 m apart from each other were established. In each transect, 20 contiguous 1.5 × 1.5-m quadrats were placed and the cover of every perennial plant species was recorded. Total cover at plot level (canopy cover, hereafter) was estimated as the average perennial plant cover of the 80 quadrats surveyed per plot. Lengths and widths of patches and interpatches (open areas) intercepted by the transect were measured, and in this study we used the Minimum Interpatch Length (MINIL) index to characterize the patchy structure of the vegetation (Tongway & Hindley Reference TONGWAY and HINDLEY2004).
In each plot, 20 mature C. wagneri individuals were randomly selected and tagged (320 C. wagneri patches). We measured the maximum perpendicular axes of each patch containing the nurse plant, in order to estimate its patch size by fitting it to an ellipse (Cavieres & Badano Reference CAVIERES and BADANO2009). We recorded abundance and cover of every perennial plant species (perennial cover, hereafter), excluding cover of the nurse plant, in the whole area below the canopy of each C. wagneri plant using as many 0.5 × 0.5-m grid quadrats as necessary. Subsequently, the same numbers of grid quadrats were surveyed in the adjacent open areas (at least 1 m away from any plant of C. wagneri).
Effects of nurse plants on diversity
Diversity effects of nurse plants were calculated at two spatial scales: microsite and plot by using some biotic indices. Microsite scale comprises each C. wagneri patch with its corresponding open area, and the plot level refers to richness and average perennial cover values at the whole plot (30 × 30-m plots). Diversity was estimated by means of the inverse Simpson index (Jost Reference JOST2006).
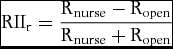
In order to detect plant–plant interactions and to quantify their effect on diversity at both community scales, we used four biotic indices, since plant interactions are not easily and univocally measured (Maestre et al. Reference MAESTRE, VALLADARES and REYNOLDS2005). These indices were computed using both plant richness and perennial cover as surrogates of community and plant performance, respectively. We used the Relative Interaction Index (RII) proposed by Armas et al. (Reference ARMAS, ORDIALES and PUGNAIRE2004) to establish the net balance of the interaction between C. wagneri patches and the rest of the species in each combination of altitude and grazing intensity. This index is based on the idea that the higher the richness or cover values in a certain microhabitat, the more benign microhabitat conditions are for the plant community (Armas et al. Reference ARMAS, ORDIALES and PUGNAIRE2004, Choler et al. Reference CHOLER, MICHALET and CALLAWAY2001). We calculated the RII in terms of richness and perennial cover at the microsite scale, as follows,
 \begin{equation*}
{\rm RII}_{\rm r} = \frac{{{\rm R}_{{\rm nurse}} - {\rm R}_{{\rm open}} }}{{{\rm R}_{{\rm nurse}} + {\rm R}_{{\rm open}} }}
\end{equation*}
where, Rnurse: richness below C. wagneri, Ropen: richness in open areas.
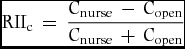
In terms of perennial cover per C. wagneri patch:
 \begin{equation*}
{\rm RII}_{\rm c} \, = \,\frac{{{\rm C}_{{\rm nurse}} \, - \,{\rm C}_{{\rm open}} }}{{{\rm C}_{{\rm nurse}} \, + \,{\rm C}_{{\rm open}} }}
\end{equation*}
where, Cnurse: total perennial cover below the canopy of C. wagneri patches, Copen: total perennial cover in open areas.
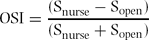
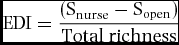
In order to estimate the proportion of the species that increased their distribution range due to the presence of nurse plants, we built the following Obligate Species Index (OSI) and Expanded Distribution Index (EDI) at the microsite scale based on the Relative Interaction Index (RII; Armas et al. Reference ARMAS, ORDIALES and PUGNAIRE2004). Both EDI and OSI indices provide information about the relative dominance of the species strictly related to each microsite: beneath patches or in bare areas
 \begin{equation*}
{\rm OSI} = \frac{{{\rm (S}_{{\rm nurse}} - {\rm S}_{{\rm open}} )}}{{{\rm (S}_{{\rm nurse}} + {\rm S}_{{\rm open}} )}}
\end{equation*}
 \begin{equation*}
{\rm EDI} = \frac{{{\rm (S}_{{\rm nurse}} - {\rm S}_{{\rm open}} )}}{{{\rm Total}\;{\rm richness}}}
\end{equation*}
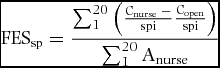
In order to assess the Facilitation Effect Size (FESsp) of C. wagneri patches on the performance of the eight most abundant perennial species in the community, we created an index that measures the differences in cover for each species between the two microhabitats (nurse and open areas) at the plot scale.
 \begin{equation*}
{\rm FES}_{{\rm sp}} = \frac{{\sum\nolimits_1^{20} {\left( {\frac{{{\rm C}_{\rm nurse}\; - }}{{{\rm spi}}}\frac{{{\rm C}_{\rm open}}}{{{\rm spi}}}} \right)} }}{{\sum\nolimits_{\rm 1}^{{\rm 20}} {{\rm A}_{{\rm nurse}} } }}
\end{equation*}
where, Cnurse/spi is the cover of species i beneath C. wagneri patches, Copen/spi is the cover of species i in open areas, and Anurse is the patch area. Values for the 20 patches in each plot were summed up to obtain the Facilitation Effect Size index for each species per plot. The eight species evaluated were: Baccharis salicifolia Ruiz & Pavon (Asteraceae), Croton wagneri Müll. Arg. (Euphorbiaceae), Gaya calyptrata (Cav.) Kunth ex K. Schum. (Malvaceae), Lantana canescens Kunth (Verbenaceae), Mimosa sp. (Fabaceae), Onoseris sp. (Asteraceae), Opuntia quitensis Engelm. (Cactaceae) and Stachytarpheta steyermarkii Moldenke (Verbenaceae).
Data analyses and model fitting
Non-linear mixed models (NLMM) were used to model community properties such as richness, diversity (inverse Simpson) and perennial cover (excluding canopy cover of C. wagneri patches), as well as the biotic indices built to estimate facilitation (five indices). The Relative Interaction Indices (RIIr, RIIc), the Obligate Species Index (OSI) and the Expanded Distribution Index (EDI) were modelled both at microsite and plot scales whereas the facilitation effect size (FES) for the most abundant species was modelled only at the plot scale. We used as fixed predictors the microsite (beneath patch vs open area), altitude (continuous variable), grazing (grazed vs. ungrazed) and the interaction altitude × grazing. We also included in the model the following covariables: the Minimum Interpatch Length (MINIL) as a surrogate of the patchy structure of the vegetation, total canopy cover per plot as a surrogate of primary productivity (Maestre & Escudero Reference MAESTRE and ESCUDERO2009), and patch size. Plot was included as a random factor in order to account for spatial autocorrelation and other potential biases due to some unobserved trends related to our field experimental design (Warren Reference WARREN2010). To account for non-monotonic responses along the altitude gradient, we built models with and without the quadratic term of altitude and, in the first case, with and without its interaction with grazing. The convenience of including these terms was evaluated using the AIC criterion.
Since our variables were asymptotically bounded between a minimum and a maximum value, we fitted models based in two-parameter logistic functions  $\frac{{{\rm e(a \,{+}\, bx)}}}{{{\rm (1 \,{+}\, e}^{{\rm (a \,{+}\, bx)}} )}}$, expanded and translated to fit the responses between the corresponding bounding limits (Legendre & Legendre Reference LEGENDRE and LEGENDRE1998). This approach releases the analysis from the need to transform the data in order to fit any of the probability distributions usually assumed by GLMs (O'Hara & Kotze Reference O'HARA and KOTZE2010). We performed the usual model diagnostics and when apparent violations were found, we refitted the standard errors of the coefficients by adjusting the estimated variance-covariance matrix by means of sandwich estimators (White Reference WHITE1996). Statistical analyses were performed with the packages stats, nlme (Pinheiro & Bates Reference PINHEIRO and BATES2000) and nls (Bates & Chambers Reference BATES, CHAMBERS, Chambers and Hastie1992) in the R environment.
RESULTS
Overall, 26 perennial species were recorded in this study. Mean (±SE) species richness per C. wagneri patch and open area was 3.4 ± 1.3 and 2.3 ± 1.1, respectively. Mean perennial cover (excluding C. wagneri) was 21.9% ± 18.8% and 4.5% ± 8.2% beneath patches and in open areas, respectively. The most abundant perennial species were Lantana canescens (36.5%), Gaya calyptrata (18.9%) and Stachytarpheta steyermarkii (16.2%).
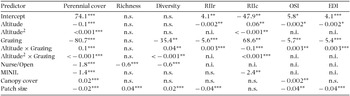
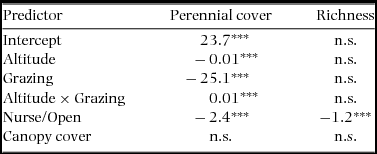
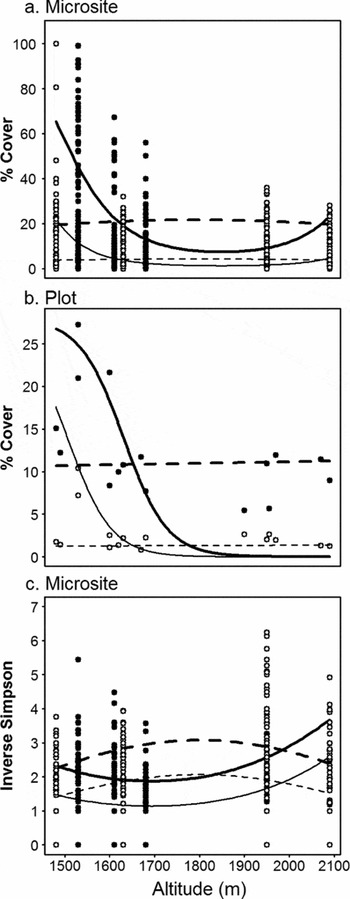
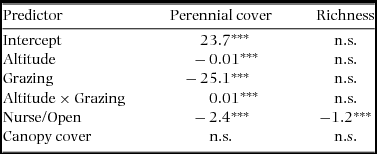
Fewer species and more reduced perennial cover occurred in open areas than in patches. Furthermore, four species (Lycianthes lycioides (L.) Hassl.(Solanaceae), Euphorbia tirucalli L. (Euphorbiaceae), Puya lanata (Kunth) Schult. f. (Bromeliaceae), and Peperomia peltigera C. DC. (Piperaceae) – 16% of the total perennials), occurred exclusively under C. wagneri patches, whereas no species grew exclusively in open areas. At high altitudes (more benign conditions) perennial cover under C. wagneri was reduced both at microsite and plot scales (Tables 1, 2). At the microsite scale, cover was better explained by the inclusion of a quadratic term for altitude in the definitive model. This means that environmental conditions at both ends of the altitudinal gradient exerted a relatively similar effect on perennial cover different from middle altitudes (Figure 2). However, altitude had no effect on species richness or diversity. Grazed locations showed less perennial cover and lower diversity but similar species richness.
Coefficients of non-linear mixed models (NLMM) for community attributes at microsite level; perennial cover (excluding cover of the nurse plant), richness, diversity (inverse Simpson) and four biotic indices measured at the microhabitat scale: RIIr: Relative Interaction Index in terms of richness, RIIc: Relative Interaction Index in terms of cover, OSI: Obligate Species Index, EDI: Expanded Distribution Index. MINIL: Minimum Interpatch Length, Nurse/Open: Nurse (0), Open (1). Total canopy cover per plot is used as a surrogate of primary productivity. Patch size: total area surveyed for each nurse/open sample pair. A quadratic term is showed as 2. n.s.: Not significant. *: P < 0.05; **: P < 0.01; ***: P < 0.001. n.i.: Variables not included in the model.

Coefficients of non-linear mixed models (NLMM) for richness and perennial species cover (excluding nurse cover) at plot scale. Nurse/Open: Nurse (0), Open (1). Canopy cover per plot is used as a surrogate of primary productivity. n.s.: Not significant. ***: P < 0.001.
Non-linear mixed models for plant cover at microsite (a) and plot (b) scales and for diversity at plot scale (c). Circles represent samples: black circles correspond to undisturbed locations and white circles to grazed locations of the Ecuadorian dry montane ecosystem. Solid lines represent the fitted model for undisturbed locations (thick line: beneath nurse, thin line: open zone) and dotted lines for grazed locations (thick line: beneath nurse, thin line: open zone).

A significant interaction between altitude and grazing on perennial cover happened both at the microsite and plot scales, and on diversity exclusively at microsite scale (Figure 2). In the ungrazed locality, perennial cover showed higher values at lower and upper altitudes and low cover values at middle altitudes, both beneath nurse plants and in open areas. In contrast, under grazing conditions, cover values for both microsites remained almost constant along the altitudinal gradient. A similar trend was observed at the entire community level. Microsite diversity showed opposing trends in grazed and ungrazed localities (Figure 2c); while in the ungrazed locality diversity increased towards the milder high altitudes, under grazing conditions maximum diversity occurred at middle altitudes (Figure 2c).
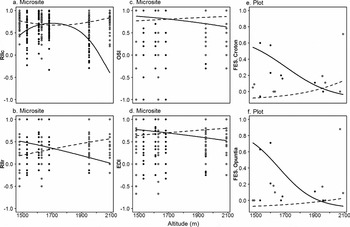
The Relative Interaction Indices (RIIc and RIIr for cover and richness respectively) showed a positive net effect of facilitation except in the ungrazed locality at the milder highest altitudes, where the nurse effect vanished or even became detrimental (Figure 3a,b). Facilitation intensity was largely determined by the interaction between grazing and altitude (Table 1). In the ungrazed locality, the nurse effect increased species richness at the most stressful low altitudes while no nurse effect was detected at the mild high altitudes. In contrast, under grazing conditions, the nurse effect on species richness was more important at the highest altitudes, while when climate stress and grazing co-occurred at low altitudes the positive effect of nurse plants almost vanished. This trend was also observed with the Obligate Species Index (OSI) and the Expanded Distribution Index (EDI) at the microsite scale (Table 1, Figure 3). These indices revealed that in ungrazed conditions, the proportion of obligate species associated with the microhabitat created by the nurse plant increased towards the most stressful low altitudes. In other words, nurse plants improved environmental conditions for a larger proportion of species at low altitudes. The opposite effect was observed under grazing conditions, where the proportion of species tightly associated with the nurse microhabitat increased towards higher altitudes. However, no significant effects of altitude or grazing on these indices were observed at the plot level (P >> 0.05; data not shown).
Non-linear mixed models for the biotic indices. The models were evaluated at microsite scale: RIIc: Relative Interaction Index for cover (a), RIIr: Relative Interaction Index for richness (b), OSI: Obligate Species Index (c), EDI: Expanded Distribution Index (d), and at plot scale: FES: Facilitation Effect Size index for Croton wagneri (e) and Opuntia quitensis (f). Circles represent samples: black circles correspond to undisturbed locations and white circles to grazed locations of the Ecuadorian dry montane ecosystem. Solid lines represent the fitted model for undisturbed location and dotted lines for grazed locations.

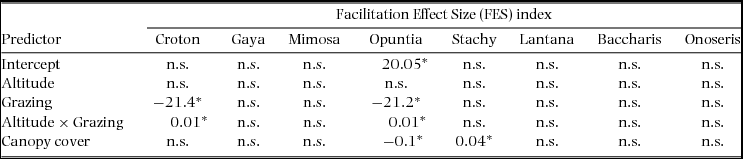
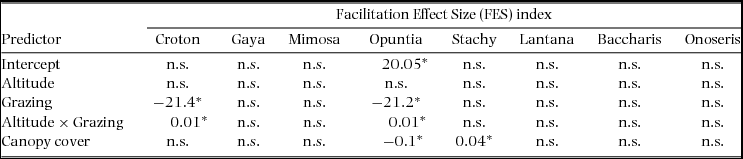
Performance of the most abundant perennial species at the plot level in terms of cover under C. wagneri, measured by the Facilitation Effect Size (FESsp) index, showed a significant effect of the nurse plant on only two species: Croton wagneri (saplings living beneath canopy) and Opuntia quitensis (Figure 3e,f). In ungrazed conditions, the facilitation effect of nurses strikingly increased towards the most stressful end of the altitudinal gradient (low altitudes), while, under grazing conditions, the effect of nurse plants for both species was close to zero along the altitudinal gradient (Table 3).
Coefficients of non-linear mixed models (NLMM) for the Facilitation Effect Size (FES) index for the eight most abundant species in the community. Croton: Croton wagneri, Gaya: Gaya calyptrata, mimosa: Mimosa sp., Opuntia: Opuntia quitensis, Stachy: Stachystarpheta steyermarkii, Lantana: Lantana canescens, Baccharis: Baccharis salicifolia, Onoseris: Onoseris sp. Canopy cover: is a surrogate of primary productivity per plot. *: P < 0.01.
DISCUSSION
Our hypothesis about nurse plant effects on community properties is confirmed, i.e. nurse plants increased species diversity not only at the microsite scale but also at the entire community level. We detected four perennial species that were strictly associated with C. wagneri patches and never occurred in open areas. The mechanisms involved in this relationship are not easy to establish. Lycianthes lycioides is a bird-dispersed species. Thus, most likely, C. wagneri may act as a perch structure for this species which is able to establish beneath its canopy. The other three species (Euphorbia tirucalli, Peperomia peltigera and Puya lanata) are not bird-dispersed and the mechanisms underlying this relationship could be related to micro-environmental amelioration, or to a seed trapping effect beneath C. wagneri canopies.
This reinforces the idea that nurse plants are crucial for determining diversity at the whole community level, especially in stressful environments (Cavieres & Badano Reference CAVIERES and BADANO2009, Michalet et al. Reference MICHALET, BROOKER, CAVIERES, KIKVIDZE, LORTIE, PUGNAIRE, VALIENTE-BANUET and CALLAWAY2006). Pioneering studies on the effect of abiotic stress gradients on species diversity suggested that mild environments allow high primary productivity conditions that enhances competition leading to a reduction in species richness (Grime Reference GRIME1973), whereas, under stressful environmental conditions physiological restrictions led to reduced species richness. Our results on the effect of altitude on community properties of the dry tropical shrubland greatly disagree with the above framework, specially at the most stressful low altitudes, and gives conclusive support to the Stress Gradient Hypothesis (SGH) (Callaway Reference CALLAWAY1997). We observed that perennial species cover (excluding adult C. wagneri), was higher at low altitudes, both at microsite and plot scales. We suggest that the mechanisms underlying this pattern are related to the nurse effect of C. wagneri plants which lessens the abiotic stress and thus enhances plant performance and plant cover within canopied areas.
In this tropical dry ecosystem, diversity showed a U-shaped relationship with altitude in ungrazed conditions. Higher diversity values were detected at both extremes of the climate gradient. Although this U-shaped relationship could seem counterintuitive, Mittelbach et al. (Reference MITTELBACH, STEINER, SCHEINER, GROSS, REYNOLDS, WAIDE, DODSON and GOUGH2001) in their review of studies dealing with productivity vs. richness variability, found a substantial number of such patterns. Scheiner & Jones (Reference SCHEINER and JONES2002) suggested that the U-shaped relationships may be due to community transition zones close to the limits of the gradient. This is likely to happen in our study, since close to the upper boundary of the C. wagneri scrub community, and related to the increase in water availability, species belonging to the tropical montane forest appear; whereas in the lowest stressful zones, the intensity of nurse effects may increase diversity.
However, when the effect of grazing was superimposed on the abiotic stress gradient, the above-mentioned cover and diversity patterns suffered a substantial change. Plant cover remained quite constant all along the altitudinal gradient in grazed locations, both at the microsite and entire community scales. A possible mechanism underlying this pattern could be related to the foraging behaviour of large herbivores. It has been stated that foragers move slowly across very productive communities and rapidly across less productive ones (Ruyle & Dwyer Reference RUYLE and DWYER1985), probably because foraging thresholds of large herbivores are reached more quickly in poor patches than in rich ones, causing lower residence time of herbivores per patch in unproductive systems (Senft et al. Reference SENFT, COUGHENOUR, BAILEY, RITTENHOUSE, SALA and SWIFT1987). Since our study system is a low-productivity semi-arid shrub community, it is likely that cattle and natural herbivores move relatively fast along the entire altitudinal gradient, and consequently they likely act as a homogenizing agent on plant productivity in our system. Obviously, this point deserves specific study.
Surprisingly, diversity in grazed locations showed a humped pattern along the altitudinal gradient with higher values of diversity at intermediate altitudes and lower values at both extremes of the altitudinal range. This pattern along productivity gradients has also been described by Grime (Reference GRIME1973). He proposed that under mild conditions competitive interactions usually prevail but when a disturbance agent like grazing joins in, competition intensity reduces and more species can co-occur, increasing total diversity. However, this explanation does not fit with the decay in diversity at the highest altitudes. It is possible that under more benign conditions the abundance of more palatable plant species increase and consequently herbivores may spend more time foraging (Senft et al. Reference SENFT, COUGHENOUR, BAILEY, RITTENHOUSE, SALA and SWIFT1987) locally removing some plant species. Our study demonstrates that the concurrent effect of climate and grazing exerted a crucial effect on plant community properties. The superimposed grazing pressure dramatically altered the importance of climate on community properties (Graff et al. Reference GRAFF, AGUIAR and CHANETON2007).
Nurse effect under climate and grazing variation
Previous studies in alpine (Cavieres et al. Reference CAVIERES, BADANO, SIERRA-ALMEIDA, GÓMEZ-GONZÁLEZ and MOLINA-MONTENEGRO2006), desert (Bowers Reference BOWERS2005) and Mediterranean (Escudero et al. Reference ESCUDERO, GIMÉNEZ-BENAVIDES, IRIONDO and RUBIO2004) habitats have provided solid evidence for positive plant–plant interactions, especially with cushion-forming species. The enhancement of the intensity of positive associations along an altitude gradient is one of the most consistent findings (Cavieres et al. Reference CAVIERES, BADANO, SIERRA-ALMEIDA, GÓMEZ-GONZÁLEZ and MOLINA-MONTENEGRO2006). However, predominance of positive versus negative interactions along altitude gradients differs among ecosystems. Thus, in Chilean Mediterranean climate type ecosystems and in tropical dry forests the magnitude of facilitation increases towards lower altitudes, most likely due to limited water availability caused by high temperatures and low precipitation, typical of these zones (Cavieres et al. Reference CAVIERES, BADANO, SIERRA-ALMEIDA, GÓMEZ-GONZÁLEZ and MOLINA-MONTENEGRO2006, Espinosa et al. Reference ESPINOSA, CABRERA, LUZURIAGA and ESCUDERO2011). Our results are in line with these findings, and, even more, since our study comprised a long altitudinal range (600 m), we could ascertain that the magnitude of plant–plant interactions, measured as the Relative Interaction Index in terms of cover (RIIc), followed a humped pattern along the altitude gradient. We observed a peak on the magnitude of the nurse effect at intermediate altitudes in ungrazed conditions, probably because at the most stressful lower altitudes plants are not able to sufficiently improve climate harshness and at the middle and upper altitudes competition interactions may prevail, reducing plant cover beneath plants of C. wagneri. In the grazed locality nurses had a positive and quite constant effect on plant cover all along the altitudinal gradient. This may reflect the effect of nurse plants as safe sites for species establishment in grazed locations independently of climate conditions.
In order to understand this shift in the intensity and direction of plant interactions, the Obligate Species (OSI) and the Extended Distribution Indices (EDI), allow us to discern some of the mechanisms that may be involved. Both indices point to an increase in the proportion of species tightly associated with nurse plants towards higher altitudes under grazing conditions. These results imply that under grazing pressure the importance of the nurse effect was extended to zones with relatively benign climates, changing the magnitude of nurse effects from competition to facilitation (Oesterheld & Oyarzábal Reference OESTERHELD and OYARZÁBAL2004). This suggests that the primary effect of nurse amelioration along stressful climate gradients is secondly modulated by grazers. As a consequence, under grazing conditions the expected response of facilitation along stress gradients can hardly be found. Our results may help to explain most discrepancies dealing with the generalization of the Stress Gradient hypothesis to other ecosystems (Maestre et al. Reference MAESTRE, CALLAWAY, VALLADARES and LORTIE2009).
Species-specific response to co-occurring biotic and abiotic environmental limitations
Climate and grazing influence on species-specific nurse effect was evaluated in terms of cover with the eight most abundant species by means of the Facilitation Effect Size (FESsp) index for each species. We found a significant effect of altitude or grazing for two species only: Croton wagneri juveniles and Opuntia quitensis. In both species the magnitude of the nurse effect was larger in ungrazed locations at low altitudes, where the abiotic environmental stress could be overcome by nurse plants, resulting in an increase of plant cover beneath plants of C. wagneri. At the milder high altitudes, the nurse effect nearly disappeared, being the plant cover beneath and outside nurse plants almost similar. These results suggest that cattle actively grazed on seedlings of both species homogenizing species cover beneath and outside patches.
Our study highlights the role of C. wagneri as a nurse plant in the rare Ecuadorian dry scrub, in terms of its effect on richness and total plant cover at the microsite and the entire community scale. The effect of nurse plants was transferred to the entire community by means of four perennial species strictly associated with patches of C. wagneri. This study remarks the importance of evaluating the joint effect of the two co-occurring stressors (climate and grazing) on plant community attributes, because the biotic stress created by herbivores greatly altered the magnitude and could even change the sign of species interactions. This study validates the SGH theory for this dry tropical system, since we detected that the importance of the nurse effect increased with abiotic stress. We conclude that the nurse effect is crucial in regulating community properties both at microsite and at the entire community scales.
ACKNOWLEDGEMENTS
This work has been partially supported by the following projects: A/030244/10 (Agencia Española de Cooperación Internacional para el Desarrollo – AECID), REMEDINAL2 P2009/AMB-1783 (Madrid Autonomus Government), MOUNTAINS CGL2012–38427 (Spanish Ministry of Science and Innovation), PIC 08 139 – (Ecuador Secretaria Nacional de Educación Superior Ciencia, Tecnología e Innovación – SENESCYT, www.senescyt.gob.ec), SENESCYT scholarship 2008–2. Thanks to MALCA S.A. for the access to the study area.