Introduction
Human beings acquire neurocysticercosis (NCC) by ingesting foods contaminated with Taenia solium eggs. The acidic gastric juice breaks up the inter-embryophore cement of the eggs. Then, the sheath-covered embryos are carried to the duodenum, where the pancreatic juice and bile dissolve the external lipid layer of the sheath, allowing the entrance of water and nutrients, which activate the previously dormant embryos. The activated embryos rip their envelopes with the help of their six sharp hooks, and they promptly leave these broken structures, as described in an in vitro study (Molinari et al., Reference Molinari1993). Released from their envelopes, activated embryos invade the intestine, as with Hymenolepis nana (Miyasato et al., Reference Miyasato1977), migrate through the bloodstream and implant in several tissues, such as the striated muscles and central nervous system, where they develop into the metacestode stage.
Neurocysticercosis is considered to be the most common parasitic infestation of the central nervous system and the single most common cause of epilepsy. Seizures, headaches and neurological deficits are described in human neurocysticercosis. Signs of psychiatric disease (65.8%), cognitive decline (87%), altered memory (25%) and attention deficits (100%) among others were reported in a heterogeneous sample of 38 patients (Forlenza et al., Reference Forlenza1997). Other features are hydrocephalous, chronic meningitis, and impairment in executive functions, verbal and non-verbal memory, praxis and verbal fluency (Varghese et al., Reference Varghese2016).
Hippocampal atrophy without seizures in patients with calcified neurocysticercosis (cNCC) has been observed, suggesting inflammatory-mediated mechanisms provoked by cysticercosis, which may contribute or even lead to refractory mesial temporal lobe epilepsy with hippocampal sclerosis (MTLE-HS) by mechanisms that need to be clarified (Bianchin et al., Reference Bianchin2015; Griper and Welburn, Reference Griper and Welburn2017). To address the role that T. solium metacestode factor (Fac) (Molinari et al., Reference Molinari1990) could play in the production of hippocampal sclerosis, whose cause in human neurocysticercosis is poorly understood, we developed an experimental Taenia crassiceps-mouse model to study and understand the effects of an infection of mice with T. crassiceps metacestodes and the subcutaneous inoculation of mice with a T. crassiceps factor on hippocampal cells; results showed an extensive and significant apoptosis of dentate gyrus, CA1, CA2, CA3 and hilus cells compared with intact control cells (Zepeda et al., Reference Zepeda2017).
In the current research, we extended the time of infection and the inoculation with Fac for 110 days to try to induce a more severe hippocampal injury than that reported recently (Zepeda et al., Reference Zepeda2017). Histopathologically, temporal lobe epilepsy (TLE) associated with HS has been characterized by cell death and neuronal cell loss, which is most severe in the CA1 and CA3 regions and in the hilus of the dentate gyrus (DG), volume loss, reactive gliosis, and dispersion of the dentate gyrus granule cells (Sloviter, Reference Sloviter1994; Lurton et al., Reference Lurton1998).
Materials and methods
Treatment of mice
BALB/c mice (28 days old, 20–22 g) were maintained under standard animal housing conditions with access to Purina chow and water ad libitum. Taenia crassiceps metacestodes (WFU strain) were maintained in our laboratory via peritoneal passage in female mice, as described (Everhard et al., Reference Everhard, Kuhn and Zelmer2004). Peritoneal fluid from healthy female controls (CPF) and T. crassiceps metacestode-infected mice, as well as T. crassiceps metacestode factor (Fac), were obtained according to Zepeda et al. (Reference Zepeda2011). To determine the effects of infection with T. crassiceps metacestodes and Fac treatment on hippocampal cells and the surrounding tissue, 18 female mice were divided into three groups. The control (Con) group (n = 6) and Factor (Fac) group (n = 6) were inoculated subcutaneously with 0.1 ml CPF, or Fac containing 50 μg of carbohydrates, as determined by the anthrone method (Ashwell, Reference Ashwell, Colowick and Kaplan1957) every 4 days for 100 days. The infected (Inf) group (n = 6) was infected intraperitoneally with up to 40 T. crassiceps metacestodes, measuring 2–3 mm in diameter and suspended in 0.2 ml phosphate buffered saline (PBS).
Barnes maze
At 110 days post infection with intraperitoneal T. crassiceps metacestodes or subcutaneous inoculation with T. crassiceps Fac, the Barnes maze procedure for small rodents was followed to estimate cognitive impairment in learning and memory (Rosenfeld and Ferguson, Reference Rosenfeld and Ferguson2014), with minor modifications. Briefly, a bright illumination overhead was used. The maze was centred below the lights. Mice were tested without the use of a wall or cues. The maze was 90 cm in diameter and 90 cm in height, with 20 escape holes that each had a diameter of 5 cm, and there was only one hole with an escape cage. No hole was plugged in this test. After 30 minutes of habituation, each mouse was gently removed from his home cage and placed onto the maze centre. Then, the overhead lights were turned on. Every mouse's performance was recorded using a Canon VIXIA HF R70 camera (Canon, Melville, NY, USA). If the mouse failed to enter the escape cage within 5 minutes, it was guided gently to the correct location and into the escape cage, where it remained for 2 minutes. Each mouse was tested for two trials/day with an inter-trial interval of approximately 30 minutes. All mice were tested for five consecutive days. Videos were analysed carefully. The Barnes maze test was used to study the behaviour of the control, experimental cysticercotic and Fac treated-mice.
Histology and cellular apoptosis
At 115 days post treatment and infection, all mice were anaesthetized with pentobarbital and perfused transcardially with saline followed by phosphate-buffered 10% formalin. Then, the brains were carefully removed, and intraperitoneal metacestodes were obtained and counted. Two coronal cuts were made in each brain: an anterior cut was made at Bregma −1.43 mm and the other at Bregma −5.19 mm (Paxinos and Franklin, Reference Paxinos and Franklin2013). The intermediate fragments of each brain were fixed with 2.5% paraformaldehyde in PBS for 12 h at room temperature. Next, the fragments of each brain were embedded in paraffin. Coronal sections that were 5 μm thick were prepared on a rotary microtome, placed on poly-L-lysine-coated microscopic slide, and subjected to haematoxylin/eosin (H/E) and DAPI staining to analyse the cellular morphology and histoarchitecture of the dentate gyrus and CA1-CA3 regions. Sections stained with H/E were analysed with an Olympus IX71 microscope and IMAGE PRO-PCUS 60 software. Sections stained with DAPI were analysed with a Zeiss LSM 800 confocal microscope and ZEN version 2.1 software. The presence of DNA strand breaks was evaluated using an in situ cell death detection kit (Roche). TUNEL assays were analysed with a confocal microscope Leica TCS-SPS (Carl Zeiss de México-División Microscopía, Ciudad de México).
Data analysis
The numbers of haematoxylin/eosin-stained and TUNEL-positive cells were measured by manual counting (area in μm2) with the aid of Image J software (National Institutes of Health, Bethesda, MD, USA). For statistical data, one-way analyses of variance and Tukey's test were performed using GraphPad software (GraphPad Instat, San Diego, CA, USA). Data are presented as the mean ± SD. P < 0.05 was considered significant.
Results
Barnes maze
Both intraperitoneal infection with Taenia crassiceps metacestodes and subcutaneous inoculation with a T. crassiceps metacestode factor (Fac) produced significant impairment on performance in the Barnes maze and induced bilateral hippocampal sclerosis in mice. The performance in the Barnes maze was mainly assessed by the escape latency parameter (mean ± SD), measured in the number of seconds it took to reach and completely hide in the escape hole.
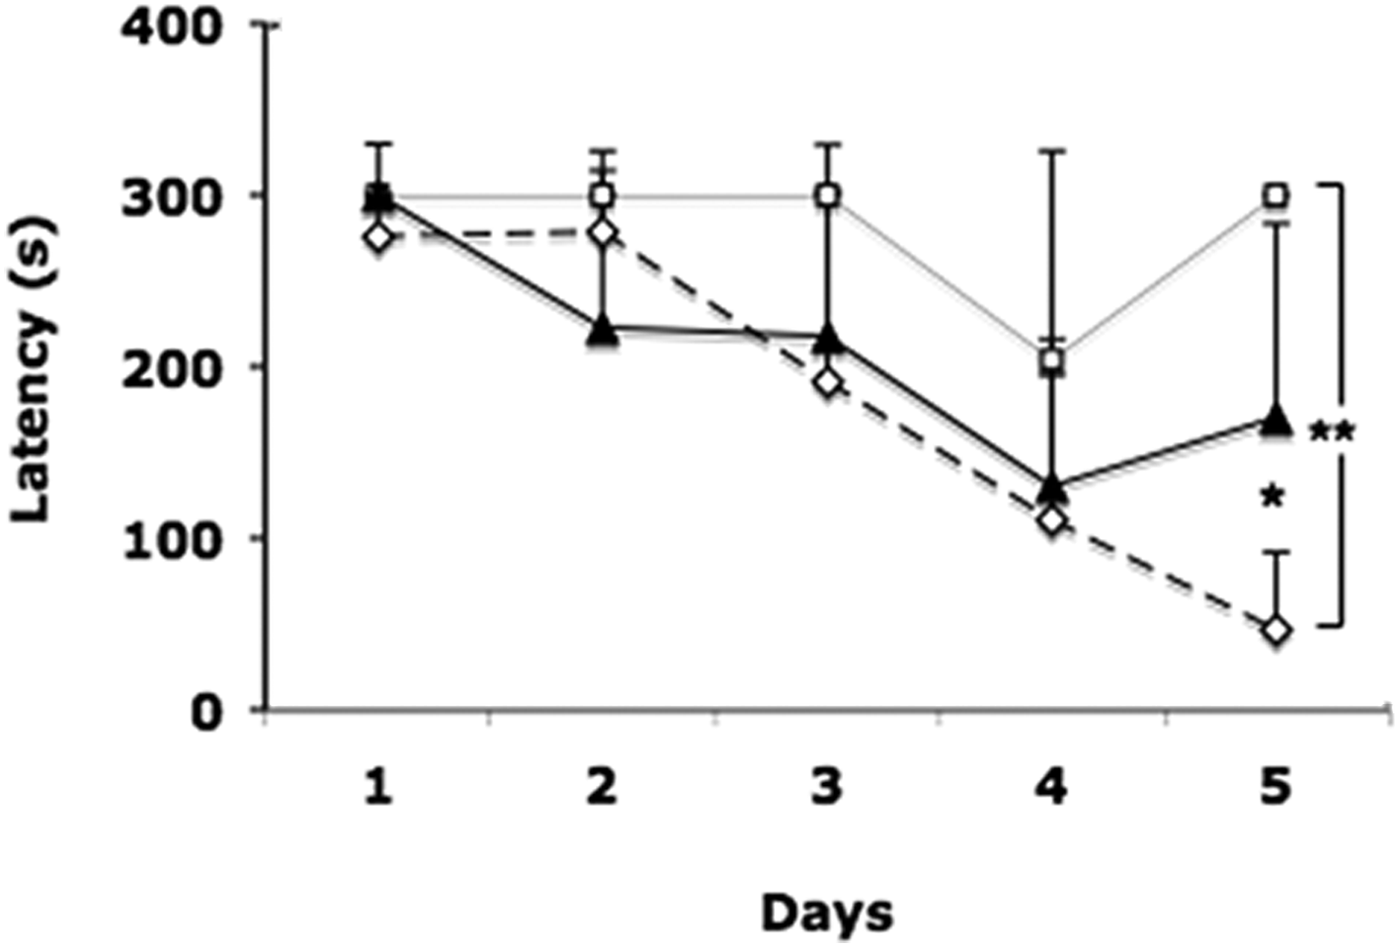
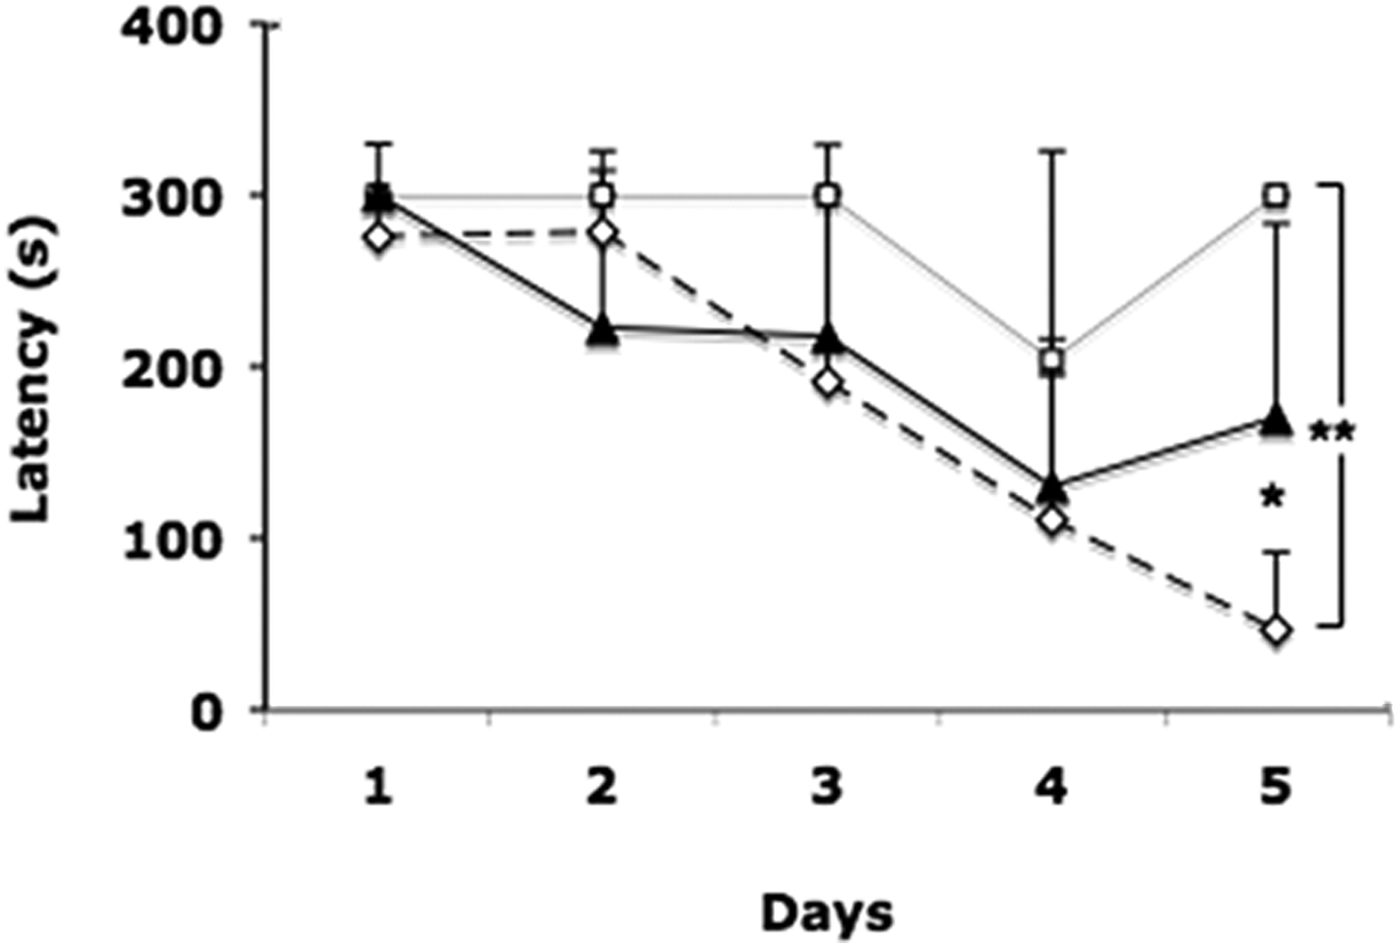
During all time (second trial) to learn this task, both infected and factor mice were significantly slower in reaching and hiding in the escape hole, in comparison with control mice. On the fifth day, all control mice (n = 6) were able to hide in the escape hole in 28 ± 44 s after reaching it. Latency values of control mice were significantly less than those of experimental mice (P < 0.05 Con vs Fac, and P < 0.01 Con vs Inf.; fig. 1). Infected mice (n = 4) showed difficulty in moving in the maze; on the fourth day only one (25%) was able to hide at 151 s after reaching the escape hole. On the fifth day only one reached the escape hole in 73 s, and stayed there the rest of time without hiding in the hole. On the fifth day Factor mice (n = 6) showed hyperactivity, reaching the escape hole at 67 ± 38 s. Only five mice had hidden at 73 ± 85 s after reaching the escape hole. The sixth mouse did reach the escape hole at 99 s, then left the hole four times to explore several holes and came back, but it never hid (fig. 1).
Mean escape latency in seconds as a measure of performance of mice in the Barnes maze. Values of the second trials for 5 days. Control group (⋄); Infected group (□); Factor group (▲). ** P < 0.01 Control vs Infected. * P < 0.05 Control vs Factor.
Histopathological studies
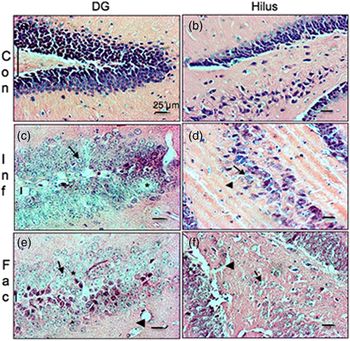
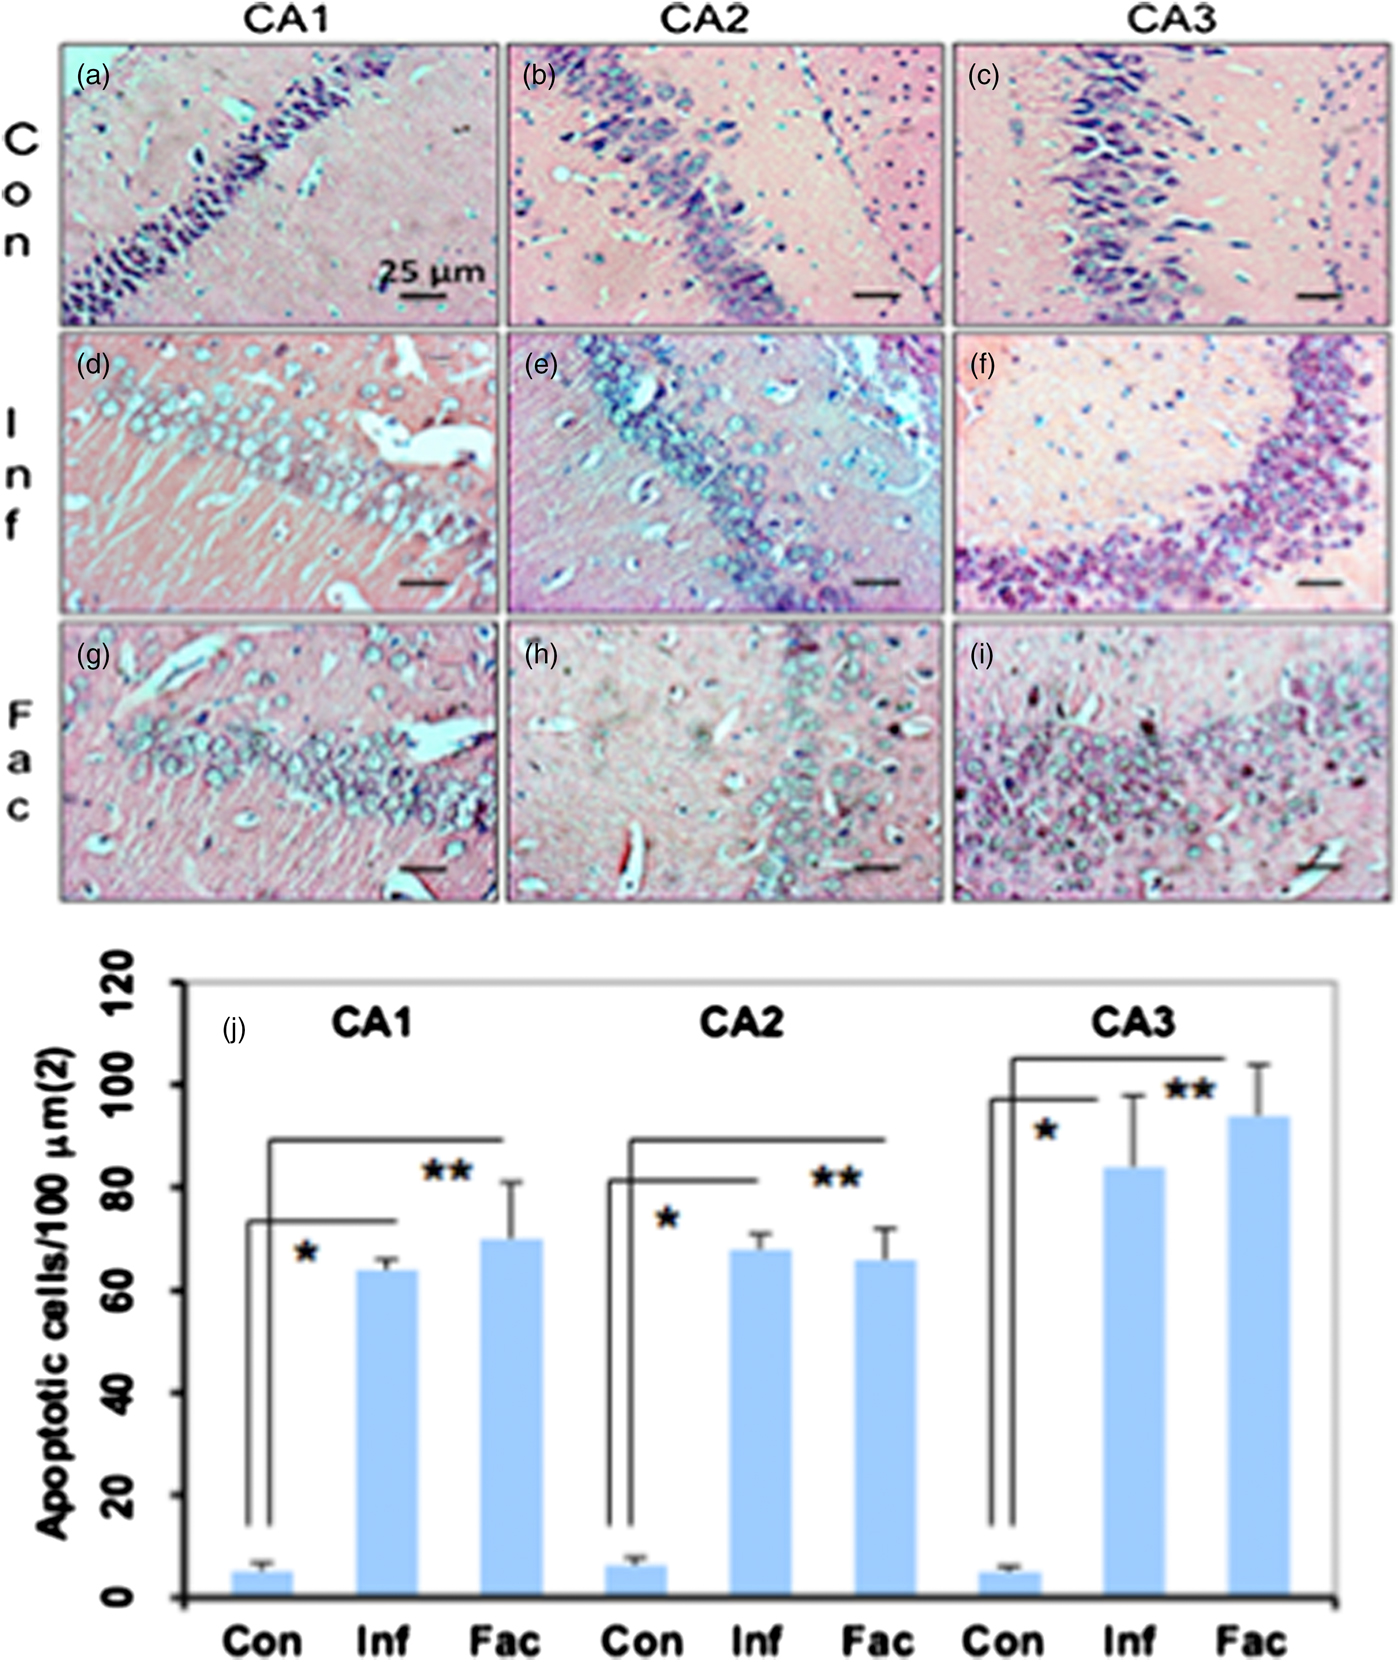
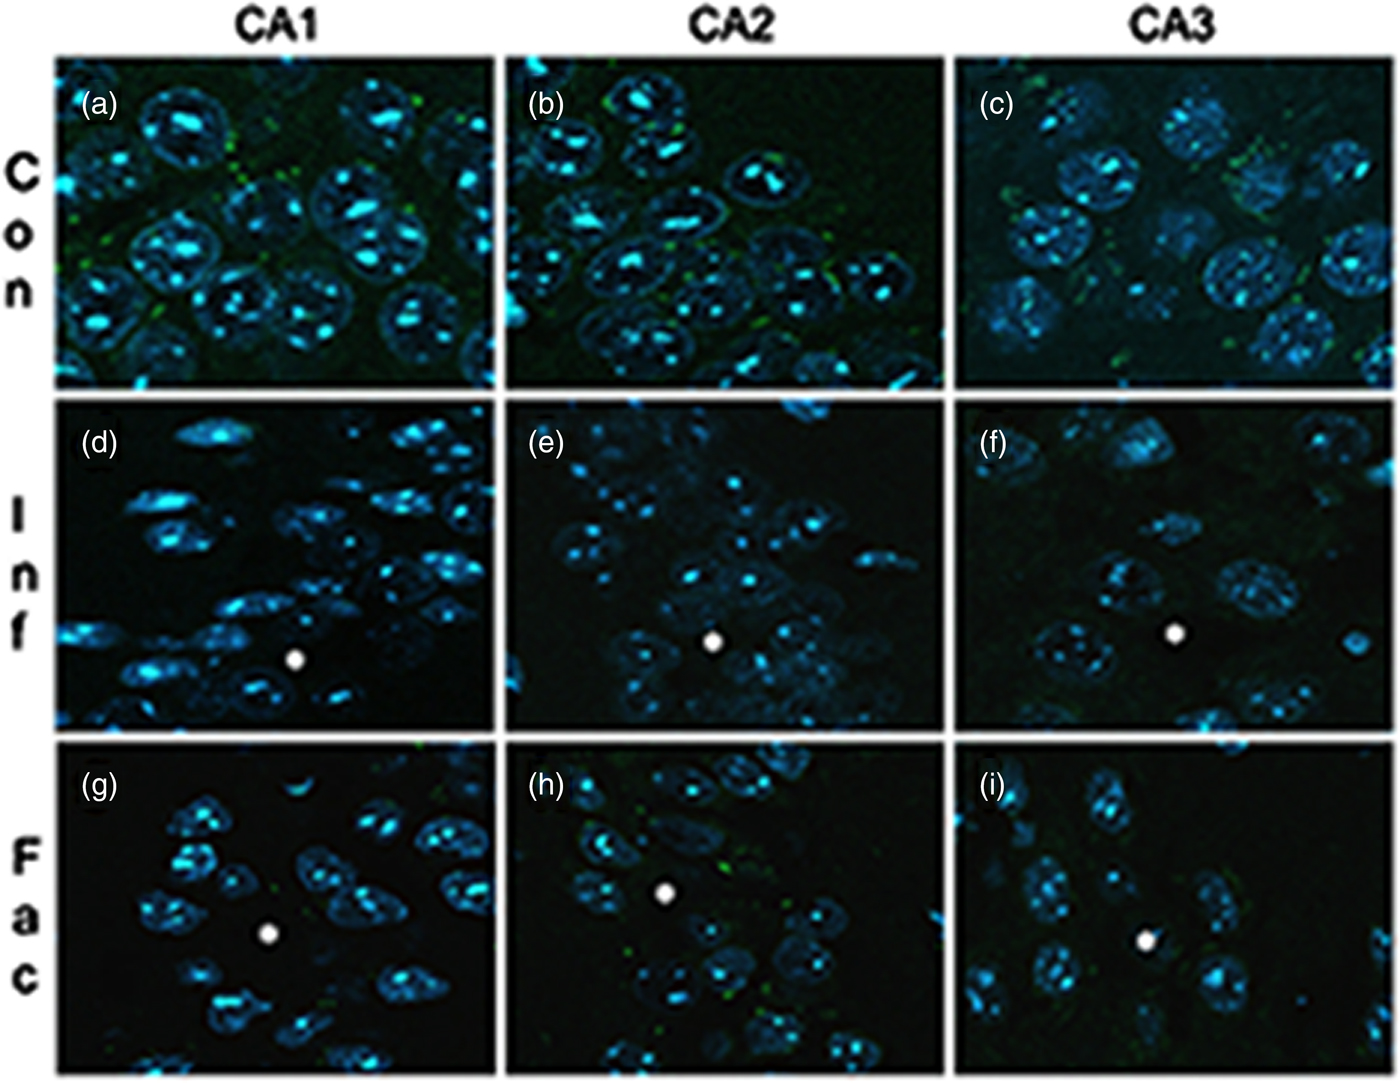
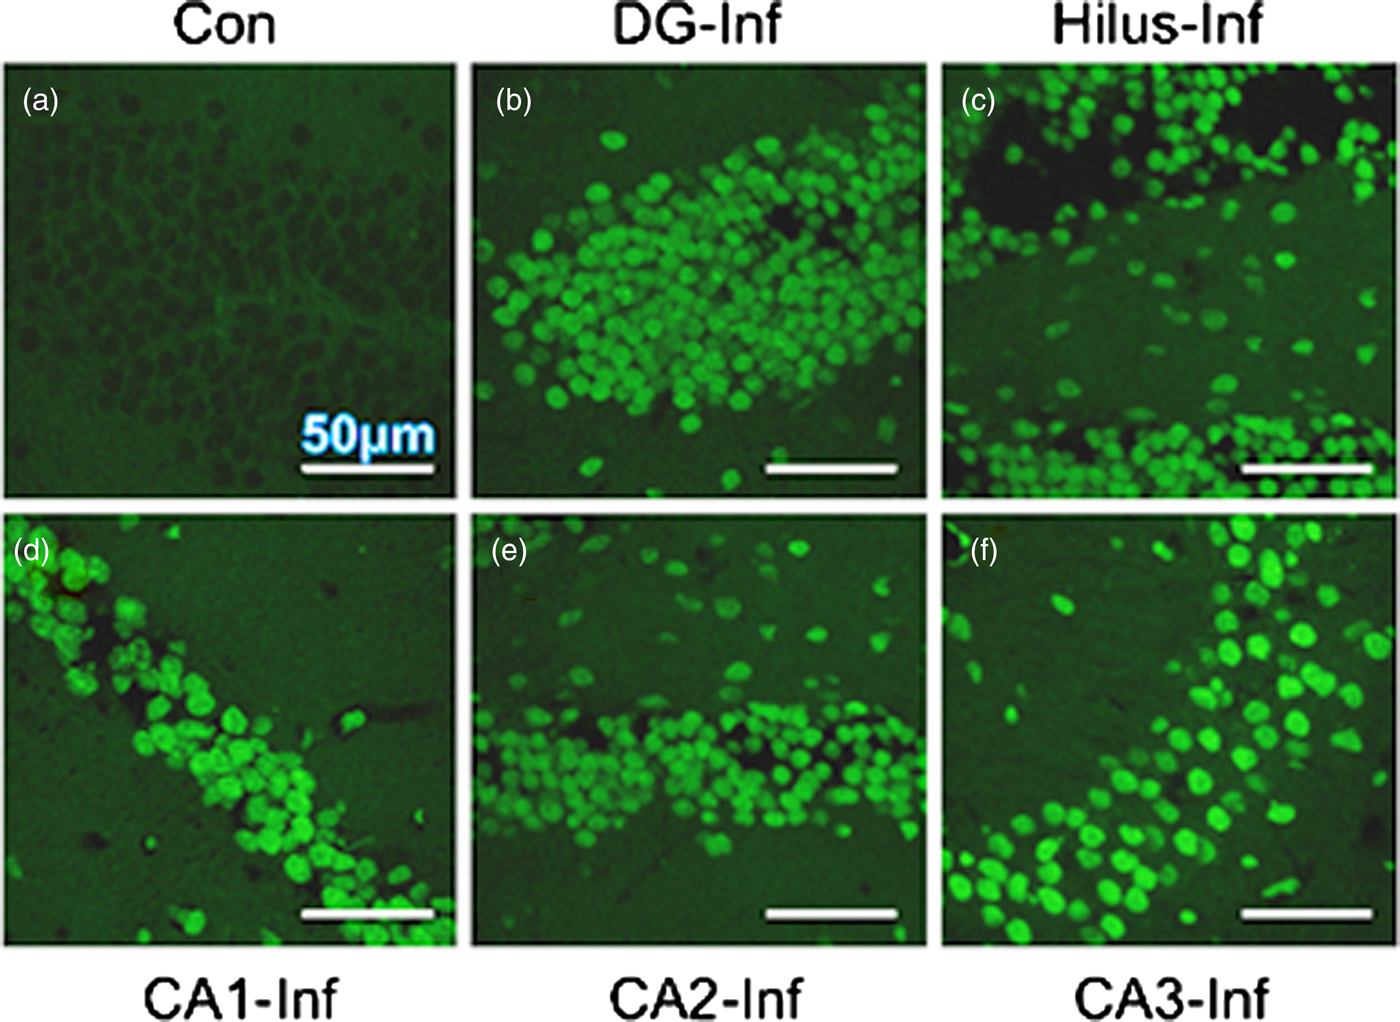
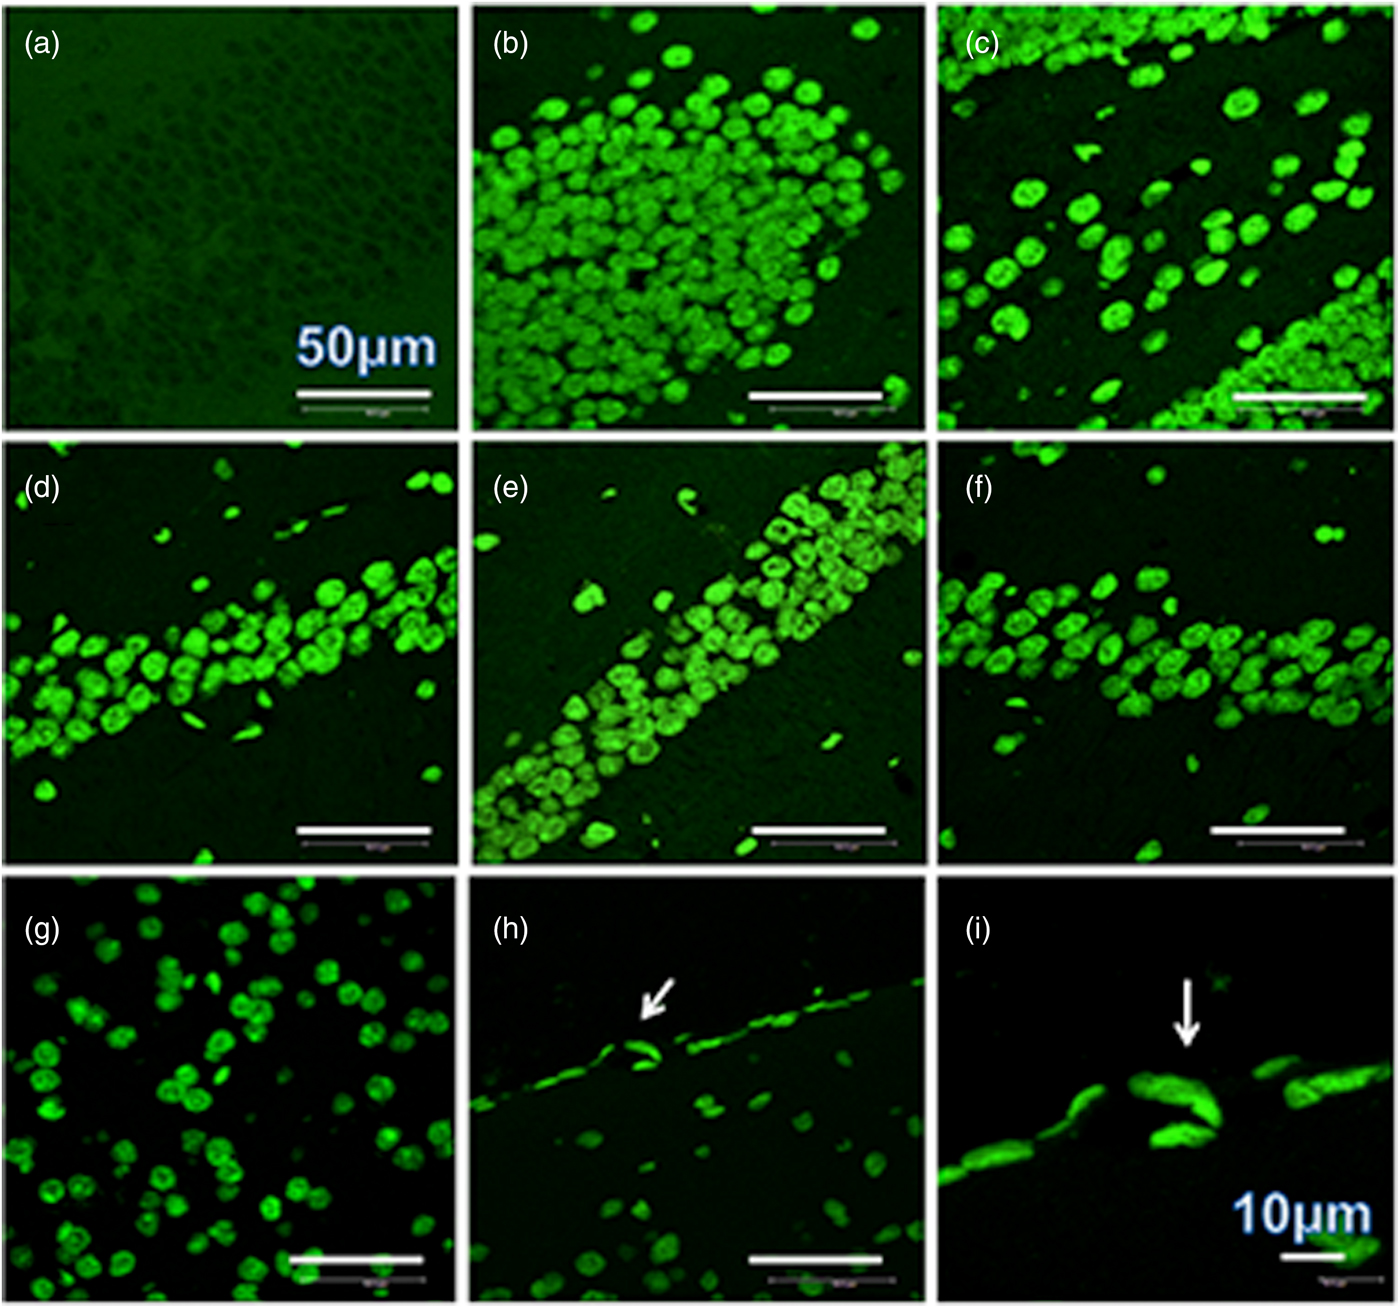
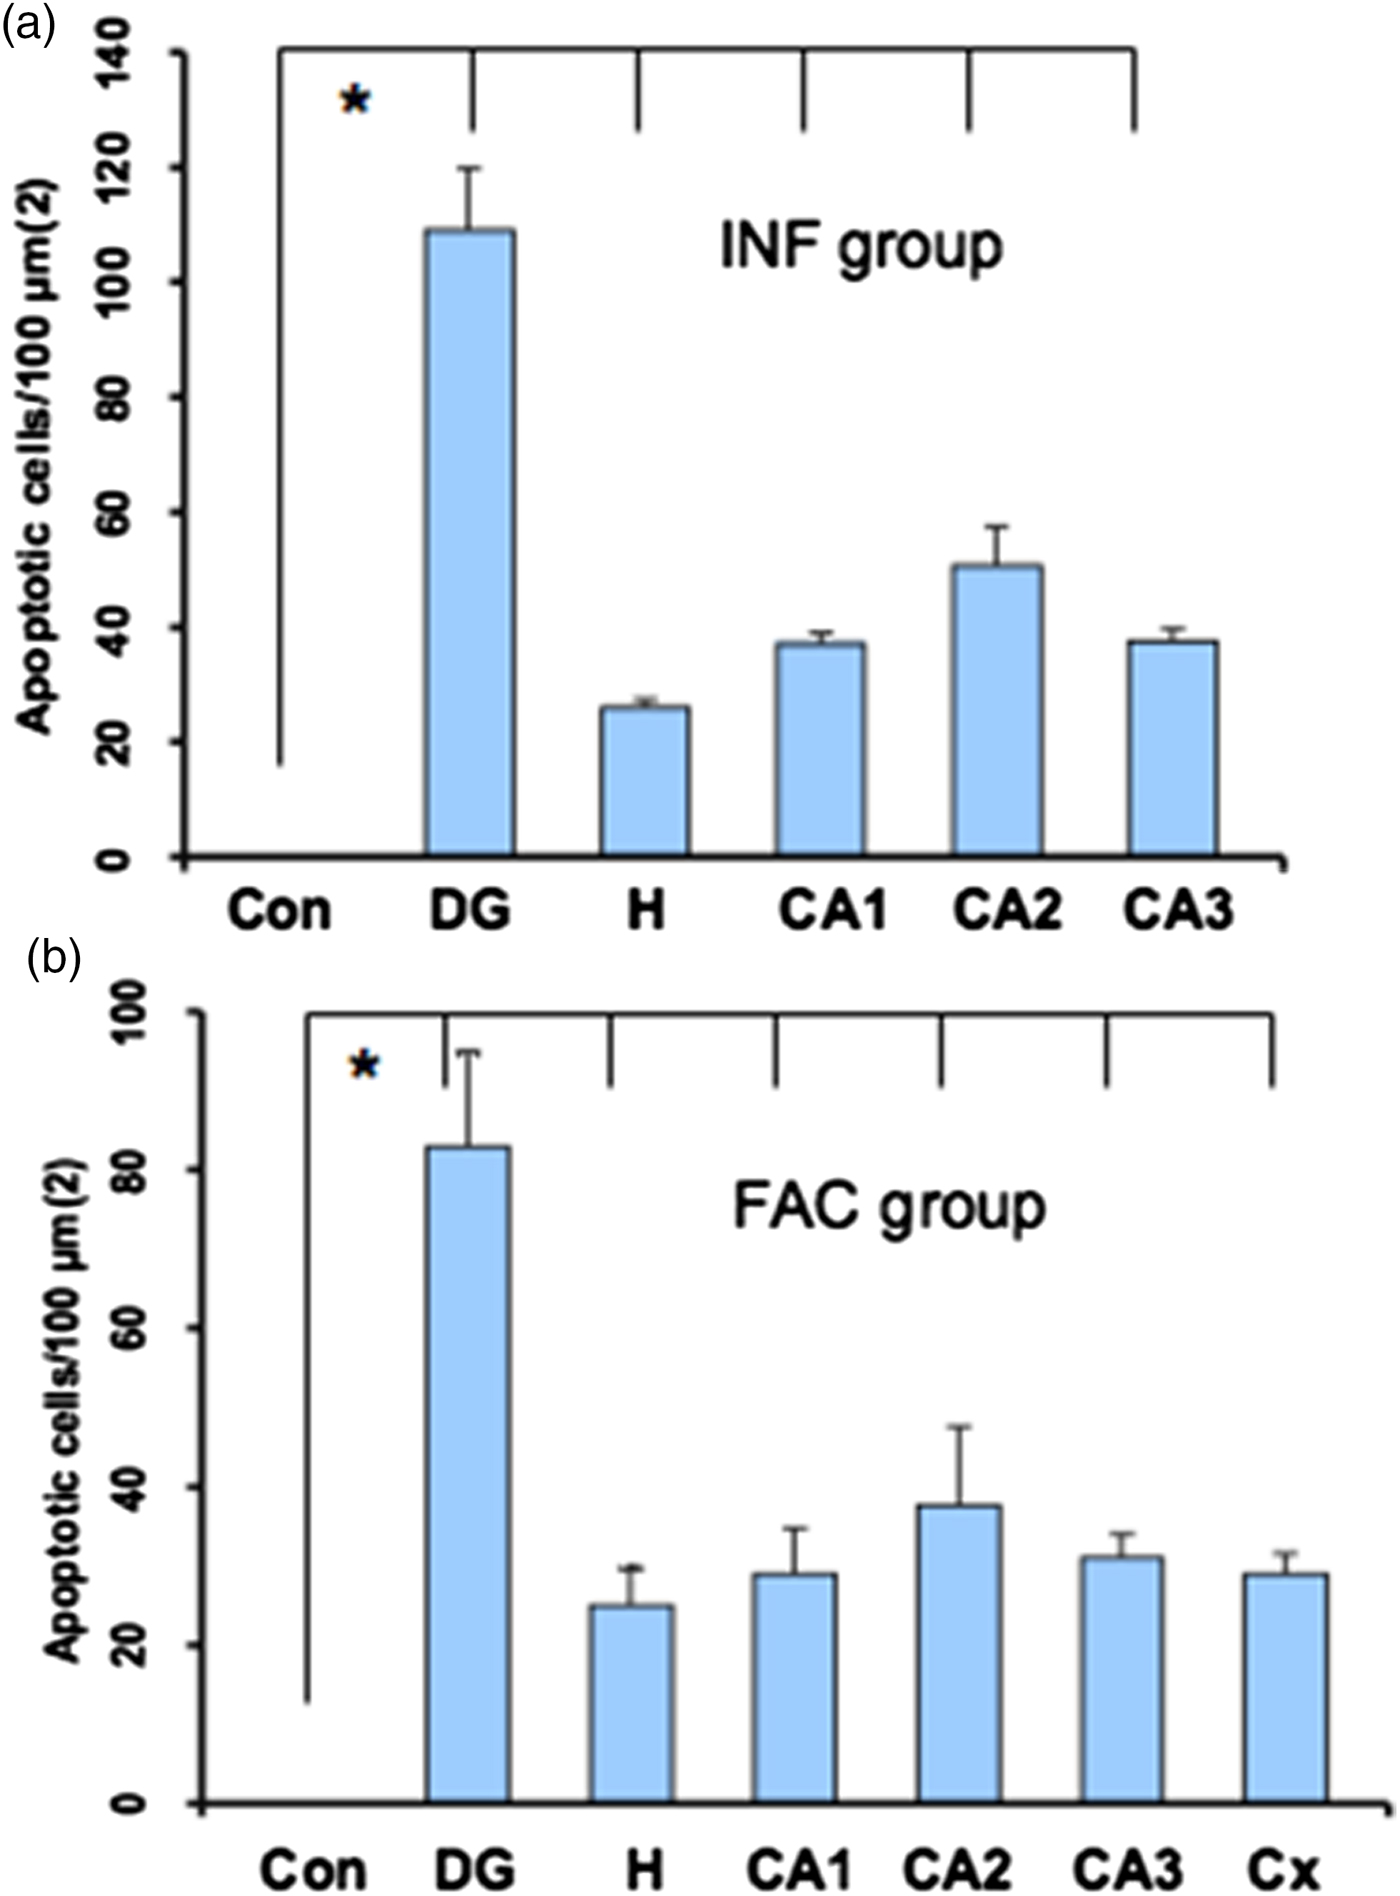
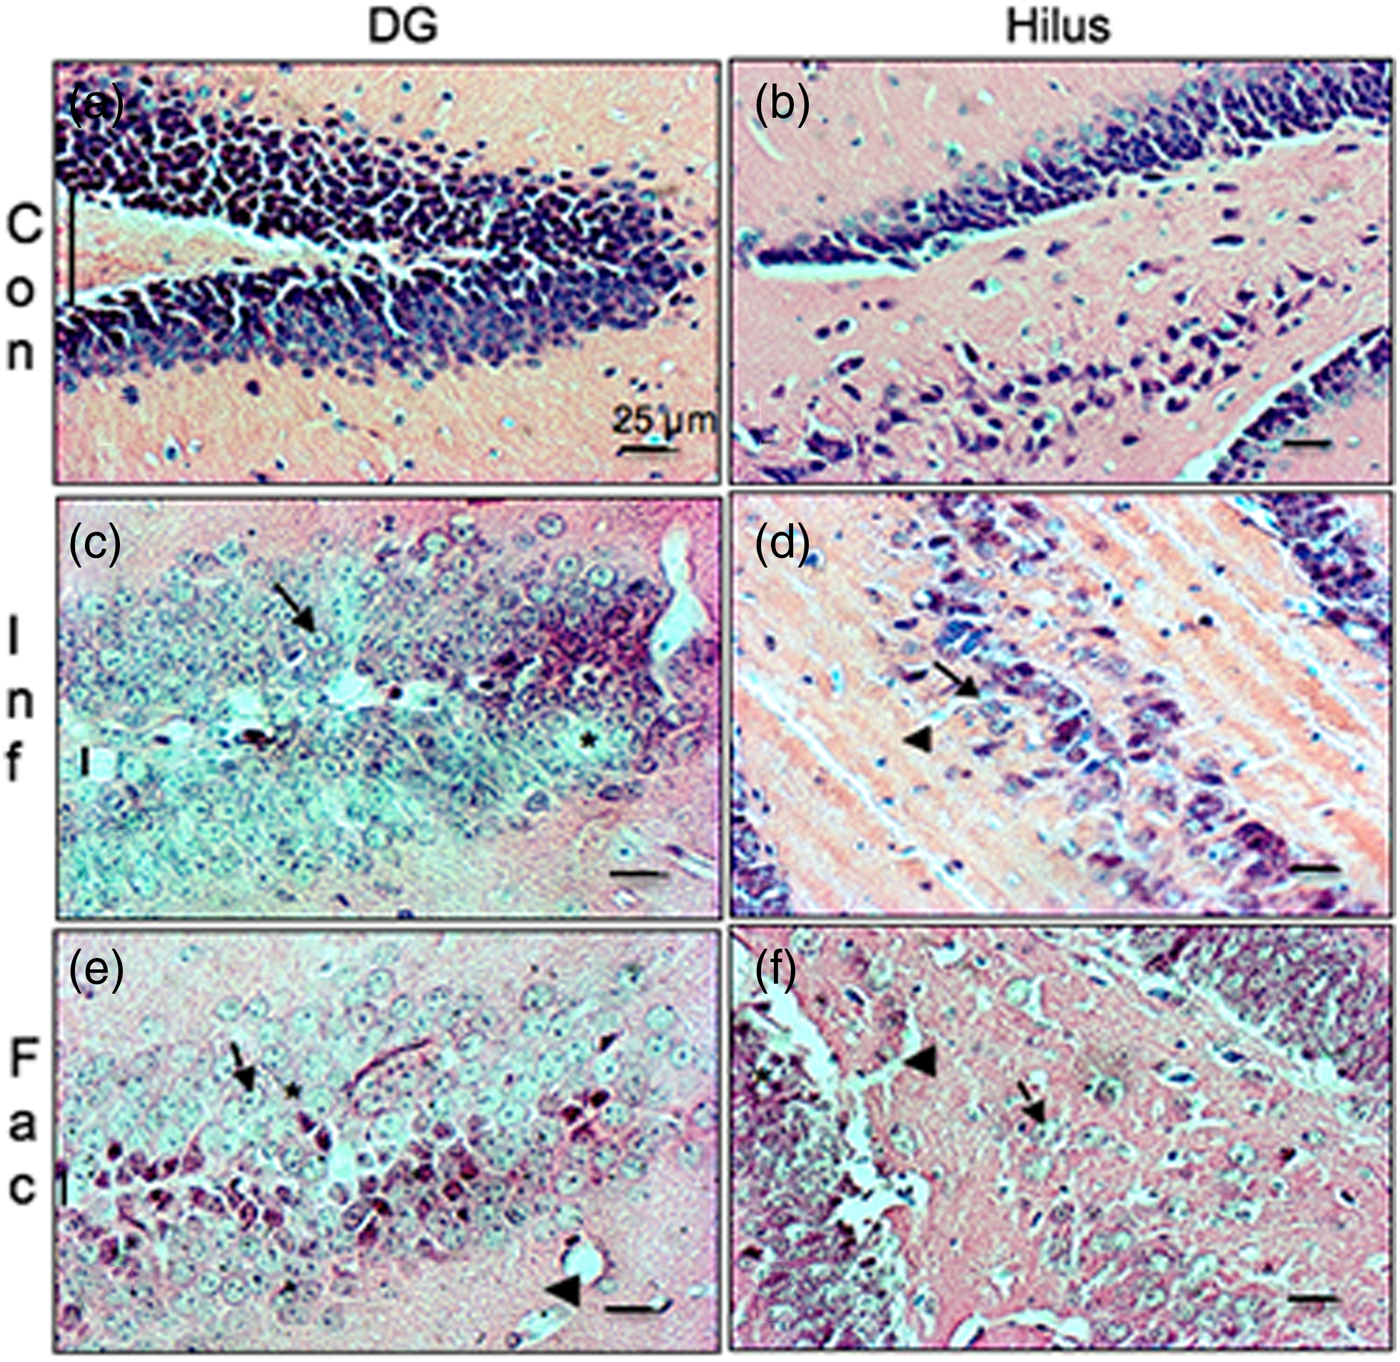
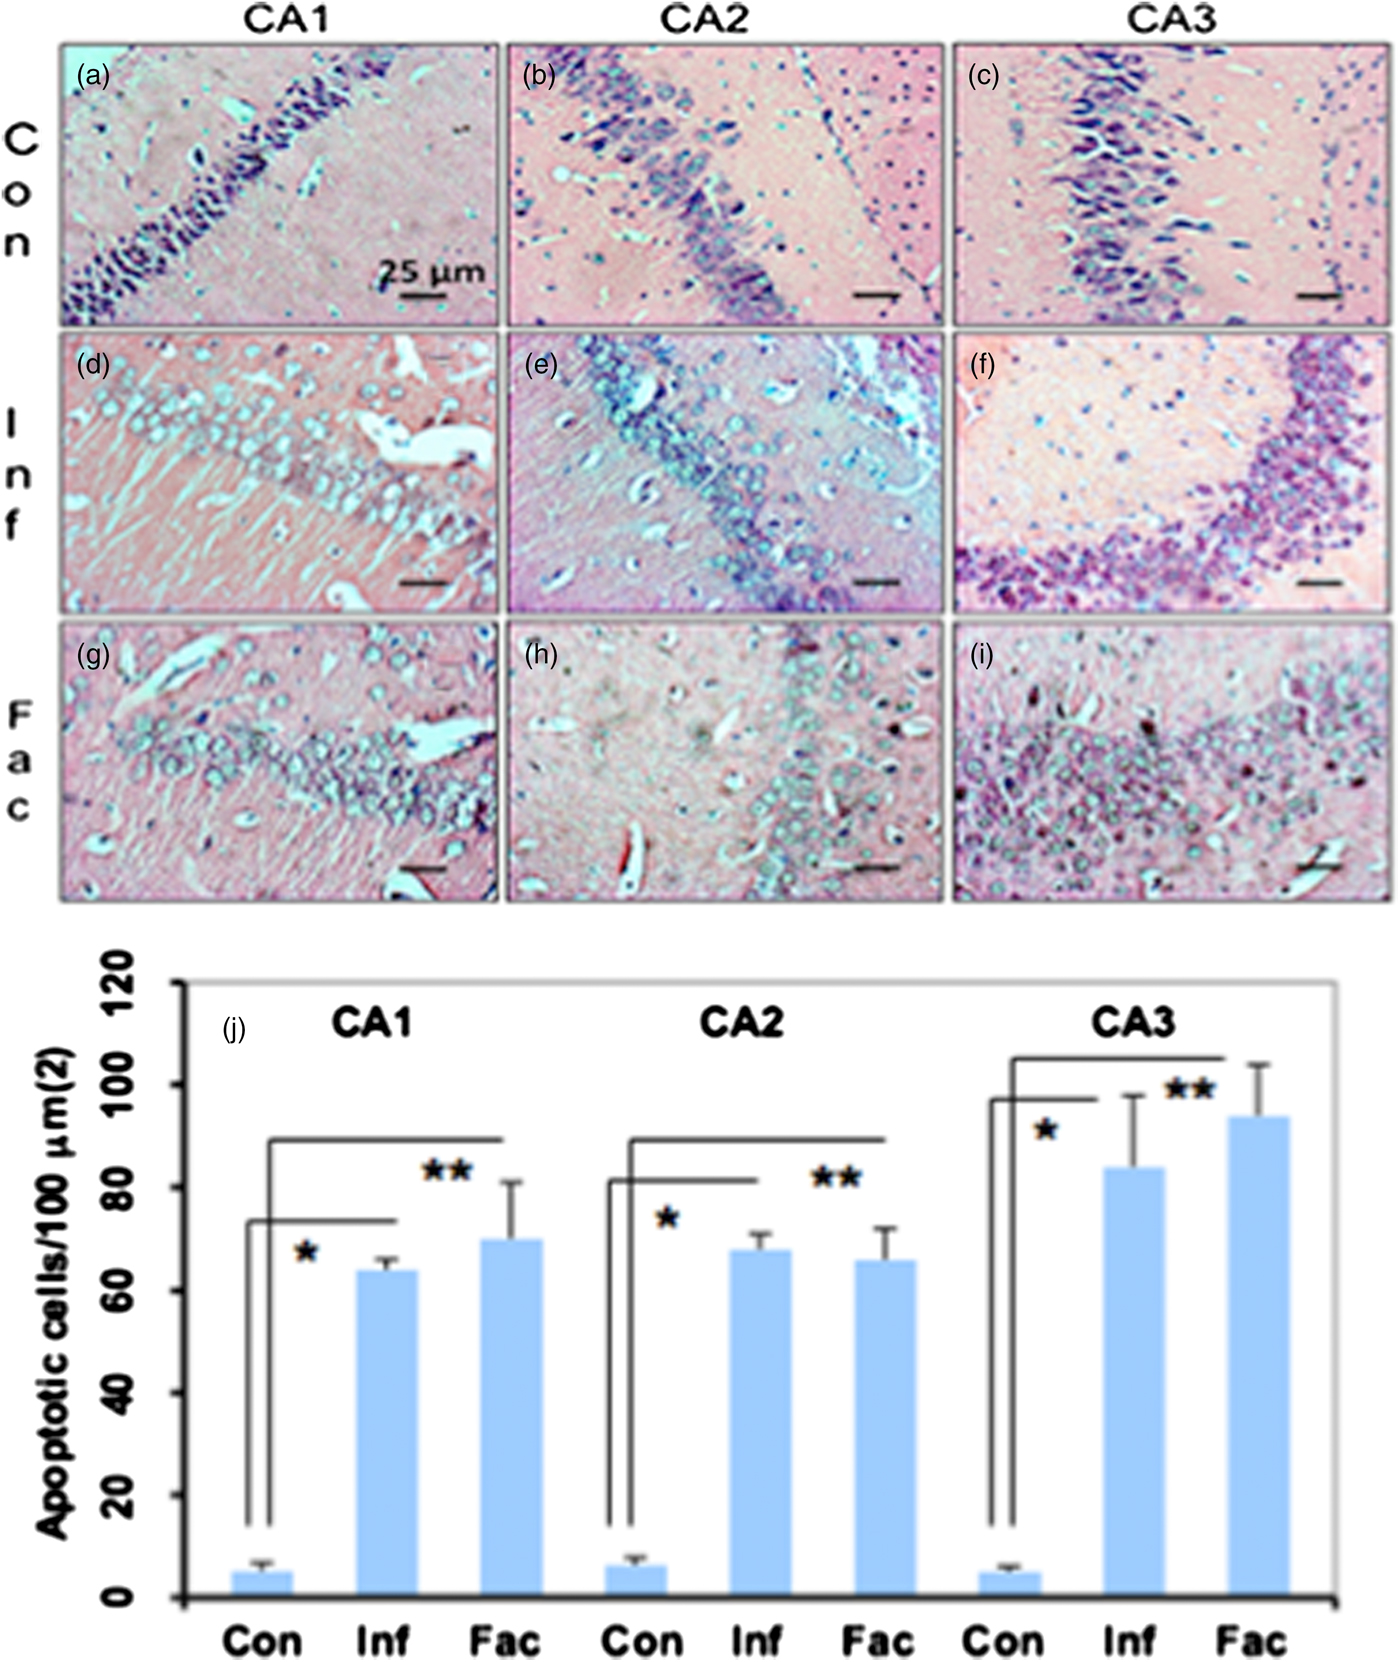
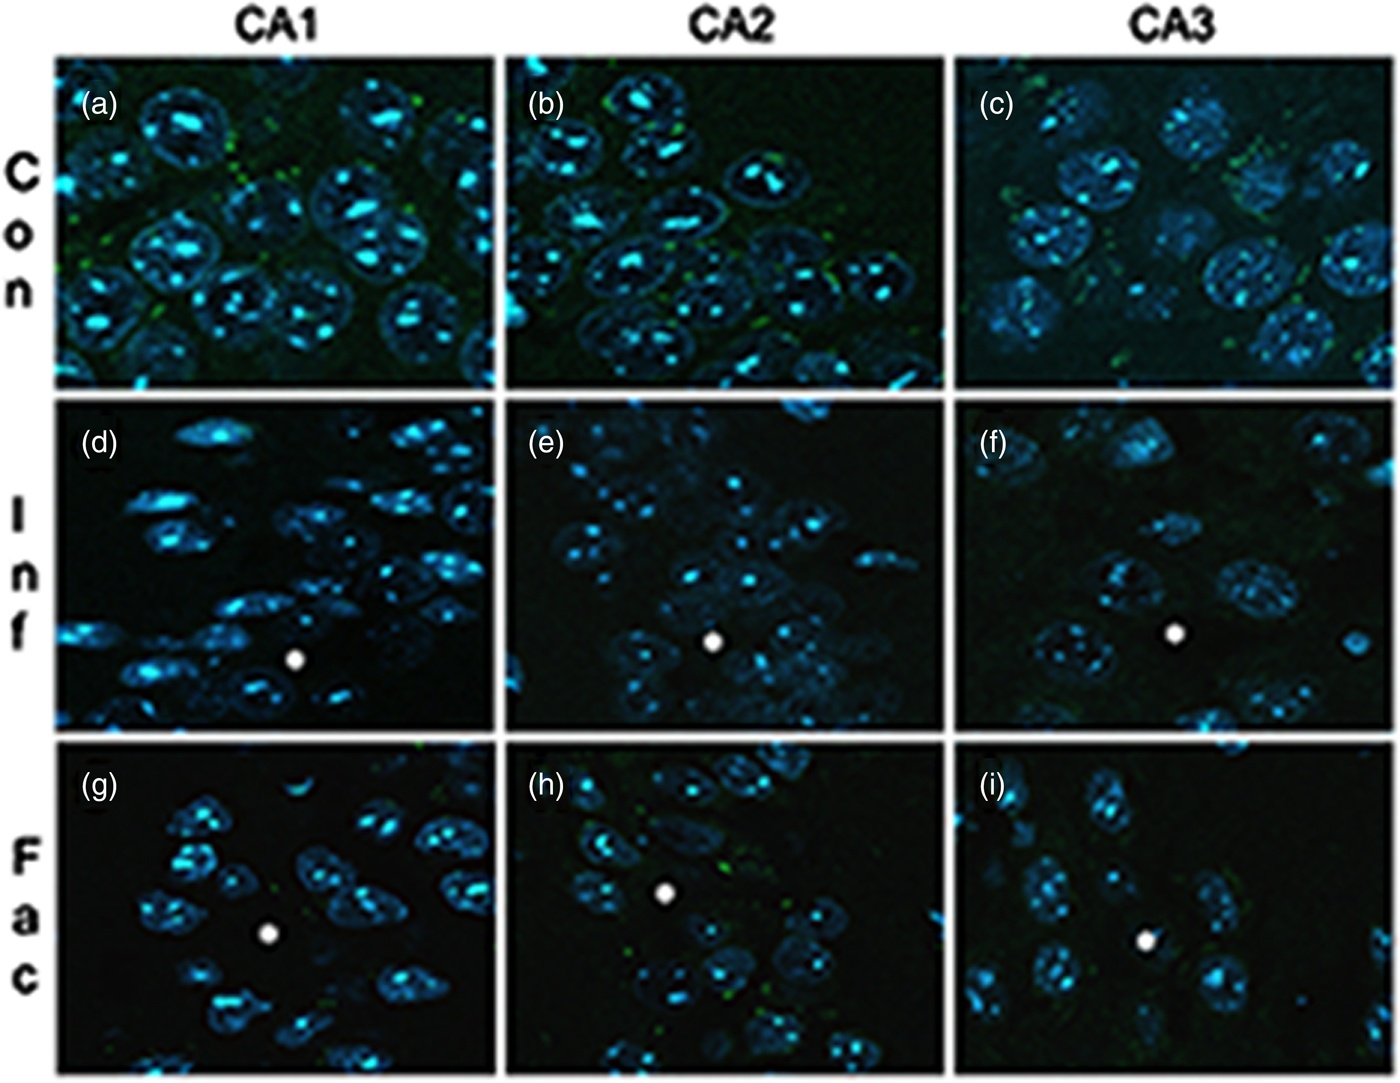
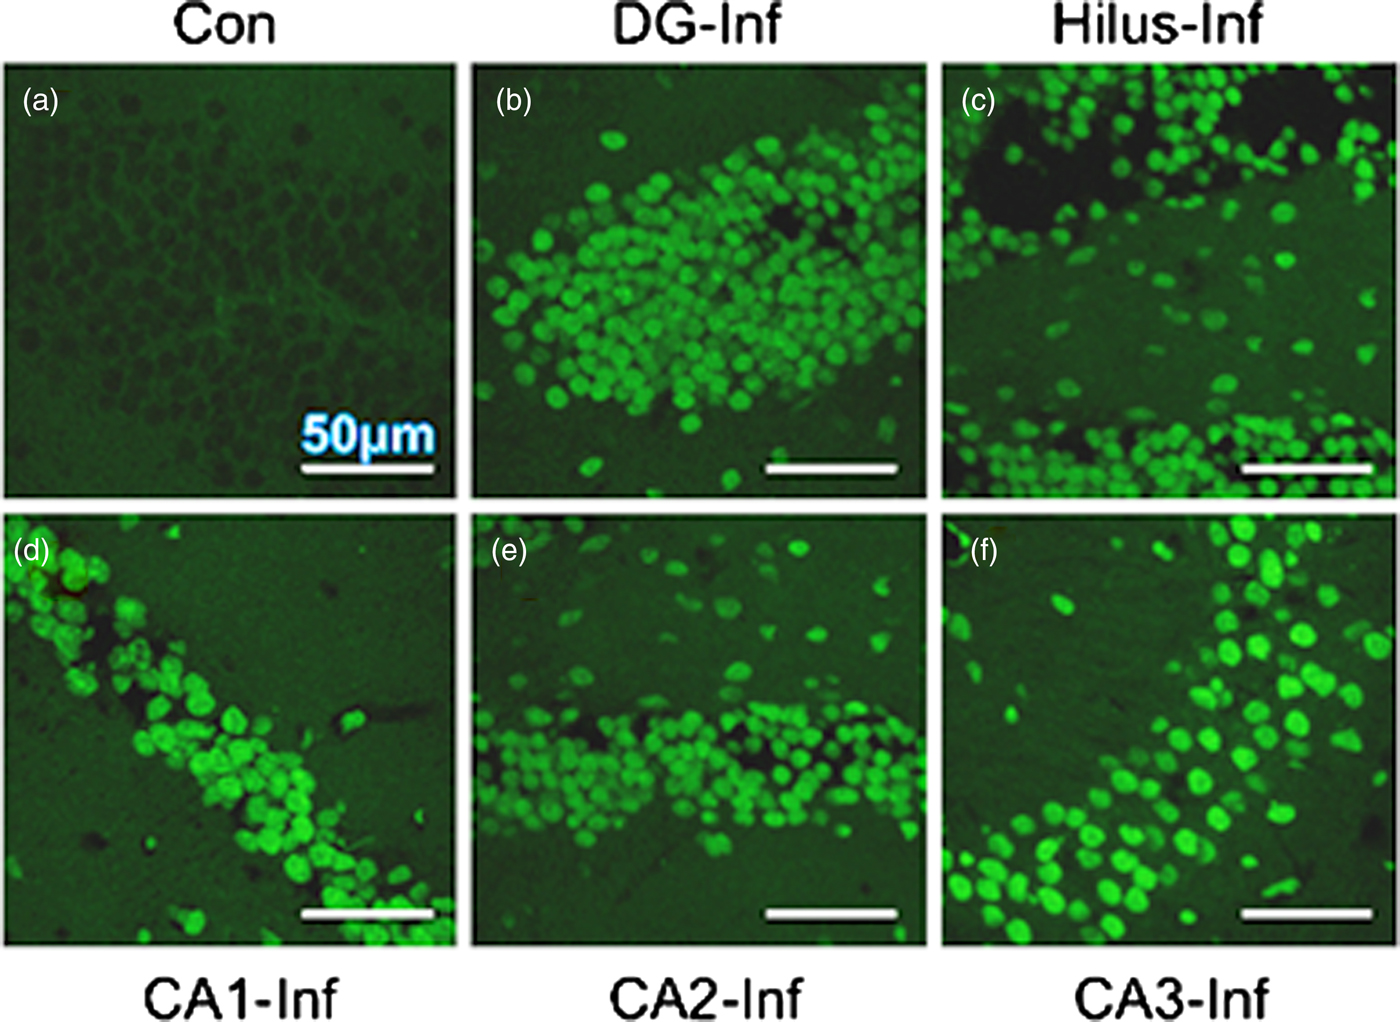
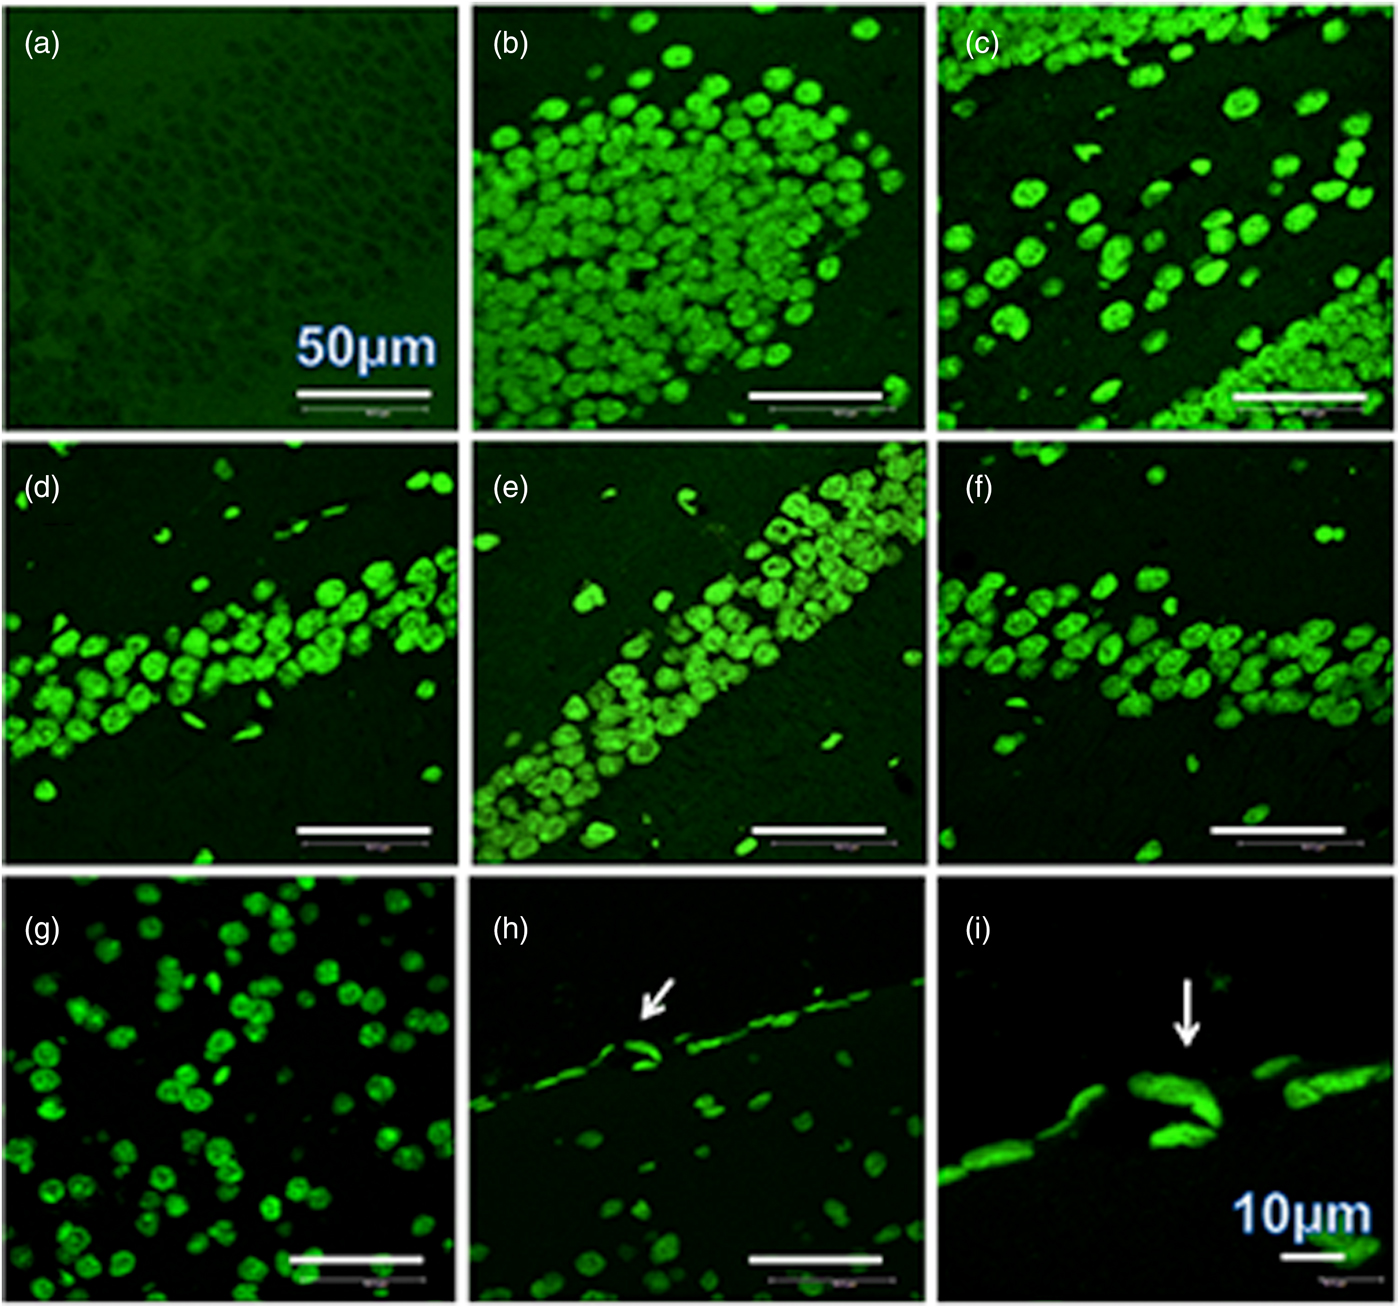
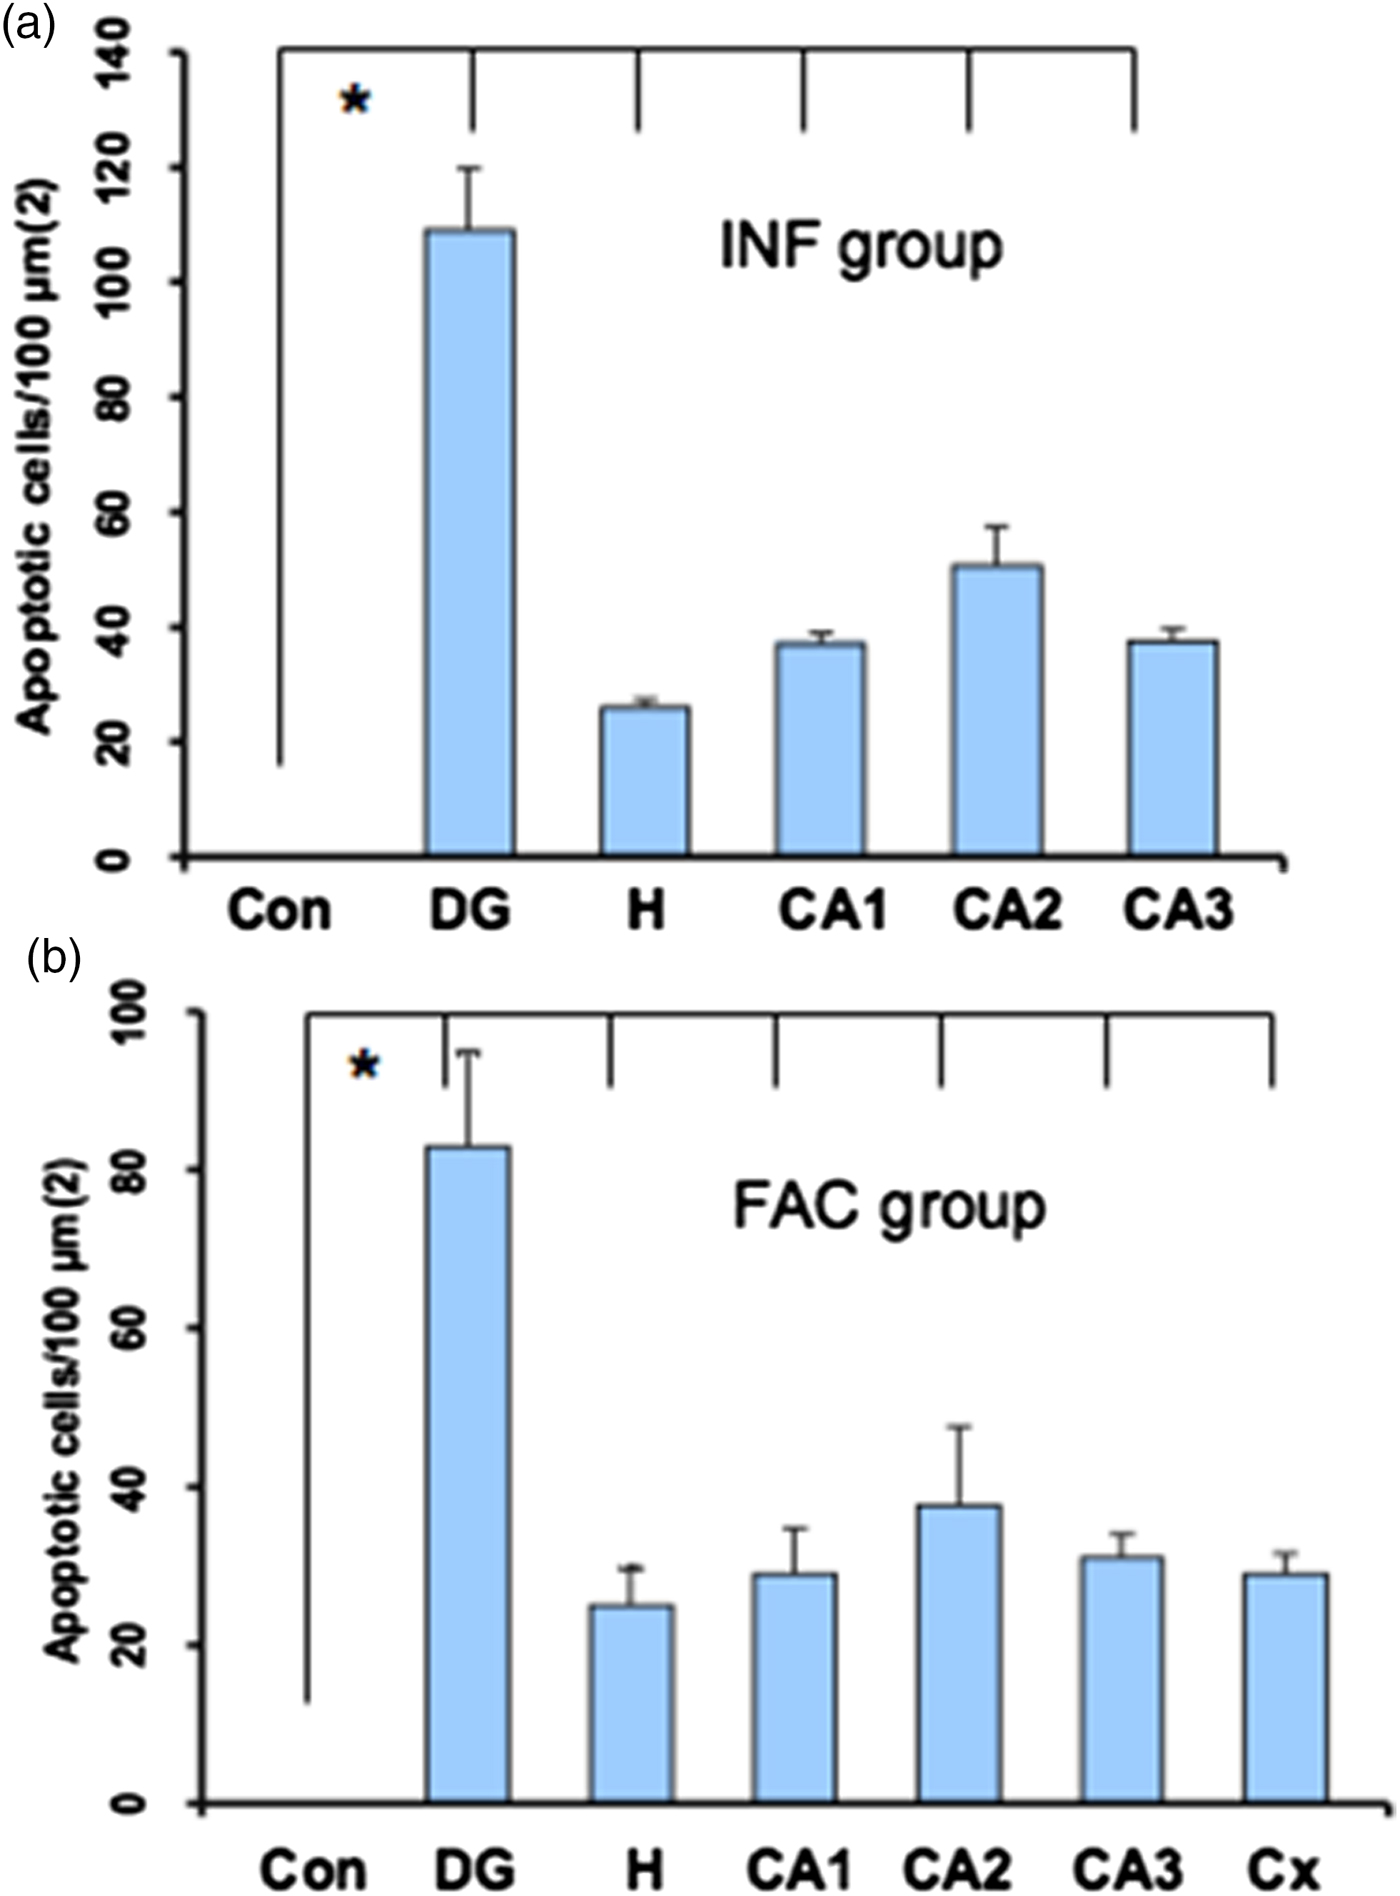
A heavy parasite load was found in the peritoneal cavity of mice infected with T. crassiceps metacestodes (485 ± 78 metacestodes per mouse). Haematoxylin/eosin staining showed that all sub-regions of hippocampi from experimental animals were affected in their tissue architecture either in the cellular morphology or in the surrounding tissue. The dentate gyri, as well as the hilus, CA1, CA2 and CA3 cells displayed dispersion, bleached nuclei, cell loss and many tears in the surrounding white matter, compared with the integrity of the cells and the white matter of the control hippocampi. Dentate gyrus branches from experimental mice (fig. 2c, e) formed a smaller angle compared to those of the control hippocampi (fig. 2a). The number of cells that had altered morphology and staining were statistically (P < 0.001) more than those of the control mice (fig. 3). DAPI staining displayed generalized pyknosis or hypercondensation of the chromatin of the CA1, CA2 and CA3 nuclei from T. crassiceps infected and Fac-treated mice. Apparently, all nuclei in these sub-regions were collapsed, and their number was less than those of the control mice. Additionally, numerous empty spaces among the reduced number of pyknotic nuclei of these sub-regions were observed, which suggested cell loss (fig. 4). Pyknosis is the accepted sign of programmed cell death (Burgoyne, Reference Burgoyne1999). To evaluate DNA fragmentation, DNA strand breaks were labelled using fluorescein-dUTP. This staining showed generalized and significant TUNEL-positive cells in the three layers of the dentate gyrus, hilus and in cells from the CA1, CA2 and CA3 regions, including the adjacent cortex (P < 0.01 Inf and Fac vs. Con). In all these places, many fragmented nuclei were observed, compared to TUNEL-negative nuclei of the control hippocampi. The intensity of the fluorescence of the nuclei in the above-mentioned regions was not homogeneous, suggesting that apoptosis was induced at different times. Nuclei with a lower fluorescence intensity and of reduced size could be among the first in developing apoptosis. Dispersion and cell loss were also observed (figs 5 and 6). Numerous TUNEL-positive cells were also found in the neighbouring cortex. A remarkable finding was the observation of apoptosis of endothelial cells in several places in all the studied regions (figs 6 and 7).
Haematoxylin/eosin-stained brain section that contains part of the dentate gyrus and hilus from a control mouse (a & b), a mouse infected with T. crassiceps metacestodes (c & d), and a mouse inoculated with T. crassiceps Fac (e & f). Cell loss (*); bleached nuclei (arrows); tears (arrowheads); gyrus branches angle (vertical bar). Scale bar = 25 μm. 40×.
Haematoxylin/eosin-stained brain sections that contain portions of CA1, CA2 and CA3 regions from a control mouse (a–c), a mouse infected with T. crassiceps metacestodes (d–f) and a mouse inoculated with T. crassiceps Fac (g–i). Scale bar = 25 μm. 40×. (j) Number of apoptotic cells/100 μm2. Bars represent the mean ± SD. * P < 0.001 Infected vs Control. ** P < 0.001 Factor vs Control.
DAPI-stained brain sections that contain portions of CA1, CA2 and CA3 from a control mouse (a–c), a mouse infected with T. crassiceps metacestodes (d–f) and a mouse inoculated with T. crassiceps Fac (g–i). Scale bar = 25 μm. 40×.
TUNEL-stained brain sections that contain a portion of the dentate gyrus from a control mouse (a), and a portion of the dentate gyrus, hilus, CD1, CD2 and CD3 from a mouse infected with T. crassiceps metacestodes (b–f). Scale bar = 50 μm. 60×.
TUNEL-stained brain sections that contain a portion of dentate gyrus from a control mouse (a), a portion of dentate gyrus and hilus from a mouse infected with T. crassiceps Fac (b and c), a portion of CD1, CD2 and CD3 from a mouse inoculated with T. crassiceps Fac (d–f), a portion of the adjacent cortex from a mouse inoculated with Fac (g), and the border of the adjacent cortex showing apoptotic endothelial cells within sections of the capillary (arrow) (h). Scale bar = 50 μm. 60×. (i) is an amplification of (h). Scale bar = 10 μm. 200×.
Statistical data from the sections stained with TUNEL. Bars represent the mean ± SD of the dentate gyrus from control mice (a & b), dentate gyrus (DG), hilus (H), CA1, CA2 and CA3 from infected mice (a), and DG, H, CA1, CA2, CA3 and Cortex (Cx) from factor mice (b). * P < 0.01 DG, H, CA1, CA2, CA3 and Cx vs Con.
Discussion
In the current research, the experimental T. crassiceps mouse model (Zepeda et al., Reference Zepeda2017) was used to investigate parasite mechanisms involved in the production of hippocampal sclerosis (HS), in which some patients suffer from neurocysticercosis. A deficit in learning and memory functions was observed using the Barnes maze. This deficit was more pronounced in mice infected with T. crassiceps metacestodes, perhaps due to a heavy parasitic load and an intense intraperitoneal inflammatory reaction as described (Zepeda et al., Reference Zepeda2010), as well as structural damage of the histoarchitecture of the hippocampi from experimental mice. This damage was characterized by significant cell death (apoptosis), cell dispersion and cell loss, in all sub-regions of the hippocampus either in the infected group or the Fac-treated animals, such as dentate gyrus, hilus, CA1, CA2, CA3, and the adjacent cortex, compared with the integrity of the cells in control mice. Structural damage was also observed in the neighbouring white matter.
The Barnes maze has been used to relate memory loss and long-term potentation (LTP) dysfunction in the hippocampus, which are involved in Alzheimer's disease. Using the Barnes maze, Hadipour et al. (Reference Hadipour2018) found that administration of crocin in rats significantly improves spatial memory indicators such as latency time. The learning deficit in Aβ (beta-amyloid)-treated animals correlated with a reduction of LTP in hippocampal synapses. Crocin significantly reduced the number of TUNEL-positive cells in the CA1 sub-region compared to the Aβ-group. Barbe et al. (Reference Barbe2016) utilized the Barnes maze to test for long-term memory deficits, with good success. Their results showed in the CA1-3 regions of the hippocampus of mice significantly reduced numbers of neuronal cell bodies overall, and reduced numbers of Pur-alpha+ neuronal cell bodies and dendrites in heterozygous Pur-alpha (+/-) mice, compared to wild-type (+/+) littermates.
Here, in every sub-region studied, a very interesting finding was the observation of apoptotic endothelial cells dispersed in the white matter near the neuronal packages and in the border of the adjacent cortex. This finding suggests that the Fac apoptogenic activity on endothelial cells could impair the blood–brain barrier, allowing the entry of the Fac (that migrated via the bloodstream when the peritoneal cavity of the mouse was infected with T. crassiceps metacestodes or the abdominal skin of the mouse was inoculated with Fac) into the brain, so that it can reach the hippocampal cells and other regions of the brain, such as thalamic nuclei (Zepeda et al., Reference Zepeda2017). The apoptogenic activity of Fac seems to have been cumulative, as was observed with the TUNEL staining.
The pathological characteristic produced by T. crassiceps metacestode infection or by T. crassiceps Fac in all sub-regions of the hippocampus resembles human hippocampal sclerosis, such as volume loss, which indicates atrophy (Jeniffer et al., Reference Jeniffer, Udayakumar and Pushpalatha2015). The learning deficit and hyperactivity are neurological manifestations of structural damage in the hippocampus, which rely on other functions, such as attention, language and spatial memory. Another feature of hippocampal sclerosis described in the literature is the increase of astrocytes during the scarring process in places where there has been cell loss due to some injury (Sloviter, Reference Sloviter1994). We looked for this feature using a rabbit antibody anti-GFAP fluorescein mouse, but we could not obtain positive results in this way. So, in the next study, we intend to test this hypothesis.
In humans, NCC damage to the hippocampus caused by the T. solium Fac must be a very chronic process, proportional to the number of living parasites; thus, when the neurological deficits are apparent, including epilepsy, the parasites are probably already calcified. Molinari et al. (Reference Molinari, Tato and Valles1987) reported that in porcine cysticercosis, the suppression of T-cells was proportional to the number of cysticerci per 1 kg of parasitized meat. Human neurocysticercosis has been associated with hippocampal atrophy, and the results of a study by Del Brutto et al. (Reference Del Brutto2017) suggested that NCC-related hippocampal atrophy takes a long time to develop.
Taenia crassiceps Fac are chromatographic Sephadex G-50 fractions containing substances of low molecular weight (< 1250 Da) obtained by ultrafiltration of the peritoneal fluid from female mice infected intraperitoneally with T. crassiceps metacestodes (Zepeda et al., Reference Zepeda2011). The complete chemical characterization of these substances has not been possible. By preliminary NMR and infrared studies, these Sephadex G-50 fractions contain at least three aromatic components, carbohydrates such as glucose, and can induce a specific antibody response in rabbits and mice, which indicate that this factor is produced by the parasite (data not published). The non-specific way this Fac induces apoptosis in different types of cells, such as testis cells (Zepeda et al., Reference Zepeda2011), ovary cells (Solano et al., Reference Solano2015), spleen cells (Zepeda et al., Reference Zepeda2016), and hippocampal cells (Zepeda et al., Reference Zepeda2017) is unknown. The learning deficit and the extensive apoptosis of hippocampal cells of experimental mice indicate a close relationship between both structure and function. Thus, it may be reasonable to assume T. solium metacestode factor is the causative agent of brain injuries such as hippocampal sclerosis in human neurocysticercosis. It will be important to contrast these results with relevant studies in human neurocysticercosis, as has been noted by Del Brutto et al. (Reference Del Brutto2016).
Using the Barnes maze, experimental mice showed a learning deficit closely related to hippocampal injury and very similar to that observed in patients with neurocysticercosis. Apoptosis of hippocampal endothelial cells suggested that T. crassiceps metacestode factor was able to break the BBB, enter the brain and produce hippocampal sclerosis.
Acknowledgments
We are grateful to Teresa Cortés and Daniela Rodríguez for performing histological procedures, and Claudia Rivera and Héctor Malagón for providing the healthy mice. Nadia Zepeda was supported for her graduate studies by the Posgrado en Ciencias Biológicas, Universidad Nacional Autónoma de México (UNAM) and CONACyT (scholarship number 262633).
Financial support
This research was supported by Universidad Nacional Autónoma de México.
Conflict of interest
None.
Ethical standards
The authors assert that all procedures contributing to this work comply with the ethical standards of the laws of Mexico on the care and use of laboratory animals. Animal studies were performed under an institutional protocol similar to that of the U.S. Public Health Service's Guide for the Care and Use of Laboratory Animals. From the Secretariat of Agriculture (SAGARPA NOM-062-ZOO-1999).