Introduction
Drawing on the concept of a ‘biological standard of living’ (Komlos, Reference Komlos1995; Komlos & Baten, Reference Komlos and Baten1998; Baten & Blum, Reference Baten and Blum2012), which is anchored in the pioneering works of population economist Robert Fogel (Fogel, Reference Fogel1983, Reference Fogel2004; Floud et al., Reference Floud, Fogel, Harris and Hong2011) and opposed to the idea of a mere ‘economic’ standard of living, numerous studies have examined the environmental effects on human biological well-being within present and past societies. Of special interest are studies investigating the biological standard of living of a single group of people living in two nations. Indeed, history has provided a few natural experiments suitable for this. For instance, the Cold War (1947–1991), between chiefly the United States and Soviet Union, resulted in the division of the world into two blocs. As a result of this, some people ended up living in two nation states, such as the people of West and East Germany (1949–1990). Previous biosocial research has suggested that living conditions were slightly better in US-influenced West Germany than in Soviet-influenced East Germany. For instance, mean height is a common and reliable proxy of biological living standards in historical societies (Fogel, Reference Fogel1983; Komlos, Reference Komlos1994; Steckel, Reference Steckel1995; Koepke & Baten, Reference Koepke and Baten2005), and it has been suggested that West Germans were on average about one centimetre taller than their East German counterparts (Komlos & Kriwy, Reference Komlos and Kriwy2003). This indicates that the nutritional and health environment was better in the market economy of West Germany than in the socialist command economy of East Germany.
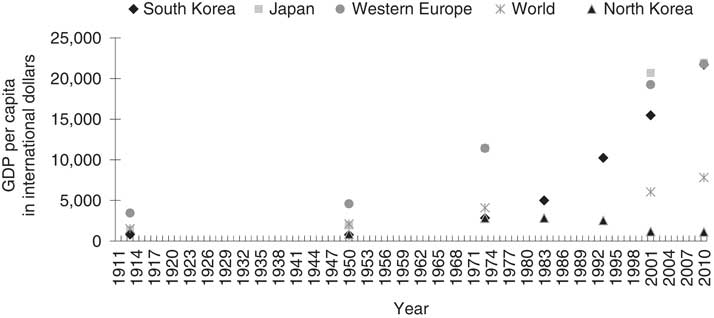
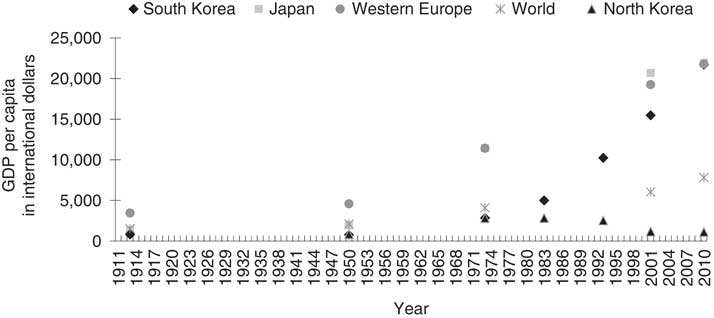
Similarly, administrative division of the Korean peninsula into the market-oriented South and socialist North (officially in 1948) has since enabled researchers to gain unique insights into how biosocial living conditions have evolved during the Cold War and beyond. In fact, the case of the two Koreas might even be more interesting than that of the (economically more equal) two Germanies, as market-oriented South Korea attained the position of a top ten economy by the mid-2000s. As evidenced in Fig. 1, South Korea was one of the poorest countries in the early twentieth century and clearly below the world average in terms of gross domestic product (GDP) per capita. However, by 2010, South Korea’s economic performance had matched that of Japan or Western Europe. In fact, South Korea became the world’s fastest growing economy in terms of GDP per capita in the second half of the twentieth century (Maddison, Reference Maddison2001, p. 148) thanks to export-oriented programmes initiated by the government. On the other hand, the socialist North has been characterized by a lack of economic growth and represents one of the poorest countries in the world currently due to its isolationist economic policy. As shown in Fig. 1, income levels per capita remain far below the world average and have not improved much since 1950 due to socialist mismanagement. In other words, those living in both North Korea and South Korea were some of the poorest in the world at the beginning of the twentieth century. However, by the beginning of the twenty-first century, South Korea had become one of the richest and most prosperous nations in the world, whereas North Koreans have continued to live in one of the most undeveloped ones (Fig. 1).
GDP per capita in the two Koreas and selected regions, 1911–2010. Western Europe pertains to Austria, Belgium, Denmark, Finland, France, Germany, Italy, Netherlands, Norway, Sweden, Switzerland and the United Kingdom. Data for North Korea in 2010 pertain to 2008. Sources: Maddison (Reference Maddison2003, pp. 180–184, 262); Bolt & van Zanden (Reference Bolt and Van Zanden2013).
The purpose of this study was to shed light on living conditions in the two Koreas by utilizing an established demographic indicator, notably extreme life expectancy, which is also known as longevity. Measurement of longevity is based on the number of centenarians, i.e. persons who reached an age of 100 or above (Jeune & Vaupel, Reference Jeune and Vaupel1995). A higher prevalence of centenarians is broadly indicative of better living conditions. In particular, the rate of centenarians is an easily understood, straightforward and common indicator (perhaps similar to human height), and has therefore attracted a lot of attention inside and outside the field – not only by scholars but also by journalists and politicians.
The objective of the study was to investigate the total and relative prevalence of centenarians in both North Korea and South Korea based on old and recently released census data. The study represents the first statistical comparison of (past and present) longevity between the two Koreas and thus fills a gap in the literature regarding longevity of centenarians in the world (Jeune & Vaupel, Reference Jeune and Vaupel1995).
Methods
Data were from censuses conducted in the two Koreas as well as in pre-divided Korea under Japanese rule (1910–1945). Whereas South Korea has carried out numerous censuses, North Korea has conducted only one internationally acknowledged census, which was implemented as late as 2008. The North Korean census is discussed first, and then the censuses conducted in pre-divided Colonial Korea as well as the numerous ones in South Korea.
The recent North Korean census of 2008 presented researchers a unique opportunity to understand the prevalence of longevity in one of the most isolated countries in the world. An earlier census was conducted with some technical assistance from the UN from late 1993 to early 1994, with a reference date of 31st December 1993 (Spoorenberg, Reference Spoorenberg2014). Analysis of that census was complicated by the circumstance that access to the published report was generally limited to internal researchers only. More importantly, that census was not conducted in consideration of international guidelines and has thus received little recognition by international scholars. Among other technical issues, one major concern is that large portions of the male population were apparently excluded by the government, probably for military reasons. In contrast to the 1993 census, the 2008 census was fully conducted according to UN guidelines and included the total population of North Korea along with some international observers present during implementation of the census. The 2008 census was carried out from 1st October to 15th October 2008, with a reference date of 1st October 2008 (Central Bureau of Statistics, 2009). The 2008 census was co-conducted and co-financed by the UN although most of the costs were covered by the government of South Korea. Due to high costs, estimated to be around 5–6 million US dollars, as well as ongoing political and nuclear tensions on the Korean peninsula, a further census awaits implementation.
To understand how longevity has developed in pre-divided Korea, early censuses carried out on the Korean peninsula were examined. In 1925, under colonization (1910–1945), the Japanese rulers implemented the first census on the Korean peninsula with an aim of continuing such censuses every 5 or 10 years. In fact, the first census in Colonial Korea was originally scheduled for 1920, which was when Japan conducted its own first census (Kim, Reference Kim2004, p. 33). However, due to nationwide protests in Korea against Japanese colonial rule in 1919 (March First Independence Movement), the census was postponed to 1925 (with a reference date of 1st October 1925). Note that the Japanese did not conduct the census from 1921 to 1924 since the surveyors preferred ‘0’ and ‘5’ years; hence 1925 was the closest date after the failed census in 1920. Further, the tradition of conducting censuses every 5 to 10 years and in ‘0’ and ‘5’ years was continued under Japanese colonization as well as by the government of South Korea. The first census of 1925, as well as the earliest census after the Korean War (1950–1953) in 1955, were simplified population censuses, whereas most other censuses included additional relevant data such as job status, housing information and so forth (Kim, Reference Kim2004, p. 37). Fortunately, the 1925 census report included the number of colonial Koreans in the ‘100–104’, ‘105–109’, ‘110–114, and ‘115 and over’ year age groups stratified by province. To compare living conditions in 1925 with those in contemporary North Korea and South Korea, provinces were combined into Northern Korean regions (labelled as ‘North Korea’) and Southern Korean regions (labelled as ‘South Korea’) in the 1925 census. However, as the Korean War resulted in the division of Gangwon Province into North and South Korean Gangwon Provinces (which are almost equal in terms of geography, demography and size) in 1953, data on the total as well as centenarian populations from Gangwon Province of 1925 were removed from the later analysis.
The first census conducted in South Korea after the official founding of the two Koreas (1948 to present) was in 1949, one year before the targeted ‘0’ year of 1950, as the new government of South Korea urgently needed demographic information for economic and social planning. However, except for a preliminary report showing only the total population without any age breakdowns, these census data did not survive the Korean War (Kim, Reference Kim2004, p. 35). Further censuses were conducted in South Korea in 1955 (‘Population Census’), 1960 (‘Population and Housing Census’), 1966 (‘Population Census’), which was postponed one year from 1965 due to budgeting reasons, 1970, 1975, 1980, 1985, 1990, 1995, 2000, 2005, 2010 and 2015 (all of which were ‘Population and Housing Censuses’ and were conducted in typical ‘0’ and ‘5’ years). However, age breakdowns of persons aged 100 years or older are only available from 1990 to 2010. As of this writing, data from the most recent census of 2015 have not yet been officially released.
In any event, this research primarily draws from the 2010 census of South Korea for broad chronological comparison since it most closely resembles the unique and internationally recognized North Korean census conducted in 2008. Data on centenarians in South Korea were reported in groups of ‘100 years or over’, hence allowing for comparison with the North Korean census conducted around that time. Unfortunately, further age breakdowns (e.g. of super-centenarians or persons 110 years or older) were absent in the South Korean census. For linguistic reasons, the 2008 census of North Korea will hereafter be labelled as the 2010 North Korean census, even though it was conducted in 2008. In addition, data on centenarians were borrowed from the 1990 and 2000 censuses in order to investigate the prevalence of centenarians in South Korea over time.
For the sake of completeness, it should be noted that age was calculated based on the exact date of birth and the exact date of interview throughout all censuses carried out on the Korean peninsula. Korean age differs from Western age standardizations by 1 to 2 years since Koreans include pregnancy (+1 year) as well as advance in age with the traditional Lunar New Year (+1 year) and not with their individual birthday (Pratt et al., Reference Pratt, Rutt and Hoare1999, p. 2; Lewis et al., Reference Lewis, Jun and Schwekendiek2013, p. 248). Thus, depending on the date of the interview and the timing of the lunar year (which commonly falls somewhere into the first quarter of the solar calendar) and the individual birthday, Koreans are at least 1 and up to 2 years older than Westerners. However, these distortions only occur if the surveyors asked the respondents how old they were. Fortunately, the Japanese colonizers utilized Western age calculations, which were based on the exact date of interview and date of birth, in their censuses implemented in Japan and their colonies, including Korea. This tradition was carried on in both Koreas. This is best illustrated by the fact that all Korean census reports included the age group of zero years of age, which by default does not exist if traditional Korean age classifications were used.
Results
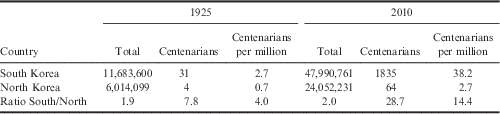
How many centenarians have lived in the two Koreas? Table 1 depicts the total population, number of centenarians, and share of centenarians per one million persons in the two Koreas from 1925 to 2010. In 1925, 31 centenarians were living in South Korea and four in North Korea. This equals 2.7 centenarians per one million South Koreans as well as 0.7 centenarians per one million North Koreans, tentatively indicating that biosocial living conditions were about four times better in the South (Table 1). Even before the division of the Korean peninsula, South Koreans were living under relatively better conditions, which could have been due to their better nutritional status. Indeed, Japanese colonizers mostly developed the flatter Southern half as ‘rice bowl’ areas, whereas they set up their heavy industry in the mountainous North, including hydroelectric power plants, mines and chemical factories. The higher prevalence of centenarians in the South in 1925 thus broadly indicates improved nutritional and working conditions.
Total population and prevalence of centenarians in the two Koreas in 1925 and 2010
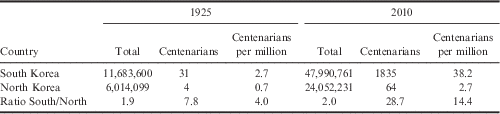
Furthermore, Table 1 illustrates that longevity improved in both Koreas from 1925 to 2010. Indeed, the number of centenarians in the South improved from 31 persons in 1925 to 1835 persons by 2010, which is an increase from 2.7 to 38.2 centenarians per one million persons. Similarly, the number of centenarians in the North improved from four persons in 1925 to 64 persons in 2010, which is an increase from 0.7 to 2.7 centenarians per one million persons. However, the longevity gap between the two Koreas increased by 2010. Whereas there were four times as many centenarians per one million persons in the South than in the North in 1925, there were over fourteen times as many centenarians per one million persons in South Korea by 2010. In other words, longevity gaps have dramatically widened, reflecting the economic performances of the two systems (Fig. 1). Interestingly, North Korea’s rate of 2.7 centenarians per one million persons as of 2010 equals South Korea’s rate (2.7 centenarians per one million persons) as of 1925 (Table 1), suggesting that North Koreans are lagging some 85 years behind South Koreans in terms of prevalence of centenarians.
Table 2 depicts the number of centenarians per one million people in South Korea in 1925, 1990, 2000 and 2010. The rates of centenarians have dramatically improved in South Korea over the last decades (during which the nation matched the GDP per capita of Japan and Western Europe, see Fig. 1), nearly doubling from 10.6 in 1990 to 20.3 in 2000 and then again almost doubling from 20.3 in 2000 to 38.2 in 2010. From 1990 to 2010, rates improved from 10.6 to 38.2 centenarians per one million persons, indicating a four-fold (3.6) increase over two decades and nearly two-fold (1.8) increase per decade. In comparison, rates of centenarians improved on average seven-fold over three decades (7.5 to 52.6 per one million persons from 1960 to 1990) in fourteen developed nations (Jeune, Reference Jeune and Jeune1995, p. 13), including Austria, Denmark, England & Wales, Finland, France, Iceland, Italy, Japan, Netherlands, New Zealand, Norway, Sweden, Switzerland and West Germany – yielding a nearly two-fold (2.3) improvement per decade. Therefore, South Korea’s rate of centenarians (about 1.8-fold per decade) is on a par with that of other developed nations (2.3-fold per decade).

Table 3 shows the prevalence of centenarians per one million people in South Korea in comparison to similarly developed nations, including England & Wales as an early industrialized nation, West Germany as another country being politically divided after World War II and in light of the Cold War, and Japan as another developed nation in East Asia. In 1960, early-industrialized England & Wales has higher rates (11.6) than industrializing South Korea (2.7). However, South Korea’s rates were already remarkably high at that time, outperforming Japan (1.7 centenarians per 1 million people) and even West Germany (2.2 centenarians per 1 million people). By 1990, the prevalence of centenarians surged in England & Wales 6.5-fold (76.3 centenarians per 1 million people), in West Germany 18.18-fold (76.3 centenarians per 1 million people) and in Japan 14.88-fold (25.3 centenarians per 1 million people). In comparison, the prevalence of centenarians in South Korea improved only moderately 3.8-fold from 1960 to 1990 (10.6 centenarians per 1 million people).
Prevalence of centenarians per million in South Korea in comparative perspective with similar developed nations in 1960 and 1990

Data for South Korea in 1960 pertain to 1925, the closest year for which data were available.
Sources: Jeune (Reference Jeune and Jeune1995, p.13); KOSIS (2016).
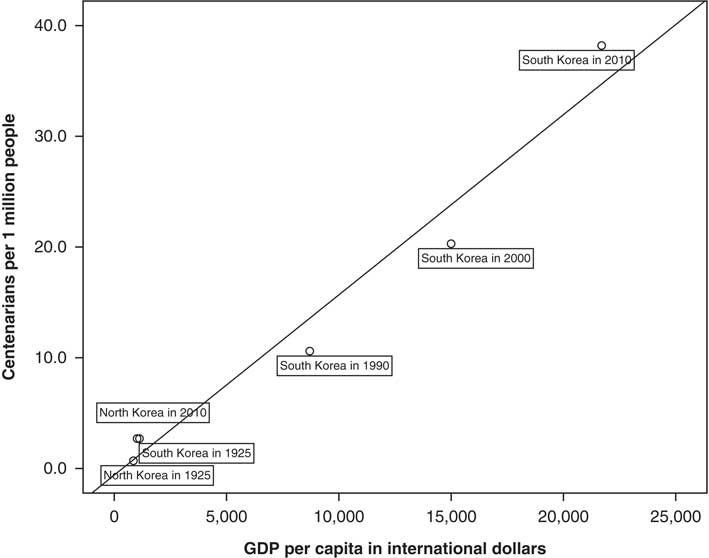
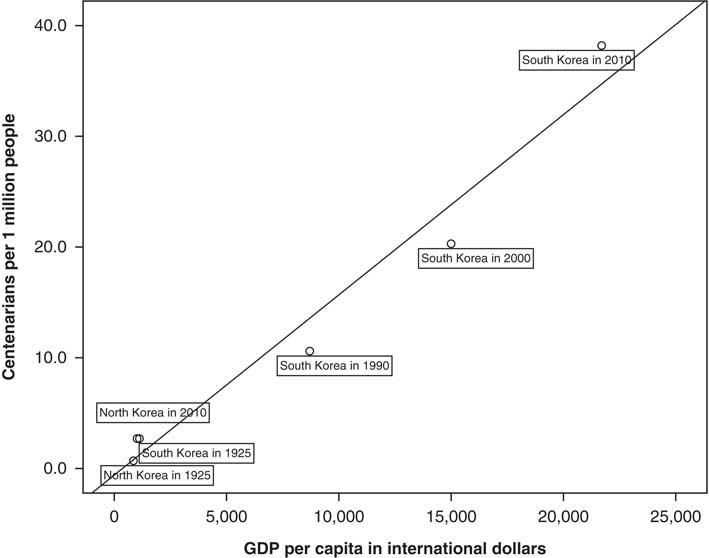
Lastly, Fig. 2 suggests that GDP per capita (Fig. 1) and the rate of centenarians in the two Koreas (Tables 1 and 2) are positively and strongly correlated (Pearson Correlation Coefficient=+0.982; p<0.001). Whether or not correlation is also causality is beyond the scope of this paper.
Correlation analysis of GDP per capita and the rate of centenarians in the two Koreas in 1925, 1990, 2000 and 2010. Pearson Correlation Coefficient=+0.982 (p<0.001); GDP per capita of North Korea as of 1925 pertains to 1950; GDP per capita of North Korea as of 2010 pertains to 2008. Sources: Fig. 1, Table 1 and Table 2; Bolt & van Zanden (Reference Bolt and Van Zanden2013).
Discussion
Over recent decades, economic living conditions have improved dramatically in South Korea, which now represents one of the world’s most developed nations. At the same time, its twin in the North remains one of the poorest countries on earth. The Korean peninsula thus represents a unique historical experiment that allows for study of the effects of the environment on human development under a variety of ceteris paribus genetic, cultural and climatic conditions.
A central finding of this study is that the prevalence of contemporary centenarians is roughly fourteen times higher in the South compared with the North. This corroborates previous anthropometric studies on the two Koreas. For instance, a meta-analysis conducted on height and weight of pre-school children in the two Koreas by Schwekendiek and Pak (Reference Schwekendiek and Pak2009) found that contemporary South Koreans were on average 3–8 cm taller and about 1–3 kg heavier than their Northern peers. Mid-upper arm circumference of contemporary South Korean women was on average 2–4 cm greater than that of North Koreans (Schwekendiek, Reference Schwekendiek2013). Similarly, contemporary South Korean women were found to be 4–9 kg heavier than their North Koreans counterparts (Schwekendiek, Reference Schwekendiek2009).
Furthermore, census data covering the two Koreas in the years 1925 and 2010 have provided an opportunity to study the performance of the two diametrically opposed economic and political systems over time. In 1925, North Korea had some 0.7 centenarians per one million persons, and the rate moderately improved to 2.7 per one million persons by 2010. Conversely, rates improved dramatically in South Korea from 2.7 per one million persons in 1925 to 38.2 per one million persons in 2010. This result is along the lines of a study on the anthropometric gaps between the two Koreas that found a secular and rapid growth spurt in height of men and women in the South as opposed to stagnating heights in the North over the last decades (Pak et al., Reference Pak, Schwekendiek and Kim2011).
Another interesting finding of this study is that Southern Koreans enjoyed better biological living standards than Northerners during Japanese colonization, as indicated by the higher prevalance of centenarians in the South. This finding is in contrast to the aforementioned study on heights of men and women, which found that Northern Koreans were slightly taller than Southern Koreans prior to the political division in 1948 (Pak et al., Reference Pak, Schwekendiek and Kim2011), suggesting that biological living standards were worse in the South. One explanation could be that the North Korean height samples were exclusively drawn from refugees measured upon their arrival in South Korea, none of whom was randomly sampled from the total population. Since the census data are obviously more reliable, this study now suggests that South Koreans were slightly better-off before division of the peninsula compared with the North. Further studies are needed to confirm this.
This study further suggests that the rate of centenarians in North Korea around 2010 corresponds to that of South Korea in 1925, suggesting a chronological lag in delayed biological development of some 85 years. This result is in line with previous demographic studies on the two Koreas. For instance, while age at menarche of contemporary North Korean women was estimated at 16.0 years (Ku et al., Reference Ku, Kang, Kim, Kim, Jee and Suh2006), contemporary South Korean women showed an age at menarche of 13.79 years (Cho et al., Reference Cho, Park, Shin, Hur, Kim and Kim2010). More importantly, a mean age at menarche of 16.0 years had already been achieved in South Korean cohorts born in the mid-1950s (Cho et al., Reference Cho, Park, Shin, Hur, Kim and Kim2010), suggesting that North Korean women lag half a century behind South Koreans in terms of biological development.
Age reliability is a common problem in demographic research. While there is no study at all on age reliability in North Korea, the ages of 54 centenarians in South Korea sampled in a nationwide centenarian study that began in 2001 were all verified (Park, Reference Park2012). Among other methods, age was confirmed by cross-checking the animal year at birth (oriental zodiac) reported by the centenarians against their officially registered birth year. Indeed, for traditional reasons, all Koreans do know (if not ‘believe’) in their oriental zodiac; that is, even if Koreans had a false birth year for one reason or another, they would still refer to their real animal year at birth for cultural–traditional reasons. To further test age reliability of North and South Koreans, the Whipple’s Index is calculated, which is by far the most applied indicator used for this in historical research (Baten, Reference Baten2016, p. 11). Unfortunately, there are only grouped age data in the Korean census report of 1925; however, the 2010 censuses in the two Koreas include exact single age numbers, allowing the construction of Whipple’s Indices for the age bands 23 to 62. The Whipple’s Index for contemporary South Korea is 102.3 and the one for North Korea 101.0. The United Nations classifies the quality of age data as ‘very accurate’ if the Whipple’s Index falls below <105 (Jeune & Vaupel, Reference Jeune and Vaupel1999, p. 213), suggesting that Korean age indications are reliable enough to be used herein. Of note, one reason for the apparently high age reliability in both Koreas is that people in both nations are strictly monitored by the state for national security and mandatory military draft reasons. For instance, all births have to be registered within 15 days in North Korea (Eberstadt & Banister, Reference Eberstadt and Banister1992, p. 116) and within 30 days in South Korea (personal observation).
In conclusion, this study broadly confirms previous biosocial studies on the two Koreas and two Germanies that reported improved human biological performance in market-oriented systems compared with socialist command economies.
Acknowledgment
This research was supported by the National Research Foundation of Korea (NRF-2007-361-AL0014).