Implications
Cattle contribute to global warming through emission of nitrous oxide (N2O) from urine and faeces. Urinary nitrogen (N) is much more susceptible to gaseous losses than faecal N. To reduce urinary N excretion and N2O emission and improve N efficiency of cattle, dietary levels of N should be decreased and an optimal balance between N and energy substrates in the diet should be aimed at. Increasing urine volume by increased dietary mineral contents appears a promising N2O mitigation strategy, particularly in pasture. Further reduction of effective mitigation strategies requires an integrated animal nutrition and excreta management approach.
Introduction
Consumption of dairy products and meat by an expanding human population is projected to rise by well over 50% during the next four decades (FAO, 2011). With little prospects to increase the area of agricultural land significantly, food production will have to intensify to ensure an affordable, ample food supply. Ruminants play a key role in human food production by converting plant resources that humans cannot or choose not to consume, into edible high-quality food. For dairy cattle, the return on human-edible protein inputs (calculated as the output of human-edible protein in products compared with human-edible protein input with feed) is larger than 1 (range: 1.4 to infinite; reviewed by Dijkstra et al., Reference Dijkstra, France, Ellis, Strathe, Kebreab and Bannink2013), indicating that dairy cattle add to the total human food supply. For beef cattle, protein efficiencies on a human-edible basis are often larger than 1, but are more variable (range: 0.33 to infinite) than for dairy cattle. In view of the expanding world population, there is a need to increase resource use efficiency in animal production systems (Hume et al., Reference Hume, Whitelaw and Archibald2011). Especially landless, intensive animal production systems are of concern because of their environmental impacts. Major losses of nitrogen (N) occur in these systems via ammonia (NH3), nitrous oxide (N2O) and di-nitrogen (N2) emissions to air, nitrate (NO3−) leaching to groundwater and via overland flow and discharges of particulate N to surface waters (de Klein et al., Reference De Klein, Eckard and van der Weerden2010). N2O contributes to losses of ozone in the stratosphere (Ravishankara et al., Reference Ravishankara, Daniel and Portmann2009) and it is the third most important greenhouse gas (GHG), with a global warming potential 298 times that of carbon dioxide (CO2) over a 100-year time horizon. It is an obligate intermediate in denitrification, and is also produced during nitrifier denitrification and nitrification processes (Wrage et al., Reference Wrage, Velthof, van Beusichem and Oenema2001).
The principal driver of N losses from cattle is N intake. Variation in dietary N supply will affect, in particular, urinary N output (Huhtanen et al., Reference Huhtanen, Nousiainen, Rinne, Kytölä and Khalili2008). Urinary N is more susceptible to losses than faecal N, at least in a short term (Bussink and Oenema, Reference Bussink and Oenema1998). Usually, most of the N in cattle urine is in the form of urea, which hydrolyzes rapidly (complete hydrolysis within 1 to 2 days) upon excretion. Subsequent transformations of NH3 and NO3− via nitrification and denitrification to N2 make urinary N a potentially important source of N2O. The release of N2O depends on the composition of urine. For example, the urinary constituent, hippuric acid, may reduce soil N2O emissions (Kool et al., Reference Kool, Hoffland, Hummelink and van Groenigen2006a). Therefore, our objective is to review the effect of diet composition on the level and the form of N excreted in the urine of cattle, with a focus on dairy cattle, and its consequences for direct and indirect emissions of N2O.
Diet effects on level of N in urine
Dietary N is either partitioned into proteinaceous products such as milk and meat or excreted in faeces and urine. N intake has been identified as the principal driver of N excretion. Reduced N intake decreases N excretion in faeces but particularly in urine, in beef cattle (Yan et al., Reference Yan, Frost, Keady, Agnew and Mayne2007) and dairy cattle (Huhtanen et al., Reference Huhtanen, Nousiainen, Rinne, Kytölä and Khalili2008). The N-use efficiency in cattle (N output in milk or meat divided by N input), although highly variable, may increase upon a reduction in N intake. For example, univariate meta-analysis showed reduced N output in faeces and urine and improved N-use efficiency in dairy cattle, from 0.25 to 0.30, upon a decrease in N intake from 600 to 300 g/day, respectively (Kebreab et al., Reference Kebreab, Strathe, Dijkstra, Mills, Reynolds, Crompton, Yan and France2010). The average N-utilization efficiency in dairy cattle is some 0.25 (range: 0.15 to 0.40; Calsamiglia et al., Reference Calsamiglia, Ferret, Reynolds, Kristensen and van Vuuren2010). Major improvements in N efficiency at the animal level have been shown in practice through increased production levels and reduced dietary N contents (Figure 1). With a rise in annual fat- and protein-corrected milk (FPCM) production in The Netherlands from 6270 in 1990 to 8530 kg/cow in 2011, feed required decreased from 0.88 in 1990 to 0.77 kg dry matter (DM)/kg FPCM in 2011. Dietary N concentration was reduced as well (1990, 32.5 g/kg DM; 2011, 24.4 g/kg DM). The N-use efficiency increased from 0.18 to 0.28. Similar improvements in efficiency and reduction of N excretion per unit product have been shown in other dairy and beef cattle production systems (e.g. Capper, Reference Capper2011). Improvements in the production efficiency may reduce animal N waste per unit product; however, if this coincides with increased imports of concentrate and fertilizer N, N efficiency at farm level may actually decrease because of higher losses at plant and soil level. Generally, production yield differentials are the key performance driver in cattle production profitability (Wilson et al., Reference Wilson2011). However, feed intake level or nutrient density at which efficiency of nutrient use at animal level is maximized, generally differs from feed intake level or nutrient density, which maximizes financial profits (VandeHaar and StPierre, Reference VandeHaar and St-Pierre2006). In the analysis presented in Figure 1, improvements were achieved without increasing the proportion of concentrates and wet by-products in the diet, while actually reducing N-fertilizer input. Thus, major gains in reduction of N in excreta in cattle production systems are possible through increased production levels and decreased dietary N contents.
Dietary nitrogen (N) concentration (g/kg DM) and N efficiency (g milk N/g feed N; left-hand side graph), and milk production (kg fat and protein corrected milk (FPCM)/cow per year) and feed intake (kg DM/cow per year; right-hand side graph) for the average dairy cow in The Netherlands from 1990 until 2011. Data from 1990 until 2008 as described in Bannink et al. (Reference Bannink, Van Schijndel and Dijkstra2011), with 2009 to 2011 results added according to the various sources and calculation procedures mentioned by Bannink et al. (Reference Bannink, Van Schijndel and Dijkstra2011).

Variation in urinary N output
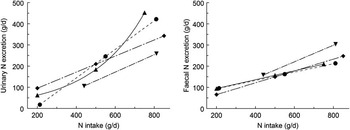
Upon an increase in dietary N intake, N output in excreta increases rapidly, particularly N in urine (Figure 2). Four extensive studies on N output in urine and faeces were selected to illustrate this. Castillo et al. (Reference Castillo, Kebreab, Beever and France2000) used data from 25 studies, but did not account for the effect of study, which may result in misinterpretation of the biological relationships. Huhtanen et al. (Reference Huhtanen, Nousiainen, Rinne, Kytölä and Khalili2008) and Kebreab et al. (Reference Kebreab, Strathe, Dijkstra, Mills, Reynolds, Crompton, Yan and France2010) applied mixed-model analysis with random study effect included. Weiss et al. (Reference Weiss, Willett, St-Pierre, Borger, McKelvey and Wyatt2009) evaluated N excretion using a central composite experimental design. In these studies, the slope of the linear relationship between N intake and faecal N varied between 0.20 and 0.39. With the exception of the study by Castillo et al. (Reference Castillo, Kebreab, Beever and France2000), the urine N excretion slope was higher and varied between 0.38 and 0.68 (Figure 2). Castillo et al. (Reference Castillo, Kebreab, Beever and France2000) reported an exponential relationship between N intake and urinary N. The higher increase in urinary N output compared with faecal N output with increasing N intake was apparent in all studies, except in the study by Weiss et al. (Reference Weiss, Willett, St-Pierre, Borger, McKelvey and Wyatt2009) where the slope for faecal N (0.39) did not differ from that of urine N (0.41). In this particular study, diets were equal in rumen degradable protein, whereas rumen undegradable protein content varied, which explains the similarity in slope values.
Relationship between N intake (NI; g/day) and N excretion in urine (UN; g/day; left-hand side graph) and N excretion in faeces (FN; g/day; right-hand side graph). ▴, Castillo et al. (Reference Castillo, Kebreab, Beever and France2000); UN = 30.4e0.0036NI; FN = 52.3 + 0.21NI. ●, Huhtanen et al. (Reference Huhtanen, Nousiainen, Rinne, Kytölä and Khalili2008); UN = −126 + 0.676NI; FN = 54 + 0.197NI. ▾, Weiss et al. (Reference Weiss, Willett, St-Pierre, Borger, McKelvey and Wyatt2009); UN = −75.0 + 0.412NI; FN = −13.8 + 0.392NI. ⧫, Kebreab et al. (Reference Kebreab, Strathe, Dijkstra, Mills, Reynolds, Crompton, Yan and France2010); UN = 20 + 0.38NI; FN = 10 + 0.28NI.

In contrast to predicted faecal N excretion, predicted urinary N output differed substantially between the four studies. Variation in urinary N excretion was 3.5 times greater than that of faecal N excretion (Weiss et al., Reference Weiss, Willett, St-Pierre, Borger, McKelvey and Wyatt2009). The residual standard deviations for faecal and urinary N excretion were 14.6 and 32.5 g/day, respectively (Kebreab et al., Reference Kebreab, Strathe, Dijkstra, Mills, Reynolds, Crompton, Yan and France2010). The much higher response and variation in urinary N output compared with faecal N excretion clearly presents an opportunity to manipulate diets to reduce N excretion in urine in particular. It is pertinent to note here that, although reduced dietary N concentration is a key mitigation strategy to decrease urinary N output in cattle, reduced dietary N levels may impair feed intake and production (Law et al., Reference Law, Young, Patterson, Kilpatrick, Wylie and Mayne2009; Brun-Lafleur et al., Reference Brun-Lafleur, Delaby, Husson and Faverdin2010). This lowered productivity may actually deteriorate the efficiency of conversion of feed into milk or meat.
Energy supply and urine N excretion
Urinary N originates from various sources including rumen losses, incorporation of dietary N into microbial nucleic acid N, animal maintenance requirements and losses related to inefficient conversion of absorbed amino acids (AAs) to milk protein (Tamminga, Reference Tamminga1992). Rumen N losses occur primarily because of an imbalance between degradation of N-containing substrates and use of available N by microbes, resulting in elevated rumen NH3 concentrations. A relatively large fraction (10% to 25%) of microbial N compounds is in the form of nucleic acids, mainly RNA (Fujihara and Shem, Reference Fujihara and Shem2011). Because nucleic acid utilization by the animal is low, the ruminal production of microbial nucleic acids can be considered as ruminal N loss. Key factors of N-use efficiency in the rumen include supply of fermentable carbohydrates and the modification of protein degradation rate (Dijkstra et al., Reference Dijkstra, Kebreab, Mills, Pellikaan, López, Bannink and France2007). Elevated microbial N capture in the rumen when more energy substrates are available for microbes may reduce net NH3 production and consequently urea excretion, but will increase urine losses of nucleic acid N synthesized as part of microbial biomass production (Tamminga, Reference Tamminga1992). Detrimental effects of large amounts of fermentable carbohydrates on ruminal pH and fibre degradation may occur (Firkins and Reynolds, Reference Firkins and Reynolds2005; Dijkstra et al., Reference Dijkstra, Ellis, Kebreab, Strathe, López, France and Bannink2012), reducing efficiency of conversion of feed into milk or meat. Therefore, diets should be balanced carefully. The significant recycling of N within the ruminant is another key issue in reducing N losses from the rumen. Between 0.04 and 0.73 of the digested N may return to the gut via the portal drained viscera (Lapierre et al., Reference Lapierre, Berthiaume, Raggio, Thivierge, Doepel, Pacheco, Dubreuil and Lobley2005). Urea transferred to the gastrointestinal tract can be utilized for microbial protein synthesis in ruminants fed low N, high-fermentable energy diets. However, when expressed in absolute amounts, the urea-N transport from blood to the gut is little affected by changes in dietary N concentration (Marini and Van Amburgh, Reference Marini and Van Amburgh2003).
Post-ruminally, there is considerable metabolism of absorbed AA in the portal-drained viscera and the liver. On average, 35% of AAs are lost during absorption and the liver removes some 45% of absorbed AAs (Lapierre et al., Reference Lapierre, Berthiaume, Raggio, Thivierge, Doepel, Pacheco, Dubreuil and Lobley2005), giving rise to significant amounts of urea excreted in urine. Among the major factors affecting the post-ruminal N efficiency is the amount of energy available (Doepel et al., Reference Doepel, Pacheco, Kennelly, Hanigan, López and Lapierre2004). Increasing the supply of energy substrates post-ruminally while maintaining protein supply improves the efficiency of utilization of AA for milk protein (Raggio et al., Reference Raggio, Lobley, Lemosquet, Rulquin and Lapierre2006), and thus reduces the output of N in urine. Indeed, Luo et al. (Reference Luo, Ledgard, De Klein, Lindsey and Kear2008) reported reduced manure N excretion and N2O emission per tonne milk produced upon maize silage (low N, high starch) supplementation in grass-based systems. However, in protein evaluation systems, protein requirement for milk production is usually calculated using fixed efficiency factors largely independent of energy supply, although in some systems protein requirements depend to a minor extent on net energy supply (e.g. Van Duinkerken et al., Reference Van Duinkerken, Blok, Bannink, Cone, Dijkstra, Van Vuuren and Tamminga2011). Similarly, current energy evaluation systems for cattle may not give accurate estimates of feeding value and milk production response (Dijkstra et al., Reference Dijkstra, Kebreab, Bannink, Crompton, López, Abrahamse, Chilibroste, Mills and France2008). Marginal N efficiencies in cattle are generally much lower than values applied in protein evaluation systems, giving rise to substantial higher N losses in urine than predicted by these systems (Cant et al., Reference Cant2005). Further opportunities to decrease N losses post-ruminally also arise from proper balancing of diets for individual AAs (Haque et al., Reference Haque, Rulquin, Andrade, Faverdin, Peyraud and Lemosquet2012).
Given the major impact of energy supply on microbial protein synthesis and on post-ruminal AA transfer efficiency into milk protein, a significant contribution of energy supply to the prediction accuracy of urinary N loss is expected. In multivariate analyses, prediction of urinary N output, but not faecal N output, improved when metabolizability (ratio of metabolizable energy (ME) to gross energy) or ME intake was added as co-variable to a model that already included N intake (Kebreab et al., Reference Kebreab, Strathe, Dijkstra, Mills, Reynolds, Crompton, Yan and France2010). The slopes were 0.56 g urine N/g diet N and −71.4 g urine N/MJ ME, indicating a reduced urinary N output when dietary ME concentration increases. Thus, when considering the effect of reducing N intake to reduce urinary N output, changes in energy supply have to be considered. In view of an integrated approach to reduce GHG emissions on farm, it should be noted that mitigation options aimed at reducing urinary N excretion may result in elevated methane (CH4) emission depending largely on the type of carbohydrate consumed (Ellis et al., Reference Ellis, Dijkstra, France, Parsons, Edwards, Rasmussen, Kebreab and Bannink2012). CH4 production declines if starch or digestible nutrients escaping rumen fermentation replace protein in the diet, but will rise if dietary fibre levels increase. Dijkstra et al. (Reference Dijkstra, Oenema and Bannink2011) estimated for various nutritional interventions with grass silage-based diets and increase of, on average, 0.30 g CH4/g urinary N decrease, but with large variation. Using standard emission factors for direct and indirect N2O emissions, the estimated N2O emission reduction (in CO2 equivalents) resulting from decreased manure N output was more than offset by a rise in enteric CH4 production (J. Dijkstra et al., unpublished).
Urine N composition
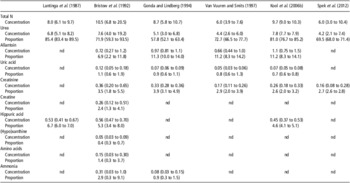
The N concentration of cattle urine is variable and ranges from 3.0 to 20.5 g/l (Table 1). The lowest urine N contents were observed in experiments where urine volume increased upon feeding extra NaCl (Van Vuuren and Smits, Reference Van Vuuren and Smits1997; Spek et al., Reference Spek, Bannink, Gort, Hendriks and Dijkstra2012).
Concentrations of N containing constituents in urine from dairy cattle

N = nitrogen; nd = not determined.
Mean values (range within brackets) expressed in g N/l urine (Lantinga et al., Reference Lantinga, Keuning, Groenwold and Deenen1987, four individual animals; Bristow et al., Reference Bristow, Whitehead and Cockburn1992, 10 individual animals; Gonda and Lindberg, Reference Gonda and Lindberg1994, treatment means with n = 3 per treatment; Kool et al., Reference Kool, Hoffland, Abrahamse and van Groenigen2006b, treatment means with n = 1 per treatment) or in g N/kg urine (Van Vuuren and Smits, Reference Van Vuuren and Smits1997, treatment means with n = 4 per treatment; Spek et al., Reference Spek, Bannink, Gort, Hendriks and Dijkstra2012, treatment means with n = 4 per treatment), and expressed in % of total N.
Urea in urine
Cattle urine contains a variety of nitrogenous constituents, but quantitative information on urinary N composition is limited. The dominant form of N in urine is urea. The urea-N concentration varied between 2.1 and 19.2 g/l, and represented from 52.1% to 93.5% of the total N (Table 1). Diets fed in excess of protein requirement generally result in high concentrations of urea in blood and urine, and urea-N as a fraction of total urinary N generally also increases with dietary protein supply. Urea is formed mainly in the liver as a means of detoxification of NH3 present in the systemic circulation. NH3 is produced by microorganisms in the rumen and hindgut, as well as by catabolism of AAs and other N-containing substrates in intermediary metabolism. In beef and dairy cattle, net urea-N release by the liver accounts for on average 0.65 of increments in N intake (Firkins and Reynolds, Reference Firkins and Reynolds2005). Lapierre et al. (Reference Lapierre, Berthiaume, Raggio, Thivierge, Doepel, Pacheco, Dubreuil and Lobley2005) reported that, largely dependent upon the interaction between N and energy supply, on average 0.47 (range 0.09 to 0.81) of hepatic ureagenesis returned to the gut via the portal drained viscera, the remainder being excreted mainly in urine.
Renal urea reabsorption and consequently urea concentration in urine is actively regulated by means of urea transporters. Urea excretion by the kidneys is not just controlled by the concentration of urea in plasma, but also by physiological status of the animal (reviewed by Spek et al., Reference Spek, Dijkstra, van Duinkerken and Bannink2013). Eriksson and Valtonen (Reference Eriksson and Valtonen1982) observed in goats fed low- or high-protein diets that the urinary N excretion with the low-protein diet was decreased by a combination of lowered plasma urea concentration, an increased fractional renal reabsorption rate of urea and a decreased glomerular filtration rate, as compared with the high-protein diet. Urea is an important osmolite in the renal reabsorption of water. A rise in urea reabsorption to increase renal osmotic pressure and water absorption from the renal filtrate will increase plasma urea levels and may explain the increased plasma urea levels in dehydrated cattle (Steiger Burgos et al., Reference Steiger Burgos, Senn, Sutter, Kreuzer and Langhans2001). The effects of increased mineral consumption and water intake on urinary N and urea content will be discussed in a subsequent section.
Non-urea components in urine
Various products from purine metabolism (purine derivatives (PD)) are present in urine, viz. allantoin, uric acid, xanthine and hypoxanthine. Purine bases absorbed from the gastrointestinal tract or from endogenous origin are deaminated into hypoxanthine and xanthine, which are largely converted to uric acid because of the high activity of xanthine oxidase in the intestine and liver in cattle (Tas and Susenbeth, Reference Tas and Susenbeth2007). Uric acid is partly oxidized to allantoin by uricase in the liver. As a result, of all PD, allantoin-N is present in highest amounts (0.27 to 1.5 g/l), followed by uric acid-N (0.03 to 0.18 g/l) and xanthine-N and hypoxanthine-N (together 0.03 to 0.09 g/l; Table 1). Urinary PD excretion has been used as a non-invasive method to estimate duodenal microbial N flow (Verbic et al., Reference Verbic, Chen, Macleod and Ørskov1990). The duodenal flow of nucleic acids and their derivatives is mainly of rumen microbial origin, and after absorption and intermediary metabolism are excreted in urine. Hence, improved rumen microbial efficiency increases PD concentration in urine. The level of fermentable organic matter (OM), in particular carbohydrates, is a major factor that determines microbial protein synthesis (van Duinkerken et al., Reference Van Duinkerken, Blok, Bannink, Cone, Dijkstra, Van Vuuren and Tamminga2011) and PD excretion.
In contrast to purines, pyrimidines undergo ring cleavage and the major end products of catabolism are β-AAs, NH3 and CO2. NH3 is present in urine in small amounts only and actually may arise from hydrolysis of urea during storage pending analyses (Bristow et al., Reference Bristow, Whitehead and Cockburn1992).
The creatinine-N and creatine-N concentrations in urine vary between 0.08 and 0.65 g/l and between 0.12 and 0.51 g/l, respectively. Creatine is synthesized from arginine, glycine and methionine primarily in the kidney and liver, and after uptake by muscle is reversibly phosphorylated into creatine-phosphate. Creatinine is produced by degradation of creatine and creatine-phosphate. As a product of muscle metabolism, creatinine excretion has been directly related to muscle mass and used as a urine volume marker, as diet composition has a relatively minor effect on creatinine excretion. However, there is considerable between-animal variation in creatinine excretion (Tas and Susenbeth, Reference Tas and Susenbeth2007).
Hippuric acid is an acyl glycine formed in the liver by the conjugation of benzoic acid with glycine. The principal dietary precursors of benzoic acid are phenolic compounds that yield 3-phenylpropionic acid on microbial fermentation in the rumen (Martin, Reference Martin1982). The urinary concentration of hippuric acid varies between 0.37 and 0.70 g N/l (Table 1). Data on dietary factors affecting hippuric acid concentration are rather scarce. Lantinga et al. (Reference Lantinga, Keuning, Groenwold and Deenen1987) showed considerable diurnal variation in hippuric acid concentrations in urine of grazing cows, with lowest proportions (fraction of total N) between 0600 and 1200 h, and highest between 1800 and 2400 h. Cow urine hippuric acid concentration was lower with low-CP diets compared with high-CP diets (Kreula et al., Reference Kreula, Rauramaa and Ettala1978). Upon increased maturity of grass, contents in grass of CP and aromatic acid precursors decreased and that of lignin increased, whereas the hippuric acid excretion in urine decreased (Martin, Reference Martin1970). The excretion of hippuric acid has also been suggested to provide an indication of lignin digestibility (Kehraus et al., Reference Kehraus, Südekum and Pfeffer2006). With advancing plant maturity, solubility and degradability of various plant phenolic compounds decrease, thus reducing the formation of 3-phenylpropionic acid in the rumen and excretion of hippuric acid in urine.
Urine volume
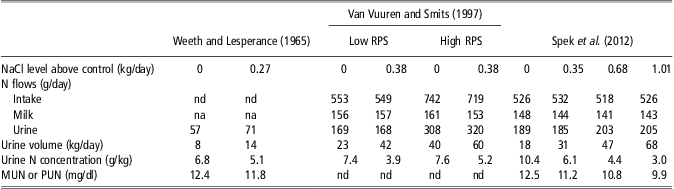
The volume of urine produced is a major determinant of urine N concentration, both in situations of water restriction and of increased water intake (review Spek et al., Reference Spek, Dijkstra, van Duinkerken and Bannink2013). This is shown in Table 1 for results in the studies by Van Vuuren and Smits (Reference Van Vuuren and Smits1997) and Spek et al. (Reference Spek, Bannink, Gort, Hendriks and Dijkstra2012). They added salt (NaCl) to the diet of dairy cattle to increase urine volume. Urine N concentration with control diets was well within the general range of N concentration, whereas NaCl addition reduced urinary N concentrations to as low as 3.0 g/kg. In cattle, the mineral load that needs to be excreted largely determines the volume of urine. Animals fed high-protein diets consume more water and excrete more urine (Van Vuuren and Smits, Reference Van Vuuren and Smits1997; Table 2). In addition to N, urine production is particularly affected by the intake of Na and K. For example, De Campeneere et al. (Reference De Campeneere, De Brabander and Vanacker2006) evaluated grass silage-based diets rich in Na and K and maize silage-based diets with much lower Na and K concentrations. Urine production with the grass silage diet was 2.4 times higher than the maize silage diet. Bannink et al. (Reference Bannink, Valk and Van Vuuren1999) derived equations on the basis of intake of Na, K and N that satisfactorily predicted urine production and may help to explain variation in concentration of nitrogenous constituents in urine.
Effect of NaCl intake on N intake and excretion of N in milk (dairy cattle only) and urine, and on urine volume, urine N concentration and MUN (dairy cattle) or PUN (heifers)
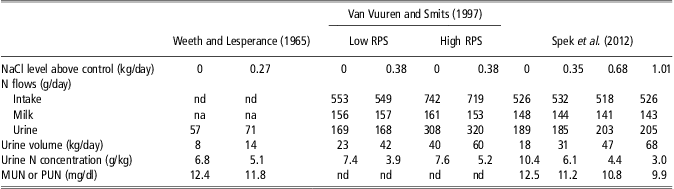
NaCl = salt; N = nitrogen; MUN = milk urea N; PUN = plasma urea N; RPS = rumen protein surplus (low, 0.1 kg RPS/day; high, 1.0 kg RPS/day); nd = not determined; na = not applicable.
Heifers: Weeth and Lesperance (Reference Weeth and Lesperance1965); lactating dairy cattle: Van Vuuren and Smits (Reference Van Vuuren and Smits1997) and Spek et al. (Reference Spek, Bannink, Gort, Hendriks and Dijkstra2012).
Similar to urine N, plasma and milk N concentrations vary with mineral and water intake. In view of the potential to use milk urea N (MUN) concentration as a marker for urinary N excretion (Ciszuk and Gebregziabher, Reference Ciszuk and Gebregziabher1994), the effect of mineral intake on these relationships is of particular interest. High MUN concentrations indicate poor efficiency of use of rumen degradable protein or metabolizable protein, whereas low concentrations can indicate limited amounts of dietary protein or high rates of intermediary efficiency. However, the results by Spek et al. (Reference Spek, Bannink, Gort, Hendriks and Dijkstra2012) indicate that the level of mineral intake should be taken into account when MUN is used as an indicator of urinary N excretion by dairy cows. With every increase of 100 g/day NaCl intake, MUN decreased significantly (0.27 mg/dl), whereas urea-N output in urine was not affected by NaCl intake level and total urinary N output slightly but significantly increased. This contrasts with the general adoption of a positive relationship between MUN concentration and urinary N excretion.
Urinary N as source of N2O emission
Consortia of autotrophic and heterotrophic bacteria utilize the energy and N contained in urine and faeces as substrate, thereby transforming the original compounds into various other compounds, including CO2, CH4, NH4+, NO3−, N2O and N2, in varying amounts. The minerals and OM in cattle excreta also have value as fertilizer and for soil amendment. During foraging, most cattle excreta are dropped in pastures and left in the field unmanaged. In some areas, faeces are collected and used by humans as building material or as fuel for cooking and heating. Excrements of cattle in confined conditions such as stables and feedlots are collected either as slurries, that is, a variable mixture of urine, faeces and soiled water, or as solid manure, that is, a variable mixture of faeces, urine, bedding material and feed residues. The composition of the excreta, their management and the local environmental conditions (soil type and wetness, temperature, rainfall) determine its fertilizer value but also the risk of N losses. Cattle excrements are a large source of NH3 and N2O emissions (e.g. Mosier et al., Reference Mosier, Kroeze, Nevison, Oenema, Seitzinger and van Cleemput1998; Oenema et al., Reference Oenema, Bannink, Sommer, van Groenigen and Velthof2008; Ussiri and Lal, Reference Ussiri and Lal2013). Here we review the effects of urine composition and environmental conditions on N2O emissions.
Emissions from urine in pastures
Urine patches from cattle on pastures represent substantial, highly localized additions of N of up to 1000 kg N/ha. Following its deposition, a sequence of transformations of urinary N occurs, that is, hydrolysis and mineralization of organically bound N into ammonium (NH4+), which may be nitrified to nitrite (NO2−) and NO3−, and then denitrified to N2O and N2. In the sequence of these processes, NH3 volatilization occurs from produced NH4+ during the first day(s) after excretion. The more NH3 is lost, the less NH4+ remains in the urine patch and the less nitrification takes place. Enclosure measurements of NH3 volatilization from single urine patches indicate that NH3 losses may range from 4% to 52% of the urine N, whereas field studies indicate that 3% to 15% of total excretal N is lost via NH3 volatilization, depending on the urinary N composition, soil type, moisture, temperature and wind speed (Oenema et al., Reference Oenema, Bannink, Sommer, van Groenigen and Velthof2008). Whitehead et al. (Reference Whitehead, Lockyer and Raistrick1989) showed that NH3 volatilization from the five major components of urine decreased in the order urea > allantoin > creatinine > creatine > hippuric acid. However, the NH3 volatilization from a mixture of hippuric acid and urea was higher than from urea only, particularly during the first 1 to 2 days after application to soil, and reflected a greater increase in soil pH than with urea only. NH3 volatilized from urine may be deposited again elsewhere and is considered an indirect source of N2O (de Klein et al., Reference De Klein, Eckard and van der Weerden2010).
N2O originates from nitrification, nitrifier denitrification and denitrification processes (Wrage et al., Reference Wrage, Velthof, van Beusichem and Oenema2001). Usually, it takes weeks before all NH4+ in urine patches has been converted into NO2− and NO3− or is taken up by the herbage, and N2O release may continue for weeks as well. The fraction of urine N released as N2O depends on the urinary N composition, soil type, wetness and temperature. Emissions are relatively low when the soil is dry or when the soil is very wet, and relatively high when the water-filled pore space (WFPS) in soil ranges from 60% to 80% (Figure 3). In these conditions, nitrification, nitrifier denitrification and denitrification processes occur most rapidly. In addition, the fraction of urinary N released as N2O is relatively low when soil temperature is low. Bertram et al. (Reference Bertram, Clough, Condron, Sherlock and O'Callaghan2010) observed that N2O emissions increased more than one order of magnitude when soil temperature increased from 5°C to 15°C. Because of the high variation in soil moisture and temperature, and because of their dominant effect on N2O emissions the fraction of urinary N released as N2O reported in literature varies more than one order of magnitude, that is, from <1% to more than 10%, with a median value of 1.3% (Van Groenigen et al., Reference Van Groenigen, Velthof, Van der Bolt, Vos and Kuikman2005).
Relationship between water-filled pore space (WFPS) and N2O emission. Error bars denote standard errors. Based on Van Groenigen et al. (Reference Van Groenigen, Velthof, Van der Bolt, Vos and Kuikman2005).

When urine volume is constant, total N content of the urine does not have a dominant effect on the fraction of N2O released (Van Groenigen et al., Reference Van Groenigen, Velthof, Van der Bolt, Vos and Kuikman2005). However, emissions may continue for a longer period when the N content is high, and hence may occur partly under different environmental conditions compared with emissions from urine patches with a relatively low total N content. Moreover, high N concentrations in the urine (>16 g N/l; this is within the range of values in Table 1) may, under normal circumstances, temporally inhibit nitrification because of NH3 toxicity (Monaghan and Barraclough, Reference Monaghan and Barraclough1992), which may temporally reduce N2O emissions. Higher urine volumes with equal amounts of N generally tend to decrease the fraction of N2O emitted. Increased urine volume without changes in N intake of cattle may be achieved by elevated dietary mineral contents (Table 2), provided there is an ample supply of drinking water. However, the effect of urine volume varied strongly with soil conditions. In dry soils, for example, the fraction emitted tends to increase with urine volume, probably because of the associated increase in WFPS (Van Groenigen et al., Reference Van Groenigen, Velthof, Van der Bolt, Vos and Kuikman2005). In addition, other aspects than urine volume determine N2O emission, such as increased soil compaction and the combined excretion of urine and dung that both strongly increase the fraction of N2O released (Van Groenigen et al., Reference Van Groenigen, Velthof, Van der Bolt, Vos and Kuikman2005).
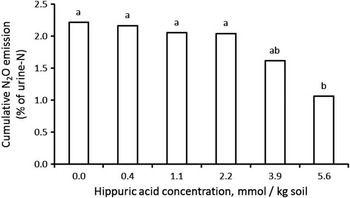
Urine composition will affect the fraction of N2O released. Kool et al. (Reference Kool, Hoffland, Abrahamse and van Groenigen2006b) showed that the composition of artificial urine must mimic the composition of ‘natural’ urine in order to be able to understand the effects of urine composition on N2O emissions. The ionic strength and especially the relative amounts of urea and hippuric acid in urine affect the availability of C and N substrates to the microbial community in soil and on its inhibition, again depending on WFPS and temperature as well. Hippuric acid, creatine and creatinine decompose more slowly in soil than urea, and thereby their contribution to urine N influences the availability of NH4+ from urine N over time. The ionic strength and pH influence the dissolution of organic C compounds in soils and faeces, which are substrates to microorganisms. Kool et al. (Reference Kool, Hoffland, Hummelink and van Groenigen2006a), Van Groenigen et al. (Reference Van Groenigen, Palermo, Kool and Kuikman2006) and Bertram et al. (Reference Bertram, Clough, Sherlock, Condron, O'Callaghan, Wells and Ray2009) observed that hippuric acid in cattle urine acts as a natural inhibitor of N2O emissions, likely through the temporal inhibition of nitrification and denitrification processes. Doubling or tripling the concentration of hippuric acid in urine roughly halved the emissions of N2O (Figure 4). The inhibitory effect of hippuric acid is caused by its breakdown product benzoic acid, which is a recognized antimicrobial agent. However, Clough et al. (Reference Clough, Ray, Bucktought, Calder, Baird, O'Callaghan, Sherlock and Condron2009) were unable to confirm the inhibitory effect of hippuric acid in situ. They speculated that the absence of an inhibitory effect of hippuric acid and benzoic acid in their study may have been because of (i) rapid decomposition of both hippuric acid and benzoic acid, (ii) a relatively low WFPS at the start of their experiment, (iii) leaching of hippuric acid and benzoic acid following a rainfall event and (iv) the dissociation of benzoic acid to benzoate at the relatively high soil pH. In contrast, the addition of dicyandiamide (DCD) did inhibit urine-derived N2O emissions (Clough et al., Reference Clough, Ray, Bucktought, Calder, Baird, O'Callaghan, Sherlock and Condron2009); DCD is a known artificial nitrification inhibitor and also known to decrease N2O emissions. Apparently, the inhibitory effect of hippuric acid and benzoic acid on N2O emissions occurs under specific conditions, which have not been defined properly yet.
Increasing hippuric acid concentrations in urine reduces N2O emissions because of partial inhibition of denitrification. Different characters denote a significant difference, based on an α of 0.05. The overall significance of the effect of hippuric acid was P < 0.01 (n = 6). Based on the study by Van Groenigen et al. (Reference Van Groenigen, Palermo, Kool and Kuikman2006).

Emissions from cattle excrements in storages
Confined cattle deposit faeces and urine on soil, litter, concrete floors or slatted floors in a small area. The collected faeces and urine will be stored for some time inside or outside the housing system until spreading on the field. The total storage period of slurries and manure may range from a day to more than 9 months. Because of the differences in housing systems, manure management and storage period, there can be large differences in N2O emissions from manure in animal housing. However, relatively few measurements have been carried out (e.g. Mosier et al., Reference Mosier, Kroeze, Nevison, Oenema, Seitzinger and van Cleemput1998), and its importance seems to be neglected sometimes (e.g. Ussiri and Lal, Reference Ussiri and Lal2013). Slurry and liquids stored in pits and canals underneath slatted floors and in open tanks, silos and lagoons is not a significant source of N2O, mainly because very little NH4+ is nitrified in the highly anoxic environment. In the surface crust developed under drying conditions during longer-term storage, a mosaic of anaerobic and aerobic sites may emerge, thereby creating an environment where N2O can be produced.
In feedlots and deep litter housing systems, cattle walk freely around and foul the litter in the surface layer with fresh urine and faeces. Depending on the type and amount of litter added, oxygen diffuses into the porous surface layer, and fermentation processes increase the temperature and induce an upward current of air containing NH3, N2O and N2 (Rom and Henriksen, Reference Rom and Henriksen2000). The N2O is likely to be formed at the interface of oxidized and reduced conditions, where nitrification and denitrification processes may occur side by side. Extremely high N2O emissions of 10% and more for deep litter systems have been reported (Oenema et al., Reference Oenema, Bannink, Sommer, van Groenigen and Velthof2008). However, data on N2O fluxes in deep litter systems are rare, and we are not aware of any study examining the effect of urine composition on N2O emissions from these systems. We speculate that the possible inhibitory effect of hippuric acid on N2O emissions is small because of the relatively high pH (range 6.5 to 8.0) of the dung, which would make benzoic acid ineffective as a microbial inhibitor and also biodegradable (Clough et al., Reference Clough, Ray, Bucktought, Calder, Baird, O'Callaghan, Sherlock and Condron2009).
Manure heaps are also a source of N2O. When fresh manure is added daily on top of a heap, there is a constant source of fresh urea, but there is little opportunity for nitrifiers to develop in the anaerobic environment. In contrast, when fresh manure is added via intrusion from the bottom, surface layers become partly aerobic, making these heaps conducive to N2O production. Reported emissions are in the range of 0.1% to 0.5% of the N in the manure, but these estimates are based on few measurements (Oenema et al., Reference Oenema, Bannink, Sommer, van Groenigen and Velthof2008). NH3 volatilized from stored manure and following application to land is a significant source of indirect N2O (de Klein et al., Reference De Klein, Eckard and van der Weerden2010), especially in the absence of low-emission manure storage and application techniques.
Emissions from manures applied to soils
Animal manure applied to soil is a major source of N2O (Mosier et al., Reference Mosier, Kroeze, Nevison, Oenema, Seitzinger and van Cleemput1998). Emissions depend on the composition of the manures, soil type, temperature and wetness, and vary widely (Velthof et al., Reference Velthof, Kuikman and Oenema2003). In general, emissions are proportional to the N content of the manures, but the fraction of N2O released from applied manure (mean range 0.3% to 0.8%) is less than the fraction released from applied mineral N fertilizer (0.5% to 1.5%). On the basis of a literature review, Lesschen et al. (Reference Lesschen, Velthof, de Vries and Kros2011) derived a relative emission factor of poultry manure, solid cattle manure, solid pig manure, cattle slurry and pig slurry at 1 : 1 : 1 : 2 : 3. Hence, emissions are less from solid manure than from slurry, probably because of the different ratios of inorganic N v. organic N. In practice, large variation in DM content of slurries occurs, partly because of variation in diet composition and in cleaning and rain water; however, to our knowledge no information about the effect of DM content on N2O emissions is available. We speculate that the effect of the relative proportion of various nitrogenous compounds in urine on N2O emissions from manures is small because most (range 50% to 100%, depending on storage conditions and time) of the initial compounds will have been transformed already into NH4+ when applied to soil. Apart from manure characteristics, particularly soil conditions and manure handling have a major effect on N2O emissions. Emissions tend to be higher on arable land than on grassland, with injection or incorporation into the soil compared with surface application, and they are higher on peat and clay soils than on sand soils (Lesschen et al., Reference Lesschen, Velthof, de Vries and Kros2011).
Conclusions
Reducing N output in urine from cattle is critical to reducing N2O emissions and achieving environmentally sustainable production. Large variation in urinary N excretion compared with N excretion in faeces presents an opportunity to manipulate diets to reduce urinary N excretion. Reduction in dietary N content, and better matching for dietary N and energy availability, is feasible for mitigating urinary N losses. However, current protein evaluation systems are unable to predict marginal urinary N output in response to changes in diet composition. Urine volume and consequently urine N concentration is largely determined by dietary mineral content. Increasing urine volume appears a promising N2O mitigation strategy particularly in pasture. Various urinary N constituents differ widely in their effects on N2O release. Further development of effective mitigation strategies requires an integrated research approach. In such an approach, nutritional experiments giving rise to variation in urine and manure composition of cattle, should be integrated with determination of subsequent N2O emissions from urine and manure during storage and after deposition and application on soil.
Acknowledgements
This work is partially funded by the Commission of the European Communities (Rednex project FP7-KBBE-2007-1 and AnimalChange project FP7-KBBE-2010-4).
This paper was published as part of a supplement to animal, publication of which was supported by the Greenhouse Gases & Animal Agriculture Conference 2013. The papers included in this supplement were invited by the Guest Editors and have undergone the standard journal formal review process. They may be cited. The Guest Editors appointed to this supplement are R. J. Dewhurst, D. R. Chadwick, E. Charmley, N. M. Holden, D. A. Kenny, G. Lanigan, D. Moran, C. J. Newbold, P. O'Kiely, and T. Yan. The Guest Editors declare no conflict of interest.