1. Introduction
The (one-dimensional) homogeneous Poisson process can be defined as a renewal process by specifying the distribution of the waiting times Ji to be i.i.d. and to follow an exponential distribution with parameter λ. The sequence of associated arrival times
 \begin{equation*}T_n = \sum_{i=1}^n J_i, \,\, n \in \mathbb{N},\, T_0=0,\end{equation*}
gives a renewal process and its corresponding counting process
 \begin{equation*}N(t) = \sup\{n \,{:}\, T_n \leq t\} = \sum_{n=0}^{\infty}n {\bf 1}_{\{T_n \leq t < T_{n+1}\}}\end{equation*}
is the Poisson process with parameter λ > 0. Alternatively, N(t) can be defined as a Lévy process with Poisson distributed increments. Among other approaches, both of these representations have been used in order to introduce a fractional homogenous Poisson process (FHPP). As a renewal process, the waiting times are chosen to be i.i.d. Mittag-Leffler distributed instead of exponentially distributed, i.e.
 \begin{equation}\mathbb{P}(J_1 \leq t) = 1 - E_\alpha(-(\lambda t)^\alpha), \qquad t \geq 0 \end{equation}
where Eα(z) is the one-parameter Mittag-Leffler function defined as
 \begin{equation*}E_\alpha (z) = \sum_{n=0}^\infty \frac{z^n}{\Gamma(\alpha n + 1)}, \quad z \in \mathbb{C}, \alpha \in [0,1).\end{equation*}
The Mittag-Leffler distribution was first considered in [Reference Gnedenko, Kovalenko and Kondor26] and [Reference Khintchine32]. A comprehensive treatment of the FHPP as a renewal process can be found in [Reference Mainardi, Gorenflo and Scalas39] and [Reference Politi, Kaizoji and Scalas44].
Starting from the standard Poisson process N(t) as a point process, the FHPP can also be defined as N(t) time-changed by the inverse α-stable subordinator. Meerschaert et al. [Reference Meerschaert, Nane and Vellaisamy40] showed that both the renewal and the time-change approach yield the same stochastic process (in the sense that both processes have the same finite-dimensional distributions). Laskin [Reference Laskin35] and Beghin and Orsingher [Reference Beghin and Orsingher4], [Reference Beghin and Orsingher5] derived the governing equations associated with the one-dimensional distribution of the FHPP.
In [Reference Leonenko, Scalas and Trinh37], we introduced the fractional nonhomogeneous Poisson process (FNPP) as a generalization of the FHPP. The nonhomogeneous Poisson process is an additive process with deterministic, time-dependent intensity function and thus generally does not allow a representation as a classical renewal process. However, following the construction in [Reference Gergely and Yezhow23], [Reference Gergely and Yezhow24] we can define the FNPP as a general renewal process. This is done in the next Section 2. Following the time-change approach, the FNPP is defined as a nonhomogeneous Poisson process time-changed by the inverse α-stable subordinator.
Among other results, we have discussed in our previous work that the FHPP can be seen as a Cox process. Following up on this observation, in this article, we will show that, more generally, the FNPP can be treated as a Cox process discussing the required choice of filtration. Cox processes or doubly stochastic processes [Reference Cox15], [Reference Kingman33] are relevant for various applications such as filtering theory [Reference Brémaud10], repeat-buy consumer behavior [Reference Ehrenberg19], credit risk theory [Reference Bielecki and Rutkowski8] or actuarial risk theory [Reference Grandell28] and, in particular, ruin theory [Reference Biard and Saussereau6], [Reference Biard and Saussereau7]. Moreover, the fractional Poisson process has been recently applied to queueing theory in [Reference Cahoy, Polito and Phoha11]. Subsequently, using the Cox process theory we are able to identify the compensator of the FNPP. A similar generalization of the original Watanabe characterization [Reference Watanabe50] of the Poisson process can be found in case of the FHPP in [Reference Aletti, Leonenko and Merzbach1].
Limit theorems for Cox processes have been studied by [Reference Grandell27] and [Reference Serfozo48], [Reference Serfozo49]. Specifically for the FHPP, long-range dependence has been discussed in [Reference Maheshwari and Vellaisamy38], scaling limits have been derived in [Reference Meerschaert and Scheffler41] and discussed in the context of parameter estimation in [Reference Cahoy, Uchaikin and Woyczynski12].
The rest of the article is structured as follows: In Section 2 we give a short overview of definitions and notation concerning the fractional Poisson process. Section 3 is devoted to the application of the Cox process theory to the fractional Poisson process which allows us to identify its compensator and thus derive limit theorems via martingale methods. A different approach to deriving asymptotics is followed in Section 4 and requires a regular variation condition imposed on the rate function of the Poisson process before time change. The fractional compound Poisson process is discussed in Section 5, where we derive both a one-dimensional limit theorem using Anscombe’s theorem and a functional limit. Finally, we give a brief discussion of simulation methods for the FHPP and corroborate some of our theoretical results using a Monte Carlo experiment.
2. The fractional Poisson process
This section serves as a brief revision of the fractional Poisson process, both in the homogeneous and the nonhomogeneous case as well as a setup of notation.
Let (N 1(t))t≥0 be a standard Poisson process with parameter 1. Define the function
 \begin{equation*}\Lambda(s,t) \,{:\!=}\, \int_s^t \lambda(\tau) \,\sd \tau,\end{equation*}
where s, t ≥ 0 and λ : [0, ∞) → (0, ∞) is locally integrable. For shorthand Λ(t) := Λ(0, t) and we assume Λ(t) → ∞ for t → ∞. We get a nonhomogeneous Poisson process (N(t))t≥0, by a time-transformation of the homogeneous Poisson process with Λ:
 \begin{equation*}N(t) \,{:\!=}\, N_1(\Lambda(t)).\end{equation*}
The α-stable subordinator is a Lévy process (Lα(t))t≥0 defined via the Laplace transform
 \begin{equation*}\mathbb{E}[\!\exp(-uL_\alpha(t))] = \exp(-tu^\alpha), \,\, u > 0.\end{equation*}
The inverse α-stable subordinator (Yα(t))t≥0 (see e.g. [Reference Bingham9]) is defined by
 \begin{equation*}Y_\alpha(t) \coloneqq \inf\{ v \geq 0: L_\alpha(v) > t\}.\end{equation*}
We assume (Yα(t))t≥0 to be independent of (N(t))t≥0. For α ∈ (0, 1), the fractional nonhomogeneous Poisson process (FNPP) (Nα(t))t≥0 is defined as
 \begin{equation}N_\alpha(t) \coloneqq N(Y_\alpha(t)) = N_1(\Lambda(Y_\alpha(t)))\end{equation}
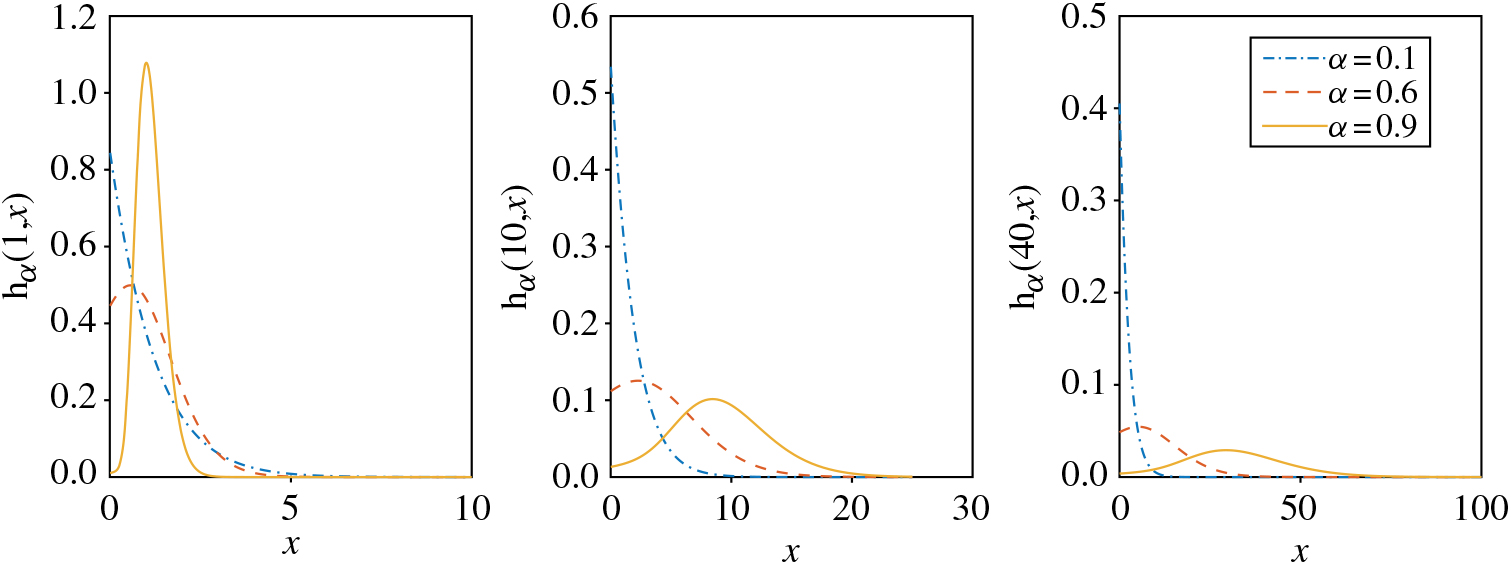
(see [Reference Leonenko, Scalas and Trinh37]). Note that the fractional homogeneous Poisson process (FHPP) is a special case of the nonhomogeneous Poisson process with Λ(t) = λt, where λ(t) ≡ λ > 0 a constant. Recall that the density hα(t, ·) of Yα(t) can be expressed as (see e.g. [Reference Leonenko and Merzbach36], [Reference Meerschaert and Straka43])
 \begin{equation}h_\alpha(t,x) = \frac{t}{\alpha x^{1+1/\alpha}} g_\alpha\Bigg( \frac{t}{x^{1/\alpha}}\Bigg), \quad x\geq 0, t\geq 0,\end{equation}
where gα(z) is the density of Lα(1) given by
 \begin{align}g_\alpha(z) &= \frac{1}{\pi} \sum_{k=1}^{\infty}(-1)^{k+1}\frac{\Gamma(\alpha k+1)}{k!} \frac{1}{z^{\alpha k +1}} \sin(\pi k \alpha)\nonumber%\\ %&=\frac{1}{z}W_{-\alpha,0}\left(-\frac{1}{z^\alpha}\right), z>0.\nonumber \end{align}
The Laplace transform of hα can be given in terms of the Mittag-Leffler function
 \begin{equation}\tilde{h}_\alpha(t,y) = \int_0^\infty \e^{-xy} h_\alpha(t, x) \, \sd x = E_\alpha(-y t^\alpha), \,\, y > 0,\end{equation}
and for the FNPP the one-dimensional marginal distribution is given by
 \begin{equation*}\mathbb{P}(N_\alpha(t) = k) = \int_0^\infty \e^{-\Lambda(u)} \frac{\Lambda(u)^k}{k!} h_\alpha(t,u) \,\sd u, \; k=0,1,2,\dots.\end{equation*}
Alternatively, we can construct a nonhomogeneous Poisson process as follows (see [Reference Gergely and Yezhow23]). Let ξ 1, ξ 2, … be a sequence of independent non-negative random variables with identical continuous distribution function
 \begin{equation*}F(t) = \mathbb{P}(\xi_1 \leq t) = 1 - \exp(-\Lambda(t)), t \geq 0.\end{equation*}
Define
 \begin{equation*}\zeta'_n \coloneqq \max\{\xi_1, \ldots, \xi_n\}, \quad n=1,2, \ldots\end{equation*}
and
 \begin{equation*}\varkappa_n = \inf\{k \in \mathbb{N}: \zeta'_k > \zeta'_{\varkappa_{n-1}}\}, \quad n = 2, 3, \ldots\end{equation*}
with ϰ 1 = 1. Then, let  $\zeta_n \coloneqq \zeta'_{\varkappa_n}$. The resulting sequence ζ 1, ζ 2, … is strictly increasing, since it is obtained from the non-decreasing sequence
 $\zeta'_1, \zeta'_2, \ldots$ by omitting all repeating elements. Now, we define
 \begin{align*}N(t) &\coloneqq \sup\{k \in \mathbb{N}\colon\!\zeta_k \leq t\}= \sum_{n=0}^\infty n {\bf 1}_{\{ \zeta_n \leq t < \zeta_{n+1}\}}, \quad t \geq 0 \end{align*}
where ζ 0 = 0. By Theorem 1 in [Reference Gergely and Yezhow23], we have that (N(t))t≥0 is a nonhomogeneous Poisson process with independent increments and
 \begin{equation*}\mathbb{P}(N(t) = k) = \exp(-\Lambda(t)) \frac{\Lambda(t)^k}{k!}, \quad k = 0, 1, 2, \ldots.\end{equation*}
It follows via the time-change approach that the FNPP can be written as
 \begin{align*}N_\alpha(t) = \sum_{n=0}^\infty n {\bf 1}_{\{\zeta_n \leq Y_\alpha(t) < \zeta_{n+1}\}} \stackrel{\text{a.s.}}{=}\sum_{n=0}^\infty n {\bf 1}_{\{L_\alpha(\zeta_n) \leq t < L_\alpha(\zeta_{n+1})\}},\end{align*}
where we have used that Lα(Yα(t)) = t if and only if t is not a jump time of Lα (see [Reference Embrechts and Hofert20]).
3. Martingale methods for the FNPP
Cox processes go back to [Reference Cox15] who proposed to replace the deterministic intensity of a Poisson process by a random one. In this section, we discuss the connection between FNPP and Cox processes. Cox processes are also known as conditional Poisson processes.
Definition 1. Let  $(\Omega, \mathcal{F}, \mathbb{P})$ be a probability space and (N(t))t≥0 be a point process adapted to a filtration
 $(\mathcal{F}^N_t)_{t\geq 0}$. (N(t))t≥0 is a Cox process if there exist a right-continuous, increasing process (A(t))t≥0 such that for any 0 < s < t
 \begin{equation*}\mathbb{P}(N(t)-N(s) = k \vert \mathcal{F}_t) = \e^{-(A(t)-A(s))} \frac{(A(t)-A(s))^k}{k!}, \qquad k = 0,1,2, \ldots,\end{equation*}
where
 \begin{equation}\mathcal{F}_t \coloneqq \mathcal{F}_0 \vee \mathcal{F}^N_t, \quad \mathcal{F}_0 = \sigma(A(t), t\geq 0).\end{equation}
Then the Cox process N is said to be directed by A.
In particular we have by definition  $\mathbb{E}[N(t) \vert \mathcal{F}_t] = A(t)$.
Since FHPP is also a renewal process, it can be shown that it is also a Cox process by using the Laplace transform of the waiting time distributions (see Section 2 in [Reference Leonenko, Scalas and Trinh37]). However, in the nonhomogeneous case, we cannot apply the theorems which characterize Cox renewal processes as the FNPP cannot be represented as a classical renewal process. We will follow the construction of doubly stochastic processes given in Section 6.6 in [Reference Bielecki and Rutkowski8] and verify Definition 1. Let  $(\mathcal{F}_t^{N_\alpha})_{t\geq 0}$ be the natural filtration of the FNPP (Nα(t))t≥0
 \begin{equation*}\mathcal{F}_t^{N_\alpha} \coloneqq \sigma(\{N_\alpha(s): s \leq t\})\end{equation*}
and define
 \begin{equation}\mathcal{F}_0 \coloneqq \sigma(\{Y_\alpha(t), t\geq 0\}).\end{equation}
We refer to this choice of initial σ-algebra  $\mathcal{F}_0$ as non-trivial initial history as opposed to the case of trivial initial history, which is
 $\mathcal{F}_0 = \{\varnothing, \Omega\}$. The overall filtration
 $(\mathcal{F}_t)_{t\geq 0}$ is then given by
 \begin{equation}\mathcal{F}_t \coloneqq \mathcal{F}_0 \vee \mathcal{F}_t^{N_\alpha},\end{equation}
which is sometimes referred to as intrinsic history. If we choose a trivial initial history, the intrinsic history will coincide with the natural filtration of the FNPP.
Proposition 1. Let the FNPP be adapted to the filtration  $(\mathcal{F}_t)$ as in (7) with non-trivial initial history
 $\mathcal{F}_0 \coloneqq \sigma(\{Y_\alpha(t), t\geq 0\})$. Then the FNPP is an
 $(\mathcal{F}_t)$-Cox process directed by (Λ(Yα(t)))t≥0.
Proof. This follows from Proposition 6.6.7. on p. 195 in [Reference Bielecki and Rutkowski8]. We give a similar proof for completeness: As (Yα(t))t≥0 is  $\mathcal{F}_0$-measurable we have
 \begin{align}
\mathbb{E}[\!\exp&\{\ci u(N_\alpha(t) - N_\alpha(s))\} \vert \mathcal{F}_s] \nonumber\\
&= \mathbb{E}[\!\exp\{\ci u(N_\alpha(t) - N_\alpha(s))\} \vert \mathcal{F}_0 \vee \mathcal{F}_s^{N_\alpha}]\nonumber\\
&= \mathbb{E}[\!\exp\{\ci u(N_1(\Lambda(Y_\alpha(t))) - N_1(\Lambda(Y_\alpha(s))))\}\vert \mathcal{F}_0 \vee \mathcal{F}_{\Lambda(Y_\alpha(s))}^{N_1}]
\end{align}
 \begin{align}
&= \mathbb{E}[\!\exp\{\ci u(N_1(\Lambda(Y_\alpha(t))) - N_1(\Lambda(Y_\alpha(s))))\}\vert \mathcal{F}_0] \label{eq:26}\\
&= \exp[\Lambda(Y_\alpha(s), Y_\alpha(t))(e^{\ci u} - 1)],\nonumber
\end{align}
where in (8) we used the time-change theorem (see for example Thm. 7.4.I. p. 258 in [Reference Daley and Vere-jones17]) and in (9) the fact that the standard Poisson process has independent increments. This means, conditional on  $(\mathcal{F}_t)_{t\geq 0}$, (Nα(t)) has independent increments and
 \begin{equation*}(N_\alpha(t) - N_\alpha(s)) \vert \mathcal{F}_s \sim \text{Poi}(\Lambda(Y_\alpha(s), Y_\alpha(t)))\stackrel{d}{=}\text{Poi}(\Lambda(Y_\alpha(t)) - \Lambda(Y_\alpha(s))).\end{equation*}
Thus, (N(Yα(t))) is a Cox process directed by Λ(Yα(t)) by definition.
The identification of the FNPP as a Cox process in the previous section allows us to determine its compensator. In fact, the compensator of a Cox process coincides with its directing process. From Lemma 6.6.3. p.194 in [Reference Bielecki and Rutkowski8] we have the result
Proposition 2. Let the FNPP be adapted to the filtration  $(\mathcal{F}_t)$ as in (7) with non-trivial initial history
 $\mathcal{F}_0 \coloneqq \sigma(\{Y_\alpha(t), t\geq 0\})$. Assume
 $\mathbb{E}[\Lambda(Y_\alpha(t))] < \infty$ for t ≥ 0. Then the FNPP has
 $\mathcal{F}_t$-compensator (A(t))t≥0, where A(t) := Λ(Yα(t)), i.e. the stochastic process (M(t))t≥0 defined by M(t) := N(Yα(t)) − Λ(Yα(t)) is an
 $\mathcal{F}_t$-martingale.
3.1. A central limit theorem
Using the compensator of the FNPP, we can apply martingale methods in order to derive limit theorems for the FNPP. For the sake of completeness, we restate the definition of  $\mathcal{F}_0$-stable convergence along with a lemma which will be used later.
Definition 2. If (Xn)n∈ℕ and X are ℝ-valued random variables on a probability space (Ω, ɛ, ℙ) and  $\mathcal{F}$ is a sub-σ-algebra of ɛ, then Xn → X (
 $\mathcal{F}$-stably) in distribution if for all
 $B\in \mathcal{F}$ and all
 $A\in \mathcal{B}(\mathbb{R})$ with ℙ(X ∈ ∂A) = 0,
 \begin{equation*}\mathbb{P}(\{X_n \in A\} \cap B) \xrightarrow[n \to \infty]{} \mathbb{P}(\{X \in A\} \cap B)\end{equation*}
(see Definition A.3.2.III. in [Reference Daley and Vere-jones17]).
Note that  $\mathcal{F}$-stable convergence implies weak convergence/convergence in distribution. We can derive a central limit theorem for the FNPP using Corollary 14.5.III. in [Reference Daley and Vere-jones17] which we state here as a lemma for convenience.
Lemma 1. Let N be a simple point process on ℝ+,  $(\mathcal{F}_t)_{t\geq 0}$-adapted and with continuous
 $(\mathcal{F}_t)_{t\geq 0}$-compensator A. Suppose for each T > 0 an
 $(\mathcal{F}_t)_{t\geq 0}$-predictable process fT(t) is given such that
 \begin{equation*}B_T^2 = \int_0^T [\,f_T(u)]^2 \sd A(u) > 0.\end{equation*}
and define
 \begin{equation*}X_T \coloneqq \int_0^T f_T(u) [\rd N(u) - \rd A(u)].\end{equation*}
Then the randomly normed integrals XT/BT converge  $\mathcal{F}_0$-stably to a standard normal variable W ~ N(0, 1) for T → ∞.
The above lemma allows us to show the following result for the FNPP.
Proposition 3. Let (N(Yα(t)))t≥0 be the FNPP adapted to the filtration  $(\mathcal{F}_t)_{t\geq 0}$ as defined in Section 3. Then,
 \begin{equation}\frac{N(Y_\alpha(T)) - \Lambda(Y_\alpha(T))}{\sqrt{\Lambda(Y_\alpha(T))}} \xrightarrow[T \to \infty]{} W \sim N(0,1) \qquad \mathcal{F}_0\text{-stably}.\end{equation}
Proof. First note that the compensator A(t) := Λ (Yα(t)) is continuous in t. Let fT(u) ≡ 1, then
 \begin{align*}B_T^2 &= \int_0^T [\,f_T(u)]^2 \sd A(u) = \Lambda(Y_\alpha(T)) > 0, \: \forall T > 0 \end{align*}
and
 \begin{align*}X_T &\coloneqq \int_0^T f_T(u) [\rd N(Y_\alpha(u)) - \rd A(u)] = [N(Y_\alpha(T)) - \Lambda(Y_\alpha(T))].\end{align*}
It follows from Lemma 1 above that
 \begin{align*}\hspace*{50pt} \frac{X_T}{B_T} &= \frac{N(Y_\alpha(T)) - \Lambda(Y_\alpha(T))}{\sqrt{\Lambda(Y_\alpha(T))}} \xrightarrow[T\to \infty]{} W \sim N(0,1) \qquad \mathcal{F}_0\text{-stably}.\hspace*{50pt}\aptqed\end{align*}
3.2. Limit α → 1
In Section 3.2(ii) in [Reference Leonenko, Scalas and Trinh37], in the context of the governing equations for the FNPP, we have argued that for α = 1 the FNPP simplifies to the non-fractional nonhomogeneous Poisson process. In the following, we can show that under certain conditions we have convergence of Nα → N for α → 1. Concerning the type of convergence, we consider the Skorokhod space  $\mathcal{D}([0,\infty))$ endowed with a suitable topology (we will focus on the J 1 and M 1 topologies). For more details see [Reference Meerschaert and Sikorskii42].
Proposition 4. Let (Nα(t))t≥0 be the FNPP as defined in (2). Let the FNPP be adapted to the filtration  $(\mathcal{F}_t)$ as in (7) with non-trivial initial history
 $\mathcal{F}_0 \,{:\!=}\, \sigma(\{Y_\alpha(t), t\geq 0\})$. Then, we have the limit
 \begin{equation*}N_\alpha \xrightarrow[\alpha \to 1]{J_1} N \quad \text{ in } \quad D([0, \infty)).\end{equation*}
Proof. By Proposition 2 we see that (Λ(Yα(t)))t≥0 is the compensator of (Nα(t))t≥0. According to Theorem VIII.3.36 on p. 479 in [Reference Jacod and Shiryaev31] if suffices to show the following convergence in probability
 \begin{equation*}\Lambda(Y_\alpha(t)) \xrightarrow[\alpha \rightarrow 1]{\mathcal{P}}\Lambda(t) \qquad \text{for\ all}\ t \in \mathbb{R}_{+}.\end{equation*}
We can check that the Laplace transform of the density of the inverse α-stable subordinator converges to the Laplace transform of the delta distribution:
 \begin{equation}
\mathcal{L}\{h_\alpha(\cdot,y)\}(s,y) = E_\alpha(-ys^\alpha) \xrightarrow[]{\alpha \rightarrow 1} \e^{-ys} = \mathcal{L}\{\delta_0(\cdot-y)\}(s,y).
\end{equation}
We may take the limit as the power series representation of the (entire) Mittag-Leffler function is absolutely convergent. Thus (11) implies the following convergence in distribution
 \begin{equation*}Y_\alpha(t) \xrightarrow[\alpha \rightarrow 1]{d} t \qquad \text{for\ all}\ t \in \mathbb{R}_{+}.\end{equation*}
As convergence in distribution to a constant automatically improves to convergence in probability, we have
 \begin{equation*}
Y_\alpha(t) \xrightarrow[\alpha \rightarrow 1]{\mathcal{P}} t \qquad \text{for\ all}\ t \in \mathbb{R}_{+}.
\end{equation*}
By the continuous mapping theorem, it follows that
 \begin{equation*}\Lambda(Y_\alpha(t)) \xrightarrow[\alpha \rightarrow 1]{\mathcal{P}} \Lambda(t) \qquad \text{for\ all}\ t \in \mathbb{R}_{+},\end{equation*}
which concludes the proof.
4. Regular variation and scaling limits
In this section, we will work with the trivial initial filtration setting ( $\mathcal{F}_0 = \{\varnothing, \Omega\}$), i.e.
 $\mathcal{F}_t$ is assumed to be the natural filtration of the FNPP. We follow the approach of results given in [Reference Grandell27], [Reference Serfozo48], [Reference Serfozo49], which require conditions on the function Λ. Recall that a function is Λ regularly varying with index β ∈ ℝ if
 \begin{equation}\frac{\Lambda(xt)}{\Lambda(t)} \xrightarrow[t \rightarrow \infty]{} x^\beta \qquad \text{for\ all}\ x > 0.\end{equation}
Example 1. We check whether typical rate functions (taken from Remark 2 in [Reference Leonenko, Scalas and Trinh37]) fulfill the regular variation condition.
(i) Weibull’s rate function
is regulary varying with index c. This can be seen as follows \begin{equation*}\Lambda(t)=\Big( \frac{t}{b}\Big)^c, \quad \lambda(t) = \frac{c}{b}\Big( \frac{t}{b}\Big)^{c-1},\quad c\geq 0,\, b > 0\end{equation*}
\begin{equation*}\frac{\Lambda(xt)}{\Lambda(t)} = \frac{(xt)^c}{t^c} = x^c, \quad \forall x > 0.\end{equation*}
(ii) Makeham’s rate function
is not regulary varying, since\begin{equation*}\Lambda(t) = \frac{c}{b}\e^{bt}-\frac{c}{b} + \mu t, \quad \lambda(t) = c\e^{bt}+\mu, \quad c>0,\, b>0,\, \mu\geq 0\end{equation*}
does not fulfill (12).\begin{align*}
\frac{\Lambda(xt)}{\Lambda(t)} &= \frac{(c/b)\e^{bxt} - (c/b) + \mu xt}{(c/b) \e^{bt} - (c/b) + \mu t}
= \frac{(c/b)\e^{bt(x-1)} - (c/b)\e^{-bt} + \mu xt\e^{-bt}}{(c/b) - (c/b)\e^{-bt} + \mu t\e^{-bt}}\\[3pt]
&\xrightarrow[]{t\to \infty}\left\{
\begin{array}{ll}
0 & \text{ if } x < 1\\
1 & \text{ if } x=1\\
+\infty & \text{ if } x > 1
\end{array}
\end{align*}


In the following, the condition that Λ is regularly varying is useful for proving limit results. We will first discuss a one-dimensional limit theorem before moving on to its functional analogue.
4.1. A one-dimensional limit theorem
Proposition 5. Let the FNPP (Nα(t))t≥0 be defined as in Equation (2). Suppose the function t ↦ Λ (t) is regularly varying with index β ∈ ℝ Then the following limit holds for the FNPP:
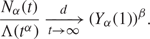 \begin{equation}\frac{N_\alpha(t)}{\Lambda(t^\alpha)} \xrightarrow[t \rightarrow \infty]{d} (Y_\alpha(1))^\beta.\end{equation}
Idea of proof. The result can be directly shown by invoking Lévy’s continuity theorem, i.e. one only needs to prove that the characteristic function of the random variables on the left hand side of (13) converges to the characteristic function of (Yα(1))β. Alternatively, the result follows from Theorem 3.4 in [Reference Serfozo48] or Theorem 1 on pp. 69–70 in [Reference Grandell27].
Remark 1. As a special case of the theorem we get for Λ(t) = λt, for constant λ > 0
 \begin{equation*}\frac{\Lambda(xt)}{\Lambda(t)} = x^1\end{equation*}
which means Λ is regularly varying with index β = 1. It follows that
 \begin{equation*}\frac{N_1(\lambda Y_\alpha(t))}{\lambda t^\alpha} \xrightarrow[t\rightarrow\infty]{d} Y_\alpha(1).\end{equation*}
This is in agreement with the scaling limit given in [Reference Cahoy, Uchaikin and Woyczynski12] who showed that
 \begin{equation*}
\frac{N_1(\lambda Y_\alpha(t))}{\mathbb{E}[N_1(\lambda Y_\alpha(t))]}
= \frac{N_1(\lambda Y_\alpha(t))}{{\lambda t^\alpha}/{\Gamma(1+\alpha)}}
\xrightarrow[t\rightarrow\infty]{d} \Gamma(1+\alpha) Y_\alpha(1).
\end{equation*}
4.2. A functional limit theorem
The one-dimensional result in Proposition 5 can be extended to a functional limit theorem.
Theorem 1. Let the FNPP (Nα(t))t≥0 be defined as in Equation (2). Suppose the function t ↦ Λ(t) is regularly varying with index β ∈ ℝ Then the following limit holds for the FNPP:
 \begin{equation}\Big(\frac{N_\alpha(t\tau)}{\Lambda(t^\alpha)}\Big)_{\tau\geq 0} \xrightarrow[t \rightarrow \infty]{J_1} ([Y_\alpha(\tau)]^\beta)_{\tau\geq 0}.\end{equation}
Remark 2. As the limit process has continuous paths the mode of convergence improves to local uniform convergence. Also in this theorem, we will denote the homogeneous Poisson process with intensity parameter λ = 1 with N 1
In order to prove the above theorem, we need Theorem 2 on p. 81 in [Reference Grandell27], which we will state here for convenience as a lemma.
Lemma 2. Let  $\bar{\Lambda}$ be a stochastic process in
 $\mathcal{D}([0,\infty))$ with
 $\bar{\Lambda}(0) = 0$ and let
 $N = N_1(\bar{\Lambda})$ be the corresponding doubly stochastic process. Let
 $a \in \mathcal{D}([0,\infty))$ with a(0) = 0 and t ↦ bt a positive regularly varying function with index ρ > 0 such that
 \begin{gather*}
\frac{a(t)}{b_t} \xrightarrow[t \to \infty]{} \kappa \in [0,\infty) \text{ and }\\
\Big( \frac{\bar{\Lambda}(t\tau) - a(t\tau)}{b_t}\Big)_{\tau \geq 0} \xrightarrow[t \to \infty]{J_1} (S(\tau))_{\tau \geq 0},
\end{gather*}
where S is a stochastic process in  $\mathcal{D}([0,\infty))$. Then
 \begin{equation*}\Big( \frac{N(t\tau) - a(t\tau)}{b_t}\Big)_{\tau \geq 0} \xrightarrow[t\to \infty]{J_1} (S(\tau) + h(B(\tau)))_{\tau \geq 0},\end{equation*}
where h(τ) = κτ 2ρ and (S(t))t≥0 and (B(t))t≥0 are independent. (B(t))t≥0 is the standard Brownian motion in  $\mathcal{D}([0,\infty))$.
Proof of Theorem 1. We apply Lemma 2 and choose a ≡ 0 and bt = Λ(tα). Then it follows that κ = 0 and it can be checked that bt is regularly varying with index αβ:
 \begin{equation*}\frac{b_{xt}}{b_t} = \frac{\Lambda(x^\alpha t^\alpha)}{\Lambda(t^\alpha)} \xrightarrow[t\to \infty]{} x^{\alpha\beta}\end{equation*}
by the regular variation property in (12). We are left to show that
 \begin{equation}\tilde{\Lambda}_t(\tau) \coloneqq \Big(\frac{\Lambda(Y_\alpha(t\tau))}{\Lambda(t^\alpha)}\Big)_{\tau \geq 0} \xrightarrow[t\to \infty]{J_1} ([Y_\alpha(\tau)]^\beta)_{\tau \geq 0}.\end{equation}
This can be done by following the usual technique of first proving convergence of the finite-dimensional marginals and then tightness of the sequence in the Skorokhod space  $\mathcal{D}([0,\infty))$. Concerning the convergence of the finite-dimensional marginals we show convergence of their respective characteristic functions. Let t > 0 be fixed at first,
 $\tau = (\tau_1, \tau_2, \ldots, \tau_n) \in \mathbb{R}_+^n$ and 〈·, ·〉 denote the scalar product in ℝn. Then, we can write the characteristic function of the joint distribution of the vector
 \begin{equation*}\frac{\Lambda(t^\alpha Y_\alpha(\tau))}{\Lambda(t^\alpha)} = \Big( \frac{\Lambda(t^\alpha Y_\alpha(\tau_1))}{\Lambda(t^\alpha)}, \frac{\Lambda(t^\alpha Y_\alpha(\tau_2))}{\Lambda(t^\alpha)}, \ldots, \frac{\Lambda(t^\alpha Y_\alpha(\tau_n))}{\Lambda(t^\alpha)}\Big) \in \mathbb{R}_{+}^n\end{equation*}
as
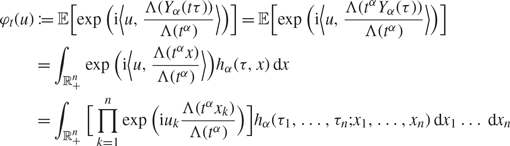 \begin{align}
\varphi_t(u) &\coloneqq \mathbb{E}\Big[\!\exp\Big(\ci \Big\langle u, \frac{\Lambda(Y_\alpha(t\tau))}{\Lambda(t^\alpha)} \Big\rangle\Big)\Big]
= \mathbb{E}\Big[\!\exp\Big(\ci \Big\langle u, \frac{\Lambda(t^\alpha Y_\alpha(\tau))}{\Lambda(t^\alpha)} \Big\rangle\Big)\Big]\\
&= \int_{\mathbb{R}_{+}^n} \exp\Big(\ci \Big\langle u, \frac{\Lambda(t^\alpha x)}{\Lambda(t^\alpha)}\Big\rangle\Big)h_\alpha(\tau, x) \sd x \nonumber \\
&= \int_{\mathbb{R}_{+}^n} \Big[\prod_{k=1}^n \exp\Big(\ci u_k \frac{\Lambda(t^\alpha x_k)}{\Lambda(t^\alpha)}\Big)\Big]h_\alpha(\tau_1, \ldots, \tau_n; x_1, \ldots, x_n) \sd x_1 \ldots \sd x_n \nonumber
\end{align}
where u ∈ ℝ n and hα(τ, x) = hα(τ 1, τ 2, …, τn;x 1, x 2 …, xn) is the density of the joint distribution of (Yα(τ 1), Yα(τ 2), …, Yα(τn)). In (16), we use self-similarity. We can find a dominating function by the following estimate:
 \begin{equation*}\Big\vert \exp\Big(\ci \Big\langle u, \frac{\Lambda(t^\alpha x)}{\Lambda(t^\alpha)}\Big\rangle\Big)h_\alpha(\tau, x)\Big\vert \leq h_\alpha(\tau, x).\end{equation*}
The upper bound is an integrable function which is independent of t. By dominated convergence we may interchange limit and integration:
 \begin{align*}
\lim_{t\to \infty} \varphi_n(u) &= \lim_{t \to \infty} \int_{\mathbb{R}_{+}^n} \exp\Big(\ci \Big\langle u, \frac{\Lambda(t^\alpha x)}{\Lambda(t^\alpha)}\Big\rangle\Big)h_\alpha(\tau, x) \sd x\\
&= \int_{\mathbb{R}_{+}^n} \lim_{t\to \infty}\exp\Big(\ci \Big\langle u, \frac{\Lambda(t^\alpha x)}{\Lambda(t^\alpha)}\Big\rangle\Big)h_\alpha(\tau, x) \sd x\\
&= \int_{\mathbb{R}_{+}^n} \exp(\ci \langle u, x^\beta\rangle)h_\alpha(\tau, x) \sd x \\
& = \mathbb{E}[\!\exp(i\langle u, (Y_\alpha(\tau))^\beta\rangle)],
\end{align*}
where in the last step we used the continuity of the exponential function and the scalar product to calculate the limit. By Lévy’s continuity theorem we may conclude that for n ∈ ℕ
 \begin{equation*}
\Big(\frac{\Lambda(Y_\alpha(t\tau_k))}{\Lambda(t^\alpha)}\Big)_{k=1, \ldots, n} \xrightarrow[t \to \infty]{d} ([Y_\alpha(\tau_k)]^\beta)_{k=1, \ldots, n}.
\end{equation*}
In order to show tightness, first observe that for fixed t both the stochastic process  $\tilde{\Lambda}_t$ on the left hand side and the limit candidate ([Yα(τ)]β)τ≥0 have increasing paths. Moreover, the limit candidate has continuous paths. Therefore we are able to invoke Thm. VI.3.37(a) in [Reference Jacod and Shiryaev31] to ensure tightness of the sequence
 $(\tilde{\Lambda}_t)_{t\geq 0}$ and thus the thesis follows.
By applying the transformation theorem for probability densities to (3), we can write for the density  $h_\alpha^\beta(t, \cdot)$ of the one-dimensional marginal of the limit process ([Yα(t)]β)t≥0 as
 \begin{align}
h_\alpha^\beta(t,x) &= \frac{1}{\beta} x^{1/\beta - 1} h_\alpha(t,x^{1/\beta})\nonumber\\
&= \frac{1}{\beta} x^{1/\beta - 1} \frac{t}{\alpha x^{1/\beta(1+1/\alpha)}} g_\alpha\Big(\frac{t}{y^{1/(\alpha\beta)}}\Big)\nonumber\\
%&= \frac{t}{\alpha\beta} x^{1/\beta - 1 - 1/\beta -1/(\alpha\beta)} g_\alpha\left(\frac{t}{y^{1/(\alpha\beta)}}\right)\\
&= \frac{t}{\alpha\beta x^{1+1/(\alpha\beta)}}g_\alpha\Big(\frac{t}{y^{1/(\alpha\beta)}}\Big), \; x > 0.
\end{align}
Note that this is not the density of Yαβ(t).
A further limit result can be obtained for the FHPP via a continuous mapping argument.
Proposition 6. Let (N 1(t))t≥0 be a homogeneous Poisson process and (Yα(t))t≥0 be the inverse α-stable subordinator. Then
 \begin{equation*}\Big(\frac{N_1(Y_\alpha(t)) - \lambda Y_\alpha(t)}{\sqrt{\lambda}}\Big)_{t \geq 0} \xrightarrow[\lambda \to \infty]{J_1} (B(Y_\alpha(t)))_{t \geq 0},\end{equation*}
where (B(t))t≥0 is a standard Brownian motion.
Proof. The classical result
 \begin{equation*}\Big(\frac{N_1(t) - \lambda t}{\sqrt{\lambda}}\Big)_{t \geq 0} \xrightarrow[\lambda \to \infty]{J_1} (B(t))_{t \geq 0}\end{equation*}
can be shown by using that (N 1(t) − λt)t≥0 is a martingale. As (B(t))t≥0 has continuous paths and (Yα(t))t≥0 has increasing paths we can use Theorem 13.2.2 in [Reference Whitt51] to obtain the result.
The above proposition can be compared with Lemma 3 in the next section and a similar continuous mapping argument is applied in the proof of Theorem 4.
5. The fractional compound Poisson process
Let X 1, X 2, … be a sequence of i.i.d. random variables. The fractional compound Poisson process is defined analogously to the standard compound Poisson process where the Poisson process is replaced by a FNPP:
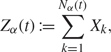 \begin{equation}Z_\alpha(t) \coloneqq \sum_{k=1}^{N_\alpha(t)} X_k,\end{equation}
where 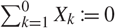 $\sum_{k=1}^0 X_k \coloneqq 0$ The process Nα is not necessarily independent of the Xi’s unless stated otherwise.
In the following, we need to discuss stable laws as we are dealing with limit theorems. Stable laws can be defined via the form of their characteristic function.
Definition 3. A random variable S is said to have a stable distribution if there are parameters  $0 < \tilde{\alpha} \leq 2$, σ ≥ 0, −1 ≤ β ≤ 1 and μ ∈ ℝ such that its characteristic function has the following form:
 \begin{equation*}
\mathbb{E}[\!\exp(i\theta S)] = \left\{\!\!
\begin{array}{ll}
\exp\bigg(\!-\sigma^{\tilde{\alpha}} \vert \theta\vert^{\tilde{\alpha}} \bigg[1 - \ci \beta\, \text{sign}(\theta) \tan\bigg(\dfrac{\pi \tilde{\alpha}}{2}\bigg)\bigg] + \ci \mu\theta\bigg)
& \text{ if } \tilde{\alpha} \neq 1,\\[10pt]
\exp\bigg(\!-\sigma\vert \theta\vert \bigg[1 + \ci \beta \dfrac{2}{\pi}\, \text{sign}(\theta)\ln(\vert \theta\vert)\bigg] + \ci \mu\theta\bigg) & \text{ if } \tilde{\alpha} = 1
\end{array}\right.
\end{equation*}
(see Definition 1.1.6 in [Reference Samorodnitsky and Taqqu47]). We will assume a limit result for the sequence of partial sums without time change
 \begin{equation}S_n \coloneqq \sum_{k=1}^n X_k.\end{equation}
There exist sequences (an)n∈ℕ and (bn)n∈ℕ and and a random variable following a stable distribution S such that
 \begin{equation*}\bar{S}_n \coloneqq a_n S_n - b_n \xrightarrow[n \to \infty]{d} S.\end{equation*}
(for details see Chapter XVII in [Reference Feller21] for example). In other words the distribution of the Xk is in the domain of attraction of a stable law.
In the following, we will derive limit theorems for the fractional compound Poisson process. In Section 5.2, we assume Nα to be independent of the Xk’s and use a continuous mapping theorem argument to show functional convergence w.r.t. a suitable Skorokhod topology. A corresponding one-dimensional limit theorem would follow directly from the functional one. However, in the special case of Nα being a FHPP, using Anscombe type theorems in Section 6.1 allows us to drop the independence assumption between Nα and the Xk’s and thus strengthen the result for the one-dimensional limit.
5.1. A one-dimensional limit result
The following theorem is due to [Reference Anscombe2] and can be found slightly reformulated in [Reference Richter46].
Theorem 2. We assume that the following conditions are fulfilled:
(i) The sequence of random variables Rn such that
for some random variable R.\begin{equation*}R_n \xrightarrow[n\to \infty]{d} R,\end{equation*}
(ii) Let the family of integer-valued random variables (Ñ(t))t≥0 be relatively stable, i.e. for a real-valued function ψ with
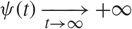
$\psi(t) \xrightarrow[t\to \infty]{} +\infty$ it holds that
\begin{equation*}\frac{\tilde{N}(t)}{\psi(t)} \xrightarrow[t \to \infty]{P} 1.\end{equation*}
(iii) (Uniform continuity in probability) For every ε > 0 and η > 0 there exists a c = c(ε, η) and a t 0 = t 0(ε, η) such that for all t ≥ t 0
\begin{equation*}\mathbb{P}\big( \max_{m: \vert m-t \vert < ct} \vert R_m - R_t\vert > \varepsilon\big) < \eta.\end{equation*}



Then,
 \begin{equation*}R_{\tilde{N}(t)} \xrightarrow[t\to \infty]{d} R.\end{equation*}
Concerning the condition (ii), note that the required convergence in probability is stronger than the convergence in distribution we have derived in the previous sections for the FNPP. Nevertheless, in the special case of the FHPP, we can prove the following lemma.
Lemma 3. Let Nα be a FHPP, i.e. Λ(t) = λt. Then with  $C \coloneqq \frac{\lambda}{\Gamma(1+\alpha)}$ it holds that
 \begin{equation*}\frac{N_\alpha(t)}{C t^\alpha} \xrightarrow[t \to \infty]{P} 1.\end{equation*}
Proof. According to Proposition 4.1 from [Reference Di Crescenzo, Martinucci and Meoli18] we have the result that for fixed t > 0 the convergence
 \begin{equation}\frac{N_1(\lambda Y_\alpha(t))}{\mathbb{E}[N_1(\lambda Y_\alpha(t))]} = \frac{N_1(\lambda Y_\alpha(t))}{\lambda t^\alpha\!/\kern-0.3pt\Gamma(1+\alpha)} \xrightarrow[\lambda \to \infty]{L^1} 1\end{equation}
holds and therefore also in probability.
It can be shown by using the fact that the moments and the waiting time distribution of the FHPP can be expressed in terms of the Mittag-Leffler function.
Let ε > 0. We have
 \begin{align}\lim_{t\to \infty} \mathbb{P}\Big(\Big\vert \frac{N_1(\lambda Y_\alpha(t))}{C t^\alpha} - 1\Big\vert > \varepsilon\Big)
&= \lim_{t\to \infty} \mathbb{P}\Big(\Big\vert \frac{N_1(\lambda t^\alpha Y(1))}{\lambda t^\alpha\!/\kern-0.3pt\Gamma(1+\alpha)} - 1\Big\vert > \varepsilon\Big) \label{eq:fractional:36}\\%\label{eq:14}\\\end{align}
 \begin{align}&= \lim_{\tau\to \infty} \mathbb{P}\Big(\Big\vert \frac{N_1(\tau Y(1))}{\tau \cdot 1^\alpha\!/\kern-0.3pt\Gamma(1+\alpha)} - 1\Big\vert > \varepsilon\Big) = 0,\label{eq:fractional:37}\end{align}
where in (21) we used the self-similarity property of Yα and in (22) we applied (20) with t = 1.
As a direct application of Theorem 2 we can prove the following lemma.
Lemma 4. Let Nα be a FHPP and X 1, X 2, … be a sequence of i.i.d. variables in the DOA of a stable law μ. Then, for the partial sums Sn defined in (19) there exist sequences (an)n∈ℕ and (bn)n∈ℕ such that
 \begin{equation*}a_{N_\alpha(t)} S_{N_\alpha(t)} - b_{N_\alpha(t)} \xrightarrow[t\to \infty]{d} S,\end{equation*}
where S ~ μ.
Proof. We would like to use the above theorem for Rn = S̄n and Ñ= Nα. Indeed, condition (i) follows from the assumption that the law of X 1 lies in the domain of attraction of a stable law and condition (ii) follows from Lemma 3. It is readily proven in Theorem 3 in [Reference Anscombe2] that (S̄n) satisfies the condition (iii), if condition (i) and (ii) are fulfilled. Therefore, it follows from Theorem 2 that
 \begin{eqnarray*}\bar{S}_{N_\alpha(t)} = a_{N_\alpha(t)}\sum_{k=1}^{N_\alpha(t)} X_k - b_{N_\alpha(t)} \xrightarrow[t\to \infty]{d} S.\\\end{eqnarray*}
Finally, we would like to replace Nα(t) with ⌊Ctα⌋ in the index of a and b. This requires additional conditions. The following theorem is a slight modification of Theorem 3.6 in Chapter 9 of [Reference Gut30].
Theorem 3. Let X 1, X 2, … be i.i.d. random variables with  $\mathbb{E}[X_1] =0$ and set
 \begin{equation*}S_n \coloneqq \sum_{k=1}^n X_k, \quad n\geq 1.\end{equation*}
Suppose that (an)n≥0 is a sequence of positive norming constants such that
 \begin{equation*}
\frac{S_n}{a_n} \xrightarrow[n\to \infty]{d} S,
\end{equation*}
where S follows a stable law with index α ∈ (1, 2]. Let (N(t))t≥0 be a sequence of integer-valued random variables such that (ii) in Theorem 2 is fulfilled. Then,
 \begin{equation*}a_{\lfloor C t^\alpha \rfloor}\sum_{k=1}^{N_\alpha(t)} X_k = a_{\lfloor C t^\alpha \rfloor} Z_\alpha(t) \xrightarrow[t\to \infty]{d} S.\end{equation*}
Idea of proof. By Lemma 4 we have
 \begin{equation*}a_{N_\alpha(t)}\sum_{k=1}^{N_\alpha(t)} X_k \xrightarrow[t\to \infty]{d} S,\end{equation*}
as bn = 0 by assumption. In order to replace Nα(t) with ⌊Ctα⌋ in the index of a one has to show that
 \begin{equation*}\frac{N_\alpha(t)}{C t^\alpha} \xrightarrow[t \to \infty]{P} 1\end{equation*}
implies
 \begin{equation*}\frac{a_{N_\alpha(t)}}{a_{{\lfloor C t^\alpha \rfloor}}} \xrightarrow[t\to \infty]{P} 1.\end{equation*}
The derivation of suitable estimates relies on the fact that n ↦ an is regularly varying (for details see Lemma 2.9 (a) in [Reference Gut29]).
(i) The conditions restrict to the centered, symmetric case (i.e.
$\mathbb{E}[X_1]=0$, $b_n=0$) and α ∈ (1, 2] as the mean exists. While it can be shown that an ∈ R −1/α, in the non-symmetric case, we generally do not have a regular variation property for bn.(ii) Note that this convergence result does not require Nα to be independent of the Xk’s. The above derivation also works for mixing sequences X 1, X 2, … instead of i.i.d. (see [Reference Csörgő and Fischler16] for a generalization of Anscombe’s theorem for mixing sequences).

5.2. A functional limit theorem
Theorem 4. Let the FNPP (Nα(t))t≥0 be defined as in Equation (2) and suppose the function t ↦ Λ (t) is regularly varying with index β ∈ℝ Moreover let X 1, X 2, … be i.i.d. random variables independent of Nα. Assume that the law of X 1 is in the domain of attraction of a stable law, i.e. there exist sequences (an)n∈ℕ and (bn)n∈ℕ and a stable Lévy process (S(t))t≥0 such that the partial sums Sn defined in (19) satisfy
 \begin{align}( a_n S_{\lfloor nt\rfloor} - b_n)_{t \geq 0} \xrightarrow[n \to \infty]{J_1} (S(t))_{t \geq 0}.\end{align}
Then the fractional compound Poisson process Zα defined in (18) satisfies the following limit:
 \begin{equation*}(c_nZ_\alpha(nt)-d_n)_{t\geq 0} \xrightarrow[n \to \infty]{M_1} ( S([Y_\alpha(t)]^\beta))_{t \geq 0},\end{equation*}
where cn := a ⌊Λ(n)⌋ and dn := b ⌊Λ(n)⌋.
Proof. The proof follows the technique proposed by [Reference Meerschaert and Scheffler41]: By Theorem 1 we have
 \begin{align*}\Big(\frac{N_\alpha(t\tau)}{\Lambda(t^\alpha)}\Big)_{\tau\geq 0} \xrightarrow[t \rightarrow \infty]{J_1} ([Y_\alpha(\tau)]^\beta)_{\tau\geq 0}.\end{align*}
By the independence assumptions we can combine this with (23) to get
 \begin{align*}( a_{\lfloor\Lambda(n^\alpha)\rfloor} S_{\lfloor\Lambda(n^\alpha)t\rfloor} - b_{\lfloor\Lambda(n^\alpha)\rfloor}, [\Lambda(n^\alpha)]^{-1} N_\alpha(nt))_{t\geq 0} \xrightarrow[n\to \infty]{J_1} (S(t), [Y_\alpha(t)]^\beta)_{t\geq 0}\end{align*}
in the space  $\mathcal{D}([0, \infty), \mathbb{R}\times [0, \infty))$, ℝ × [0, ∞)). Note that ([Yα(t)]β)t≥0 is non-decreasing. Moreover, due to independence the Lévy processes (S(t))t≥0 and (Dα(t))t≥0 do not have simultaneous jumps (for details see [Reference Becker-Kern, Meerschaert and Scheffler3] and more generally [Reference Cont and Tankov14]). This allows us to apply Theorem 13.2.4 in [Reference Whitt51] to get the thesis by means of a continuous mapping argument since the composition mapping is continuous in this setting.
6. Numerical experiments
6.1. Simulation methods
In the special case of the FHPP, the process is simulated by sampling the waiting times Ji of the overall process N(Yα(t)), which are Mittag-Leffler distributed (see Equation (1)). Direct sampling of the waiting times of the FHPP can be done via a transformation formula due to [Reference Kozubowski and Rachev34]
 \begin{align*}J_1 = - \frac{1}{\lambda} \log(U) \Big[ \frac{\sin(\alpha \pi)}{\tan(\alpha\pi V)} - \cos(\alpha \pi)\Big]^{1/\alpha},\end{align*}
where U and V are two independent random variables uniformly distributed on [0, 1]. For futher discussion and details on the implementation see [Reference Fulger, Scalas and Germano22] and [Reference Germano, Politi, Scalas and Schilling25].
As the above method is not applicable for the FNPP, we draw samples of Yα(t) first, before sampling N. The Laplace transform w.r.t. the time variable of Yα(t) is given by
 \begin{equation*}\int_0^\infty \e^{-st} h_\alpha(t,x)\,dt = s^{\alpha-1} \exp(-xs^\alpha).\end{equation*}
We evaluate the density hα by inverting the Laplace transform numerically using the Post-Widder formula ([Reference Post45] and [Reference Widder52]):
Theorem 5. If the integral
 \begin{align*}\bar{f}(s) = \int_0^\infty \re^{-su}f(u) \sd u\end{align*}
converges for every s > γ, then
 \begin{align*}f(t) = \lim_{n \rightarrow \infty} \frac{(-1)^n}{n!}\Big(\frac{n}{t}\Big)^{n+1} \bar{f}^{(n)}\Big(\frac{n}{t}\Big),\end{align*}
for every point t > 0 of continuity of f (t) (cf. p. 37 in [Reference Cohen13]).
This evaluation of the density function allows us to sample Yα(t) using discrete inversion.
6.2. Numerical results
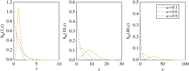
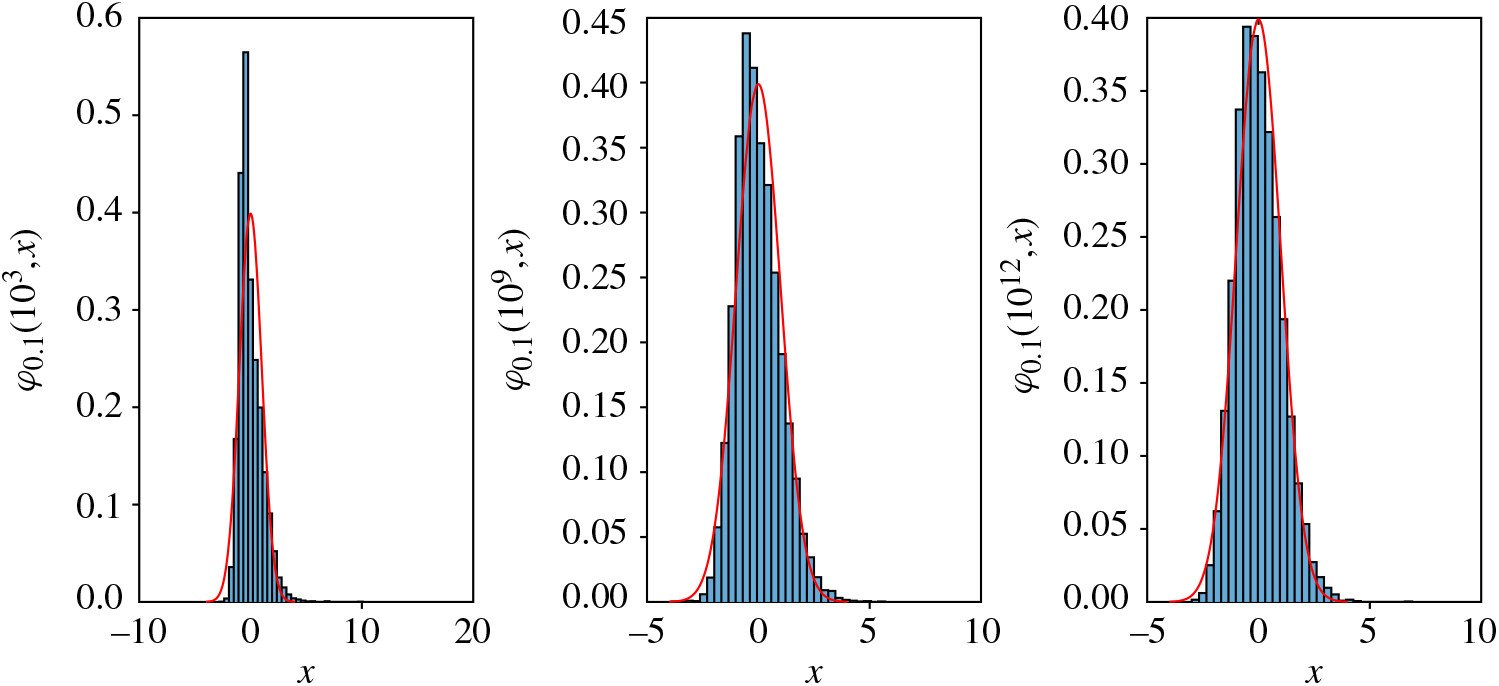
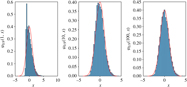
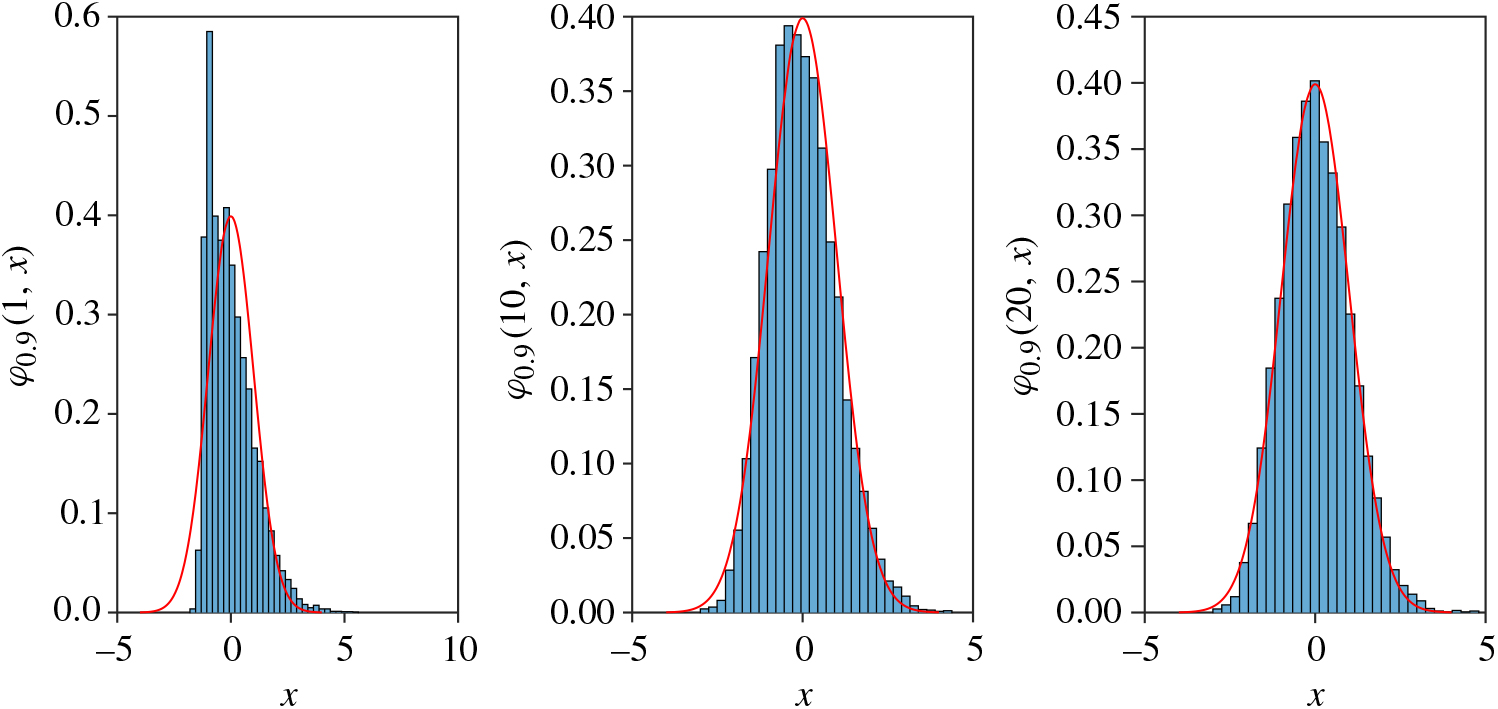
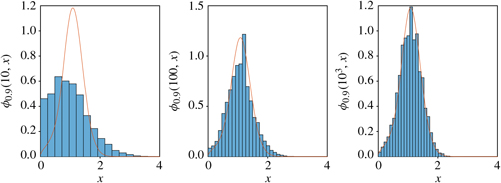
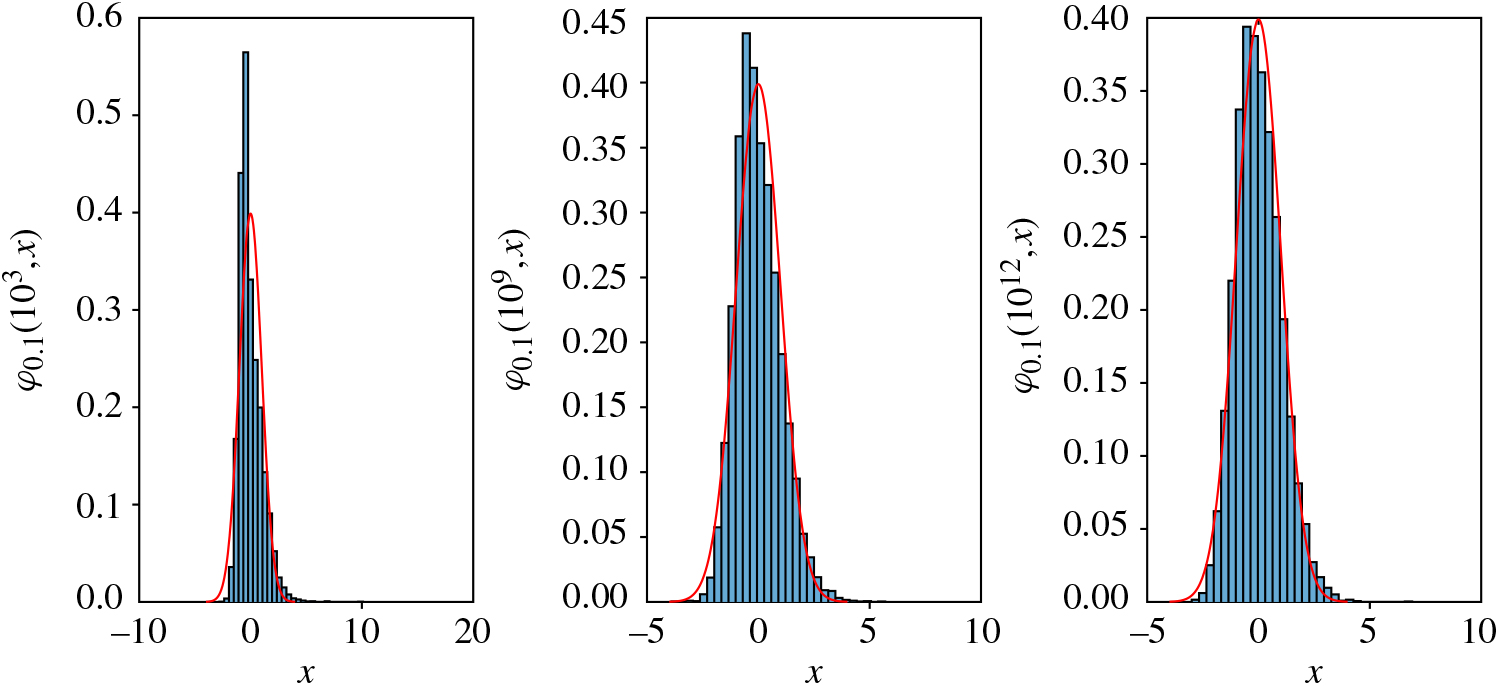
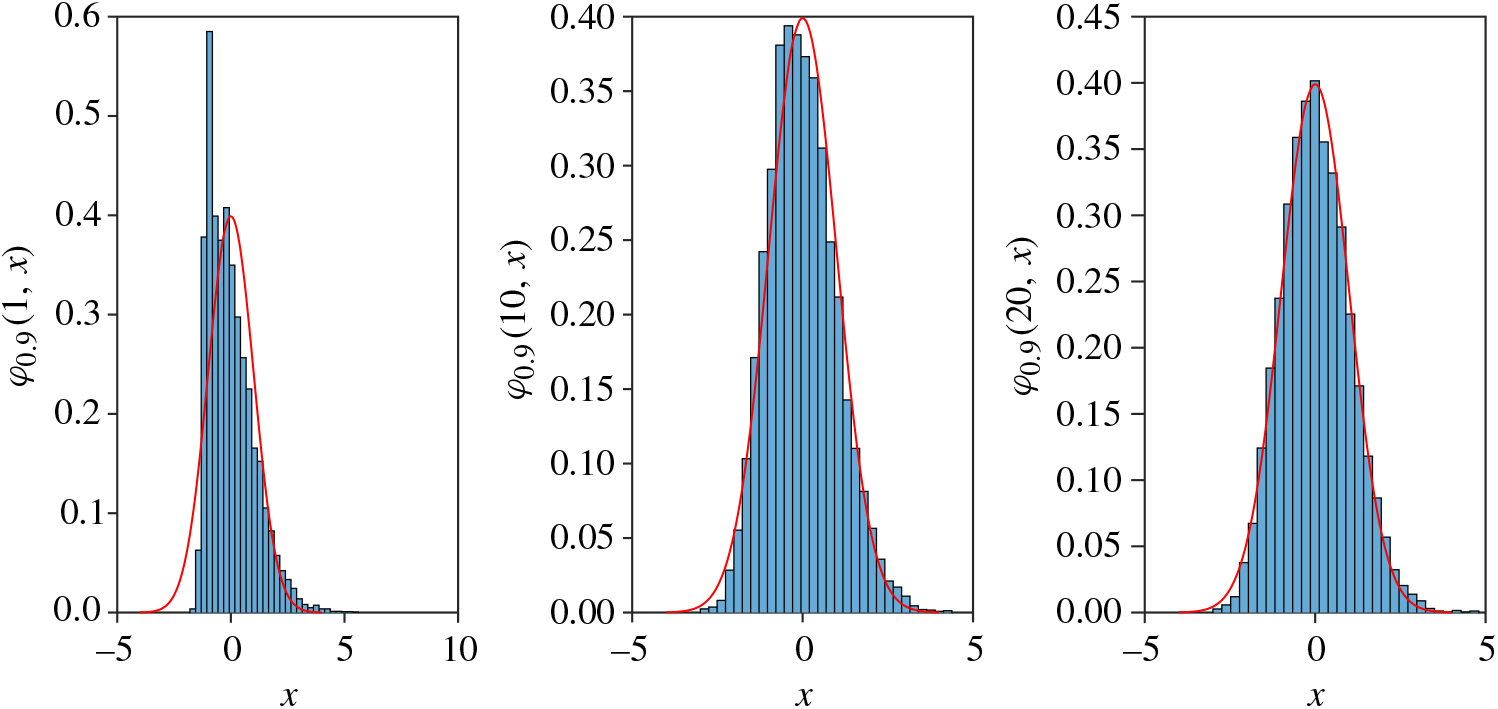
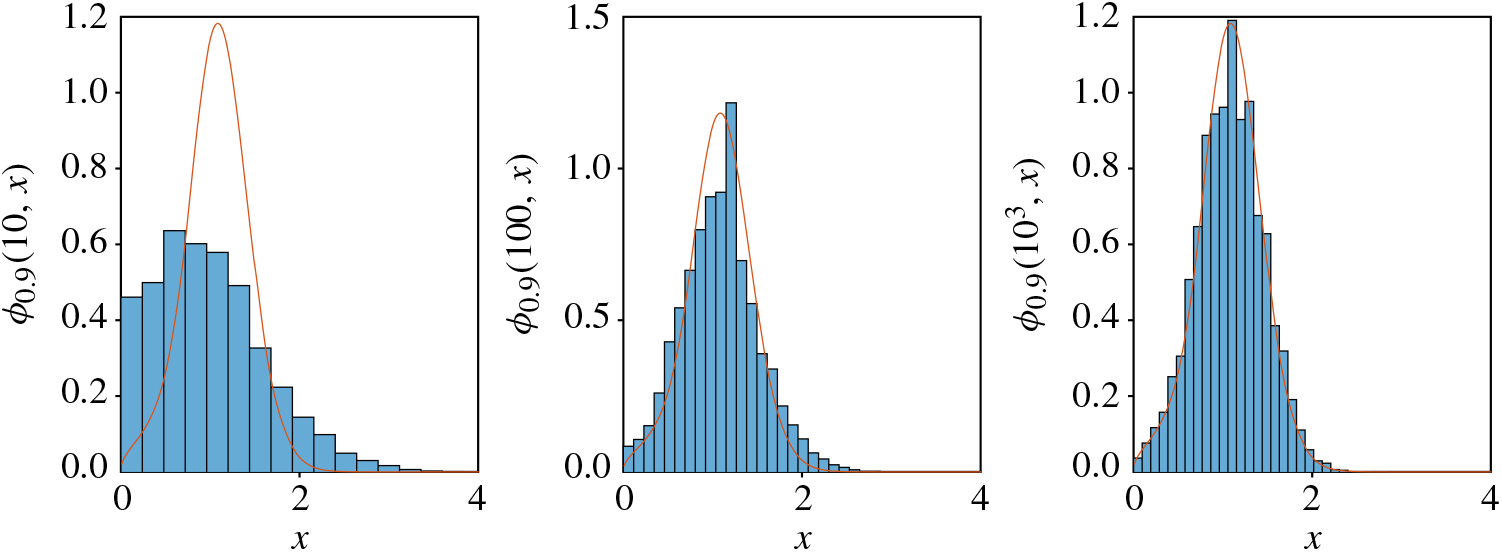
Figure 1 shows the shape and time-evolution of the densities for different values of α. As Yα is a non decreasing process, the densities spread to the right as time passes. We performed a small Monte Carlo simulation in order to illustrate the one-dimensional convergence results of Lemma 1 and Proposition 5. In Figures 2, 3 and 4, we can see that the simulated values for the probability density x ↦ φα (t, x) of  $[N(Y_\alpha(t)) - \Lambda(Y_\alpha(t))]/\sqrt{\Lambda(Y_\alpha(t))}$ approximate the density of a standard normal distribution for increasing time t. In a similar manner, Figure 5 depicts how the probability density function x ↦ ϕα (t, x) of Nα(t)/ Λ(tα) approximates the density of (Yα(t))β given in (17), where has regular variation index β = 0.7.
7. Summary and outlook
Due to the nonhomogeneous component of the FNPP, it is not surprising that analytical tractability needed to be compromised in order to derive analogous limit theorems. Most noticeably, the lack of a renewal representation of the FNPP compared to its homogeneous version leads to the requirement of additional conditions on the underlying filtration structure or rate function Λ.
Plots of the probability densities x ↦ hα(t, x) of the distribution of the inverse α-stable subordinator Yα(t) for different parameter α = 0.1, 0.6, 0.9 indicating the time-evolution: the plot on the left is generated for t = 1, the plot in the middle for t = 10 and the plot on the right for t = 40.
The red line shows the probability density function of the standard normal distribution, the limit distribution according to Lemma 1. The blue histograms depict samples of size 104 of the right hand side of (10) for different times t = 10, 109, 1012 to illustrate convergence to the standard normal distribution for α = 0.1.
The result in Proposition 4 partly answered an open question that followed after Theorem 1 in [Reference Leonenko, Scalas and Trinh37] concerning the limit α → 1.
Futher research will be directed towards the implications of the limit results for estimation techniques as well as on convergence rates.
The red line shows the probability density function of the standard normal distribution, the limit distribution according to Lemma 1. The blue histograms depict samples of size 104 of the right hand side of (10) for different times t = 1, 10, 100 to illustrate convergence to the standard normal distribution for α = 0.6.
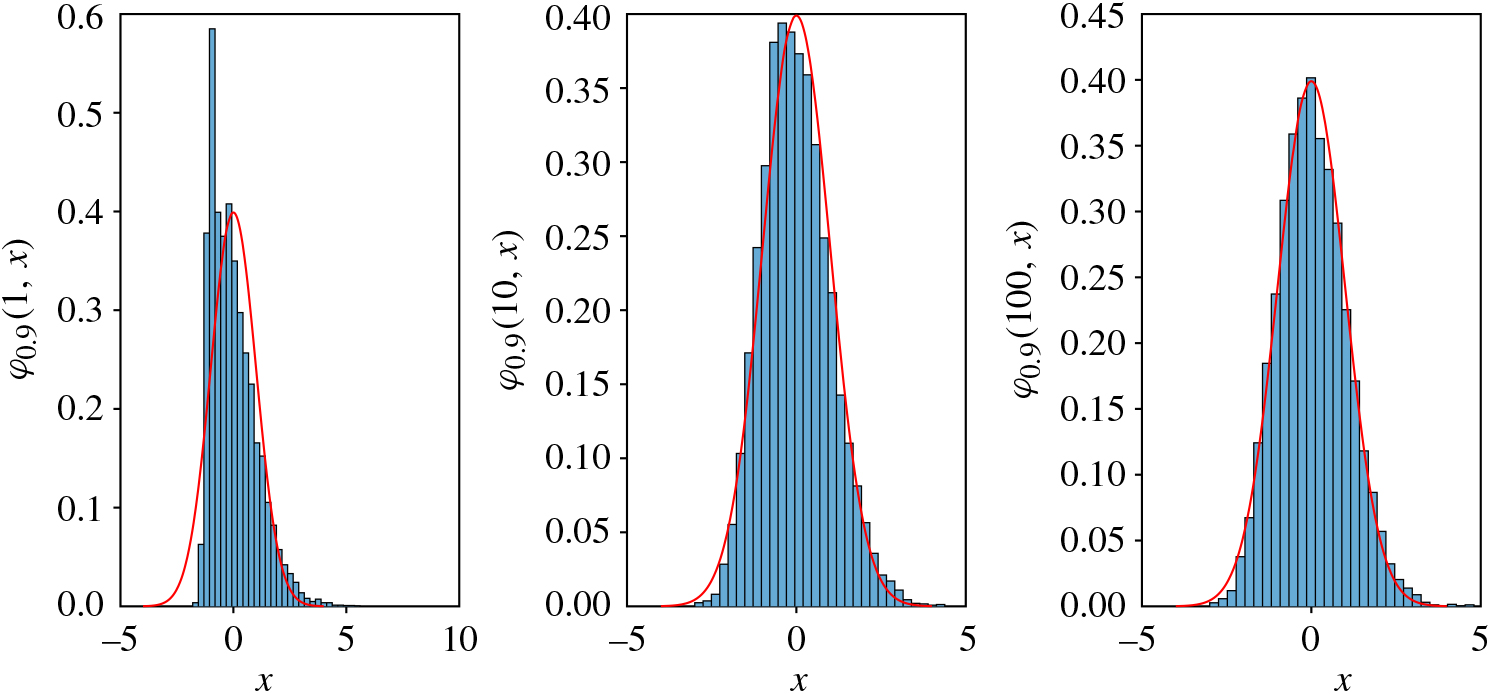
The red line shows the probability density function of the standard normal distribution, the limit distribution according to Lemma 1. The blue histograms depict samples of size 104 of the right hand side of (10) for different times t = 1, 10, 20 to illustrate convergence to the standard normal distribution for α= 0.9.
Red line: probability density function ϕ of the distribution of the random variable (Y 0.9(1))0.7, the limit distribution according to Proposition 5. The blue histogram is based on 104 samples of the random variables on the right hand side of (13) for time points t = 10, 100, 103 to illustrate the convergence result.
Acknowledgements
N. Leonenko was supported in particular by Cardiff Incoming Visiting Fellowship Scheme and International Collaboration Seedcorn Fund and Australian Research Council’s Discovery Projects funding scheme (project number DP160101366). E. Scalas and M. Trinh were supported by the Strategic Development Fund of the University of Sussex.