Introduction
Food waste and loss are major global problems due to their negative consequences on the environment, society and economy(Reference Mbow, Rosenzweig, Barioni, Shukla, Skea and Calvo Buendia1), and nearly $1 trillion worth of food is wasted annually(2). This level of food waste puts significant pressure on both the environment and production, leading to the depletion of valuable resources such as water and soil, worsening climate change and negative socio-economic consequences such as reduced farmers’ incomes and increased food insecurity(Reference Roodhuyzen, Luning and Fogliano3). In addition, the United Nations Environment Programme shows that approximately 931 million tonnes of food are wasted annually, with households being the largest contributor at 570 million tonnes (61 %). For these reasons, the UN has set the Sustainable Development Goals Target 12·3, which aims to halve global food waste per capita at the retail and consumer levels by 2030(4).
Household food waste results from a complex interaction of multiple behaviours rather than a single action(Reference Quested, Marsh and Stunell5,Reference Principato, Mattia and Di Leo6) . These behaviours play out across the household’s food journey – from planning and purchasing to storage, preparation, consumption and disposal(Reference Schanes, Dobernig and Gözet7). Despite good intentions to reduce waste, daily food management routines and habits often have the most substantial impact on actual food waste outcomes, highlighting the importance of understanding both conscious decisions and unconscious behaviours in household food waste production(Reference Ghinea and Ghiuta8,Reference Stefan, van Herpen and Tudoran9) .
Although several validated tools exist to measure food waste behaviours(Reference Aydin and Yildirim10–Reference Stancu, Haugaard and Lähteenmäki12), most focus on single behavioural categories or emphasise cognitive aspects that do not always translate into actual waste reduction(Reference Schanes, Dobernig and Gözet7). The Food Wasting Behaviours Questionnaire (FWBQ) addresses these limitations by providing a comprehensive and systematic approach to measure self-reported food waste behaviours across multiple categories(Reference Misiak, Sobol and Sakowski13). The strengths of FWBQ lie in its versatility and practical applications: it can be used to monitor intervention effectiveness, conduct consumer segmentation research and facilitate cross-cultural comparisons due to its culturally inclusive design. Additionally, the questionnaire addresses an important gap in the literature, clearly defined food waste categories, addressing a significant gap in the literature where researchers often rely on intuitive, non-standardised categorisations by establishing clearly defined food waste categories. This standardisation makes the FWBQ particularly valuable for systematic reviews and meta-analyses, which are currently limited in food waste research. Furthermore, unlike expensive composition analyses or complex measurement procedures, the FWBQ offers a cost-effective and simple method for preliminary research, making food waste research more accessible to researchers and enabling efficient evaluation of behavioural interventions.
The FWBQ was originally developed and validated in Poland; however, cross-cultural application requires careful adaptation to account for distinct socioeconomic and cultural contexts that influence food waste behaviours. In this study, we aimed to adapt FWBQ to Turkish, so it could be used to study food wasting behaviours in Türkiye. The contrast between Poland and Türkiye is particularly noteworthy: Poland, classified as a high-income country by the World Bank, represents a different economic context than Türkiye, an upper-middle-income country(14). This economic disparity is reflected in food waste patterns, as high-income countries typically waste almost twice as much food per capita per day compared with upper-middle-income countries(Reference Chen, Chaudhary and Mathys15). Additionally, Poland and Türkiye differ in their food security status, with Poland ranked 21st and Türkiye 49th in the Global Food Security Index(16). The index suggests that the biggest differences between Poland and Türkiye lie in the affordability of food – the ability of consumers to purchase food, their vulnerability to price shocks and the presence of programmes and policies to support consumers when shocks occur (27th and 81st places, respectively). These disparities suggest that Turkish households may demonstrate different waste patterns influenced by distinct cultural practices around food preparation, sharing and consumption. These socio-economic factors underscore the importance of properly adapting and validating the FWBQ for use in the Turkish context.
The amount of food waste generated in households in Türkiye exceeds the world average(17). In Türkiye, 8 % of total food waste occurs at the consumption stage, and the most discarded food types are perishable items such as fruits, vegetables, cereals and dairy products(Reference Salihoglu, Salihoglu and Ucaroglu18). A previous study showed that the primary reasons for food waste include exceeding expiration dates, cooking or preparing excessive amounts of food and a lack of knowledge about effective food storage and shopping practices(19). While Turkish consumers demonstrate positive attitudes regarding waste awareness, intentions and norms, they struggle with consistent planning and purchasing behaviours. Notably, half of the consumers believe that better education on food management could significantly reduce waste(19).
Cultural factors also play an important role in food waste behaviours in Türkiye, creating a complex interplay between traditional values and waste reduction efforts. For instance, while religiosity and media exposure positively influence personal motivation to reduce food waste, the culturally embedded ‘good provider’ identity – associated with preparing abundant meals – works against waste reduction efforts(Reference Secer, Masotti and Iori20). Consumers who believe wasting food is against their upbringing and moral values act according to their self-concept and waste less food(Reference Aydin and Aydin21). These findings highlight how deeply cultural factors are intertwined with food waste behaviours in Turkish society, emphasising the need for culturally adapted measurement tools to assess these behaviours.
The current study
Previous studies conducted in Türkiye primarily focused on food waste attitudes, intentions and motivations or addressed only a single category of food waste behaviour(Reference Aydin and Yildirim10,Reference Aydin and Aydin21–Reference Karakas24) . The lack of a standardised and comprehensive tool with clearly defined food waste categories has limited understanding of the underlying causes of food waste in the Turkish context. Adapting the FWBQ to Turkish would both provide researchers with a validated tool to measure food waste behaviours and allow for future cross-cultural comparisons and longitudinal studies to track behavioural changes over time. However, for this to be effective in Türkiye, correct adaptation needs to be ensured in terms of language and culture. Therefore, this study aimed to adapt the FWBQ to Turkish and evaluate its psychometric properties and assumed that the adapted version would demonstrate valid and reliable measurement properties for assessing food waste behaviours in Turkish populations.
Materials and methods
Study design and participants
This cross-sectional study was conducted in three stages between January and March 2024 with participants living in Kayseri, Türkiye, who were selected using snowball sampling. The inclusion criteria were being 18 years or older and being responsible for at least part of the grocery shopping or cooking at home. Illiterate individuals were excluded from the study. The questionnaire was administered to one person per household who met these inclusion criteria.
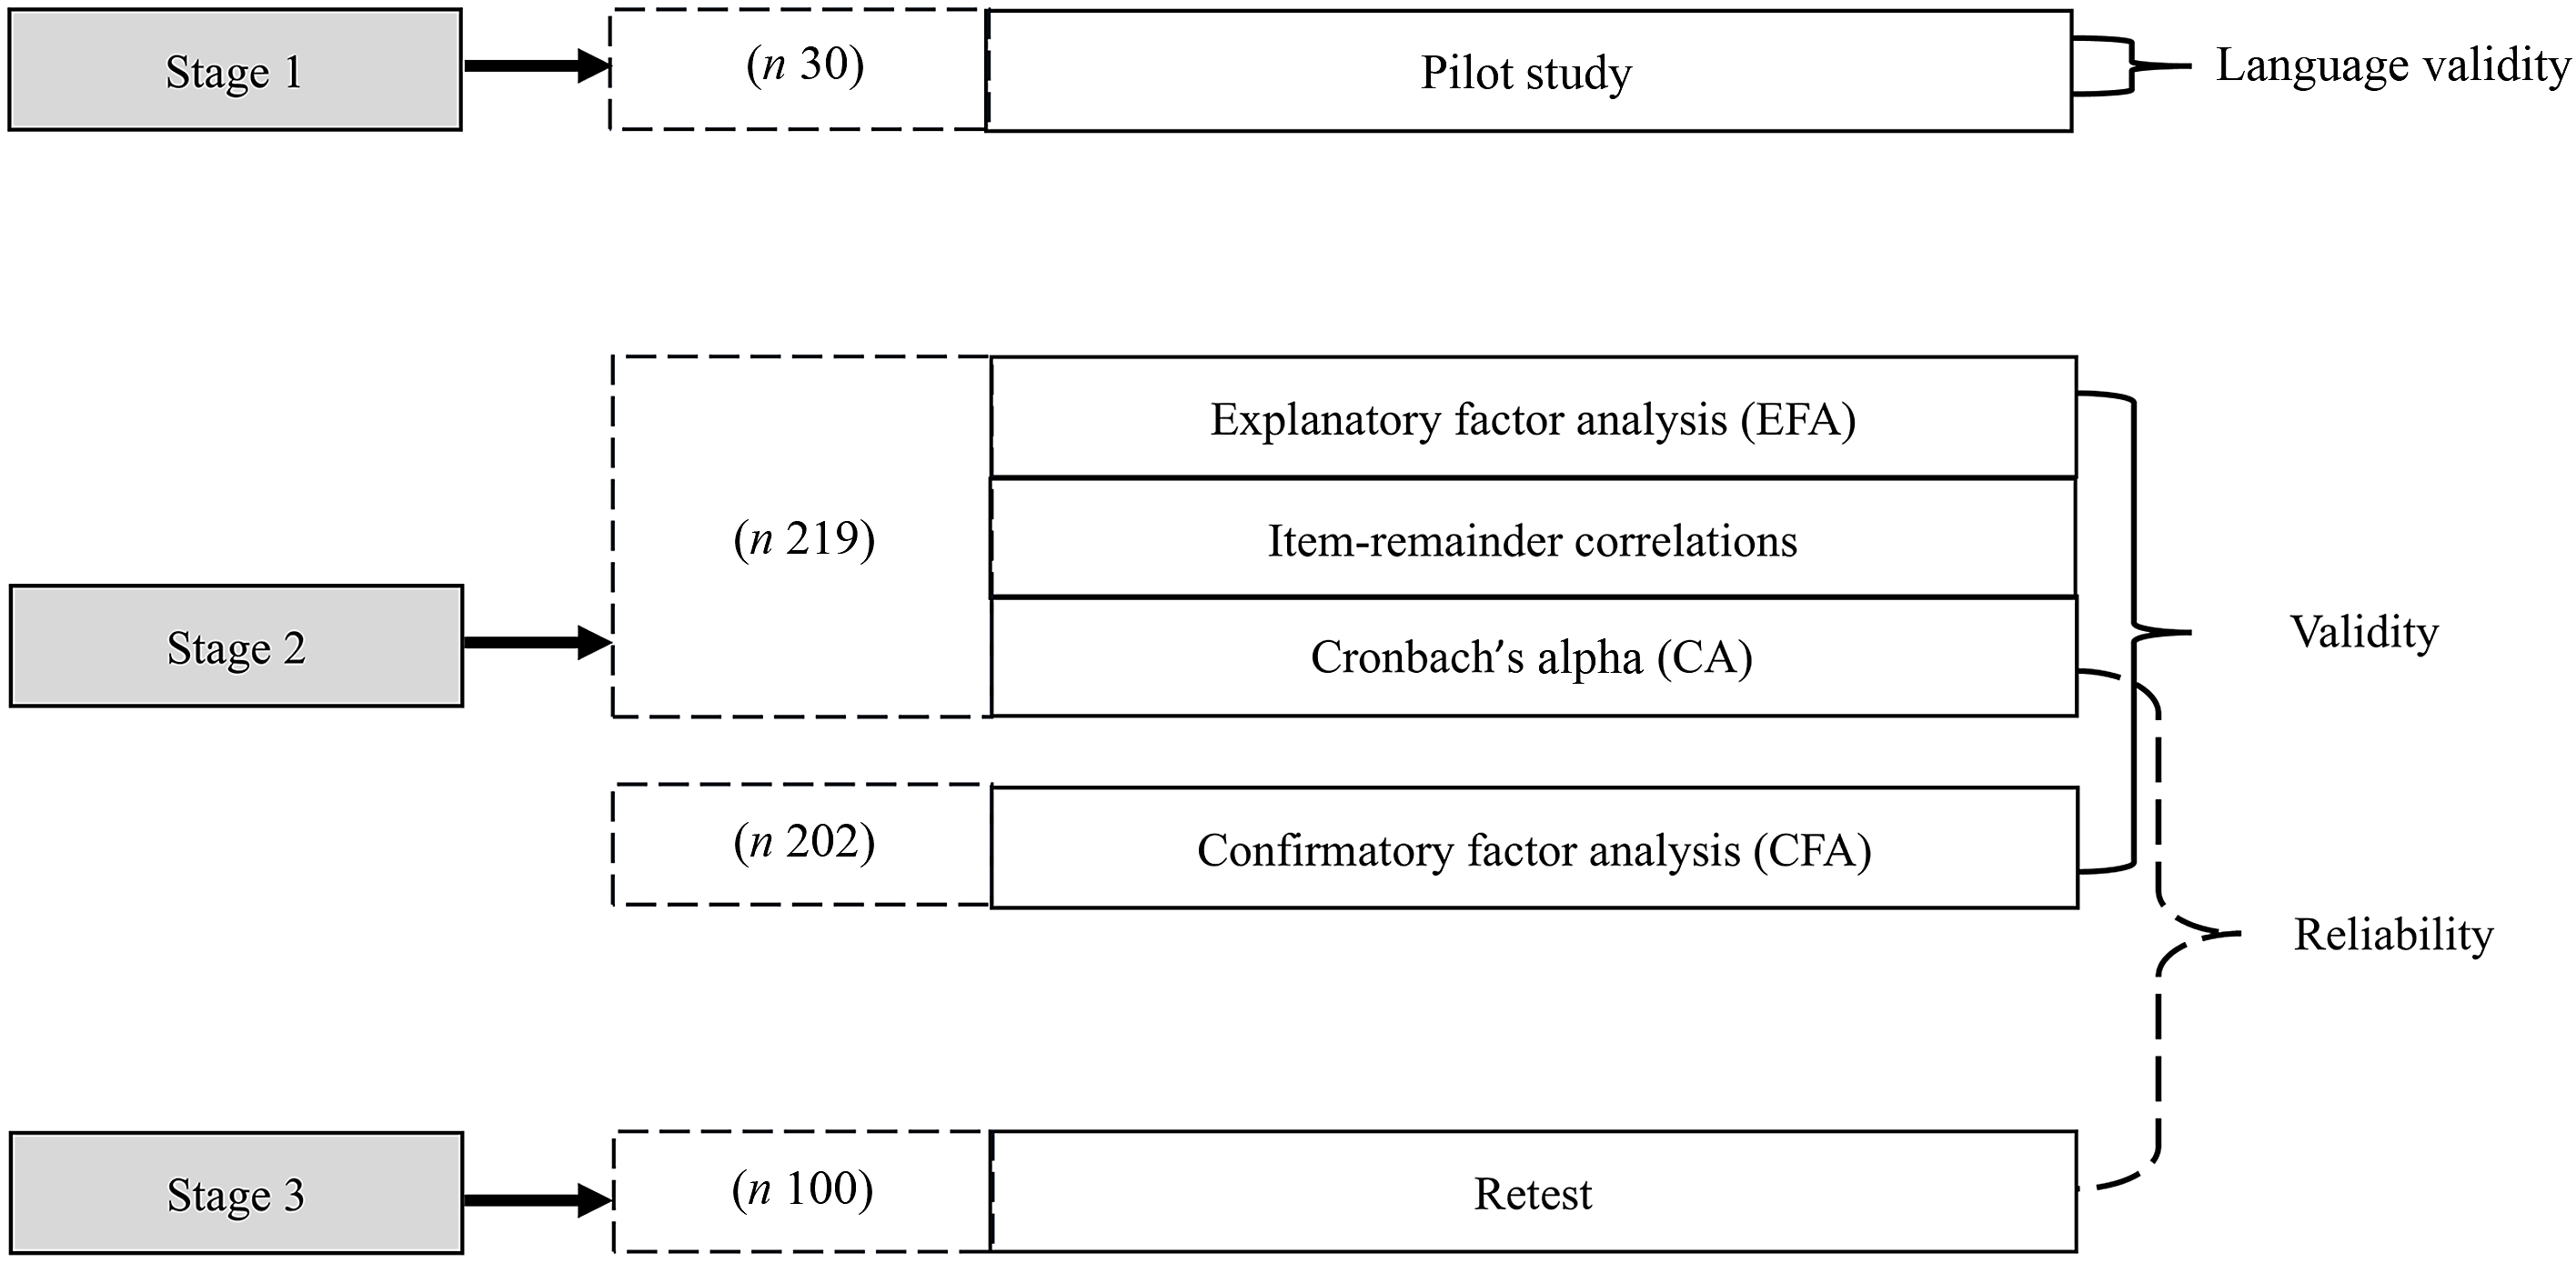
In the first stage, a pilot study was conducted with thirty individuals to test the questionnaire’s intelligibility; these pilot data were not included in subsequent analyses. For the main study, following the recommendation that adaptation studies should have a sample size at least 5–10 times greater than the number of items(Reference Osborne and Costello25), we recruited 421 participants for the second stage, as the questionnaire contained thirty items. In this stage, participants had a mean age of 40·2 (sd 11·76) years and 86·5 % were female. The sample was divided into two independent halves with similar characteristics: the first half (n 219) was used for exploratory factor analysis (EFA) and the second half (n 202) for confirmatory factor analysis (CFA). In the third stage, to evaluate test-retest reliability, the questionnaire was readministered to 100 participants two weeks after their initial participation. These participants had a mean age of 41·1 (sd 12·98) years, and 86 % were female. A flow chart of the study design is provided in Figure 1.
Flow chart of the study design.

This study was conducted according to the guidelines laid down in the Declaration of Helsinki, and all procedures involving human participants were approved by the Ethics Committee of the Nuh Naci Yazgan University (Approval number: 2023/009-013). Written informed consent was obtained from all participants before data collection.
Data collection
Data were collected through face-to-face interviews using a questionnaire consisting of four parts: a socio-demographic data form, anthropometric measurements, a form to measure the amount of wasted food and FWBQ.
Sociodemographic characteristics
In the socio-demographic data form, participants were asked to indicate their gender, age, education level, working status, income level, marital status, number of household members, pet ownership, responsibility for preparing meals, and responsibility for groceries in the household.
Anthropometric measurements
The individuals’ body weight and height information were obtained based on self-reports. The BMI value was calculated by dividing the body weight by the square of the height. The BMI values were evaluated according to the classification established by the WHO. According to this classification, underweight was defined as BMI < 18·5 kg/m2, normal weight as BMI = 18·5–24·9 kg/m2, overweight as BMI = 25·0–29·9 kg/m2, obesity class 1 as BMI = 30·0–34·9 kg/m2, obesity class 2 as BMI = 35·0–39·9 kg/m2 and obesity class 3 as BMI ≥ 40·0 kg/m2(26). In this study, we divided the individuals into two groups: BMI < 25 and ≥25 kg/m2.
Assessments of the amount of wasted food
FWBQ is not intended to make precise assessments of food waste quantity. However, we measured food waste amounts to examine relationships between food wasting behaviours and actual waste quantities. We used a questionnaire adapted from previous studies(Reference Ammann, Osterwalder and Siegrist27,Reference Visschers, Wickli and Siegrist28) . Participants reported their average weekly food waste frequencies and amounts across twelve food groups: fruits, vegetables, potatoes and potato products, breads, other bakery products, cereals, legumes, meat and meat products, poultry, fish and other seafood, dairy products and soups. The frequency scale included five options: every day, 5–6 times a week, 3–4 times a week, 1–2 times a week and never. Waste amounts were categorised as: more than 3 portions (recoded as 4), 2–3 portions (recoded as 2·5), 1 portion (recoded as 1), 1/2 portion (recoded as 0·5) and nothing (recoded as 0). A portion was defined as one handful for solid foods and one Turkish teacup (100 ml) for liquids. Total household food waste was divided by the number of household members to calculate average waste per person.
Food Wasting Behaviours Questionnaire
The FWBQ was developed by Misiak and colleagues(Reference Misiak, Sobol and Sakowski13) to measure consumers’ food wasting behaviours and was validated in the Polish population. The questionnaire consists of five factors with twenty items total: ‘Discarding unpalatable foods’, ‘Buying as needed’, ‘Planning meals’, ‘Sharing food’ and ‘Feeding animals’. Each factor contains four items scored on a 7-point Likert scale (1 = Never, 2 = Very Rarely, 3 = Rarely, 4 = Difficult to Say, 5 = Occasionally, 6 = Very Frequently and 7 = Always). Factor scores range from 4 to 28, with higher scores on the ‘Discarding unpalatable foods’ factor indicating more frequent food wasting behaviours, while higher scores on other factors indicate less frequent food wasting behaviours. The FWBQ does not yield a total score; each factor should be evaluated independently.
The original questionnaire development began with 104 items, which were reduced to twenty items in five factors through factor analysis. For our adaptation study, to guard against potential item loss during the adaptation process, we used the original 104-item pool from the original study and added two items to each factor based on their original factor loadings, bringing our initial item pool to thirty items. The FWBQ, which includes the added items, is presented in online Supplementary Material S1. The Turkish version of FWBQ is shown in online Supplementary Material S2.
Turkish adaptation
The Turkish version of the FWBQ was developed using a forward-back translation method. First, two independent language experts, proficient in both English and Turkish, translated the questionnaire into Turkish. Then the researchers synthesised these translations into a common form. This Turkish version was back-translated to English by two different translators who had not seen the original English version. The back-translated version was compared with the original to ensure conceptual and semantic equivalence.
Six researchers in nutrition and dietetics independently evaluated the translated questionnaire for content and face validity, providing suggestions for improvement. Content validity was assessed using the Davis technique, calculating content validity index values for each item. According to Davis(Reference Davis29), a content validity index threshold of 0·80 is recommended. In this study, content validity index values ranged from 0·83 to 1·00; therefore, no items were deleted, though some were adjusted based on expert feedback. Additionally, a Turkish language expert evaluated the questionnaire’s linguistic appropriateness.
The final version was pilot tested with thirty participants who met the study’s inclusion criteria to assess intelligibility and acceptability. Based on participant feedback, no changes were required.
Validity and reliability
After adapting the questionnaire to Turkish, EFA was performed to evaluate its construct validity. The Kaiser–Meyer–Olkin coefficient was used to evaluate whether the sample size was adequate, and Bartlett’s test of sphericity was used to determine the suitability of the data for factor analysis. The Kaiser–Meyer–Olkin value should be ≥0·60, and the significance level of the Bartlett’s sphericity test should be less than 0·05(Reference Kaiser and Rice30,Reference Shrestha31) .
The EFA was conducted on the first half of the sample with the principal axis factoring and Promax rotation. The parallel analysis method based on factor analysis was used to determine the number of factors. To evaluate the necessity of the items in the questionnaire, the factor loadings obtained as a result of EFA were reported, and the limit for factor loadings was set at 0·30(Reference Güngör32). Following EFA, item analyses (item-remainder correlations and Cronbach’s alpha (CA) if item deleted) were conducted for the remaining items to identify low-performing items and enhance the psychometric quality of the questionnaire.
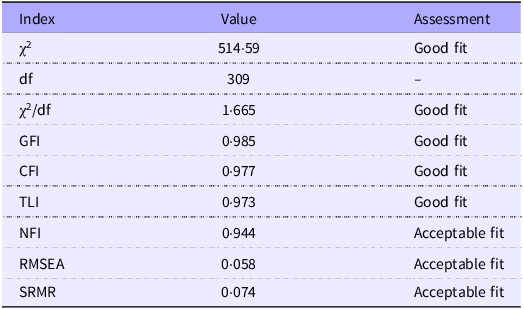
In the second half of the sample, the CFA with the diagonally weighted least squares method was conducted to test the structure provided by EFA without any modifications. χ2/df, comparative fit index, goodness of fit index, Tucker–Lewis index, Normed Fit Index, root mean square error of approximation and standardised root mean square residual values were reported as fit indices. In the evaluation of these fit indices, χ2/df value of < 3; comparative fit index, goodness of fit index, Tucker–Lewis index and normed fit index values of ≥0·90; root mean square error of approximation and standardised root mean square residual values of ≤0·08 were considered as acceptable fit criteria(Reference Erkorkmaz, EtIkan and Demir33).
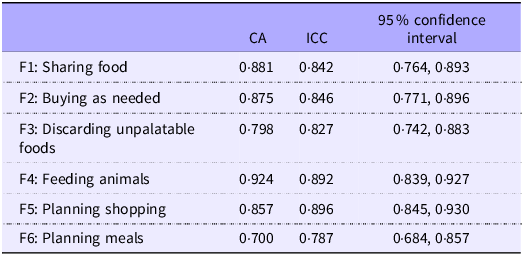
To determine the internal consistency of the questionnaire, CA reliability analysis was conducted. CA coefficient should be at least 0·70(Reference Karakoç and Dönmez34). Additionally, the questionnaire’s reliability was determined by the test-retest method. The test-retest reliability was evaluated with the intraclass correlation coefficient. Intraclass correlation coefficient values within the range of 0·75–0·90 are considered to indicate good reliability(Reference Koo and Li35).
Statistical analysis
Data analysis was conducted using JASP 0·18·3 and IBM SPSS Statistics 27·0. Normality was assessed using the Kolmogorov–Smirnov test. Descriptive statistics were presented as means, standard deviations, frequencies, and percentages. Group differences were evaluated using independent samples t tests. Pearson correlation coefficients were calculated to examine relationships between food waste amounts and FWBQ scores. For all statistical analyses, P < 0·05 was considered significant.
Results
Study population
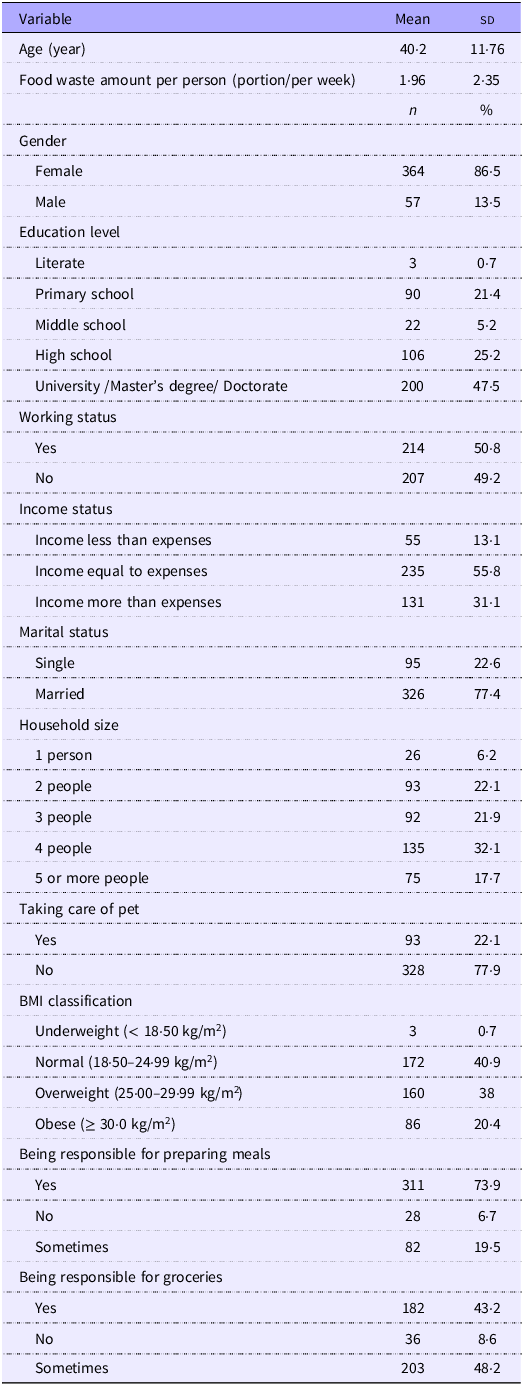
A total of 421 individuals were included in the validity and reliability analysis. The mean age was 40·2 (sd 11·76) years, and 86·5 % of the participants were female. The general characteristics of the participants are shown in Table 1.
General characteristics of individuals (n 421)

Validity and reliability
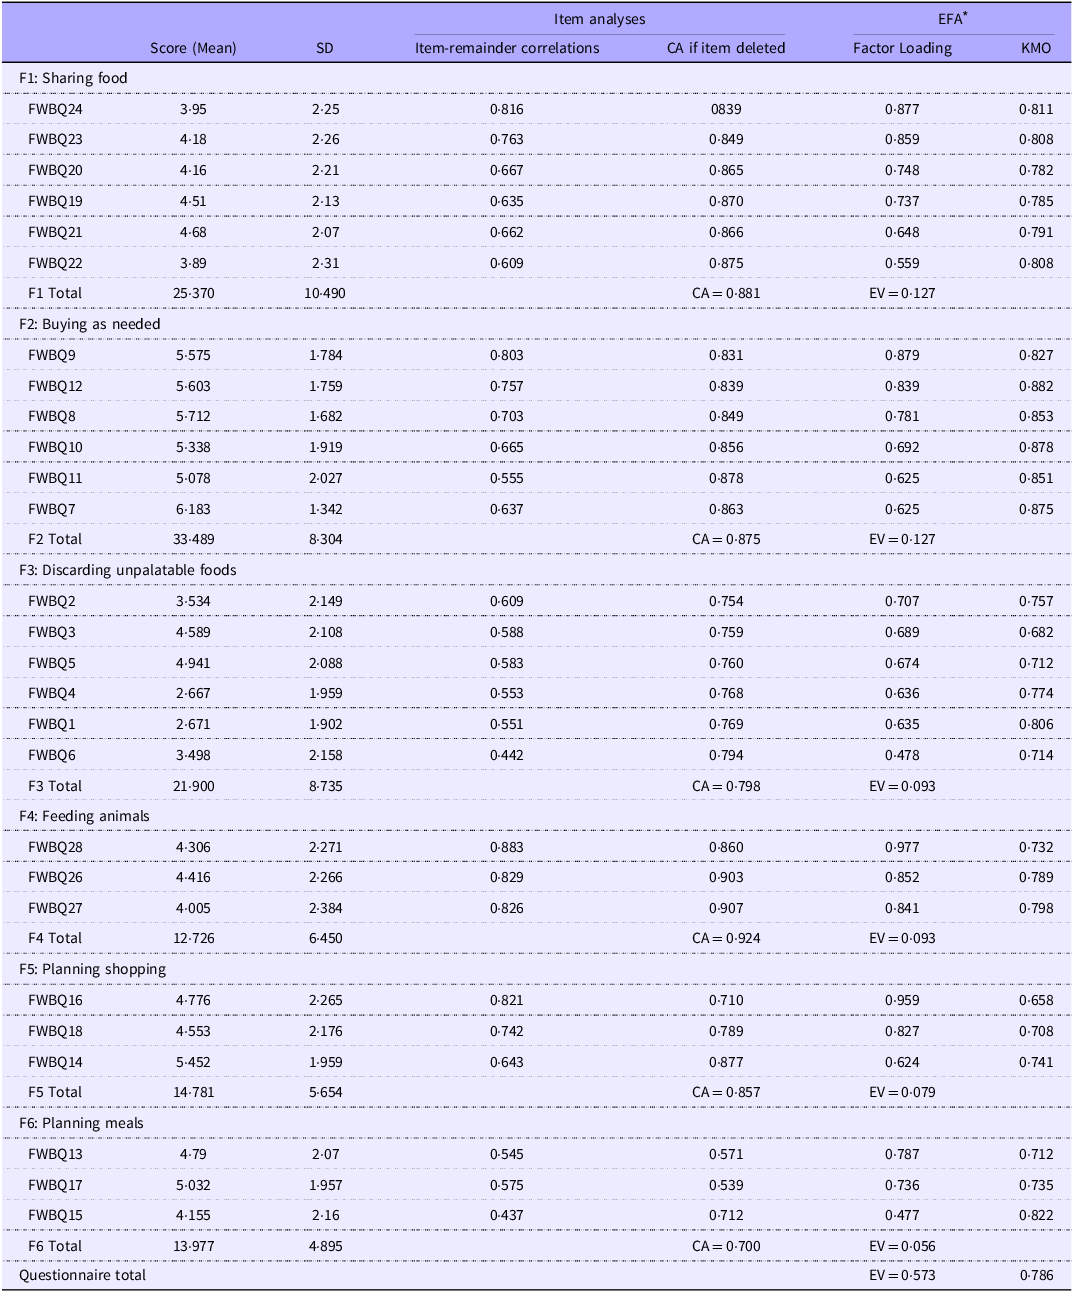
An EFA was conducted to determine how many factors the thirty items in the questionnaire loaded onto and to reveal the underlying factor structure of the questionnaire. Bartlett’s test of sphericity was significant (P < 0·001), and the Kaiser–Meyer–Olkin measure of sampling adequacy was 0·786, indicating that the sample data were suitable for factor analysis. As a result of the EFA, a six-factor structure was identified, and three items (items 25, 29, and 30) were excluded from the questionnaire due to having factor loadings < 0·30. After this stage, the EFA was repeated with twenty-seven items, and the lowest factor loading was 0·477 (the highest was 0·977), with a total explained variance of 0·573. Item-remainder correlations ranged from 0·442 to 0·883. When the CA if the item deleted values were examined, it was seen that the CA value of the factors would not increase if the item was deleted. Therefore, it was decided to retain all items (Table 2).
Item analyses and exploratory factor analyses (n 219)

CA, Cronbach’s alpha; EFA, exploratory factor analysis; EV, explained variance; F, factor; FWBQ; Food Wasting Behaviours Questionnaire; KMO, Kaiser–Meier–Olkin.
* Bartlett test: X2 (df = 351) = 3140·78; P < 0·001.
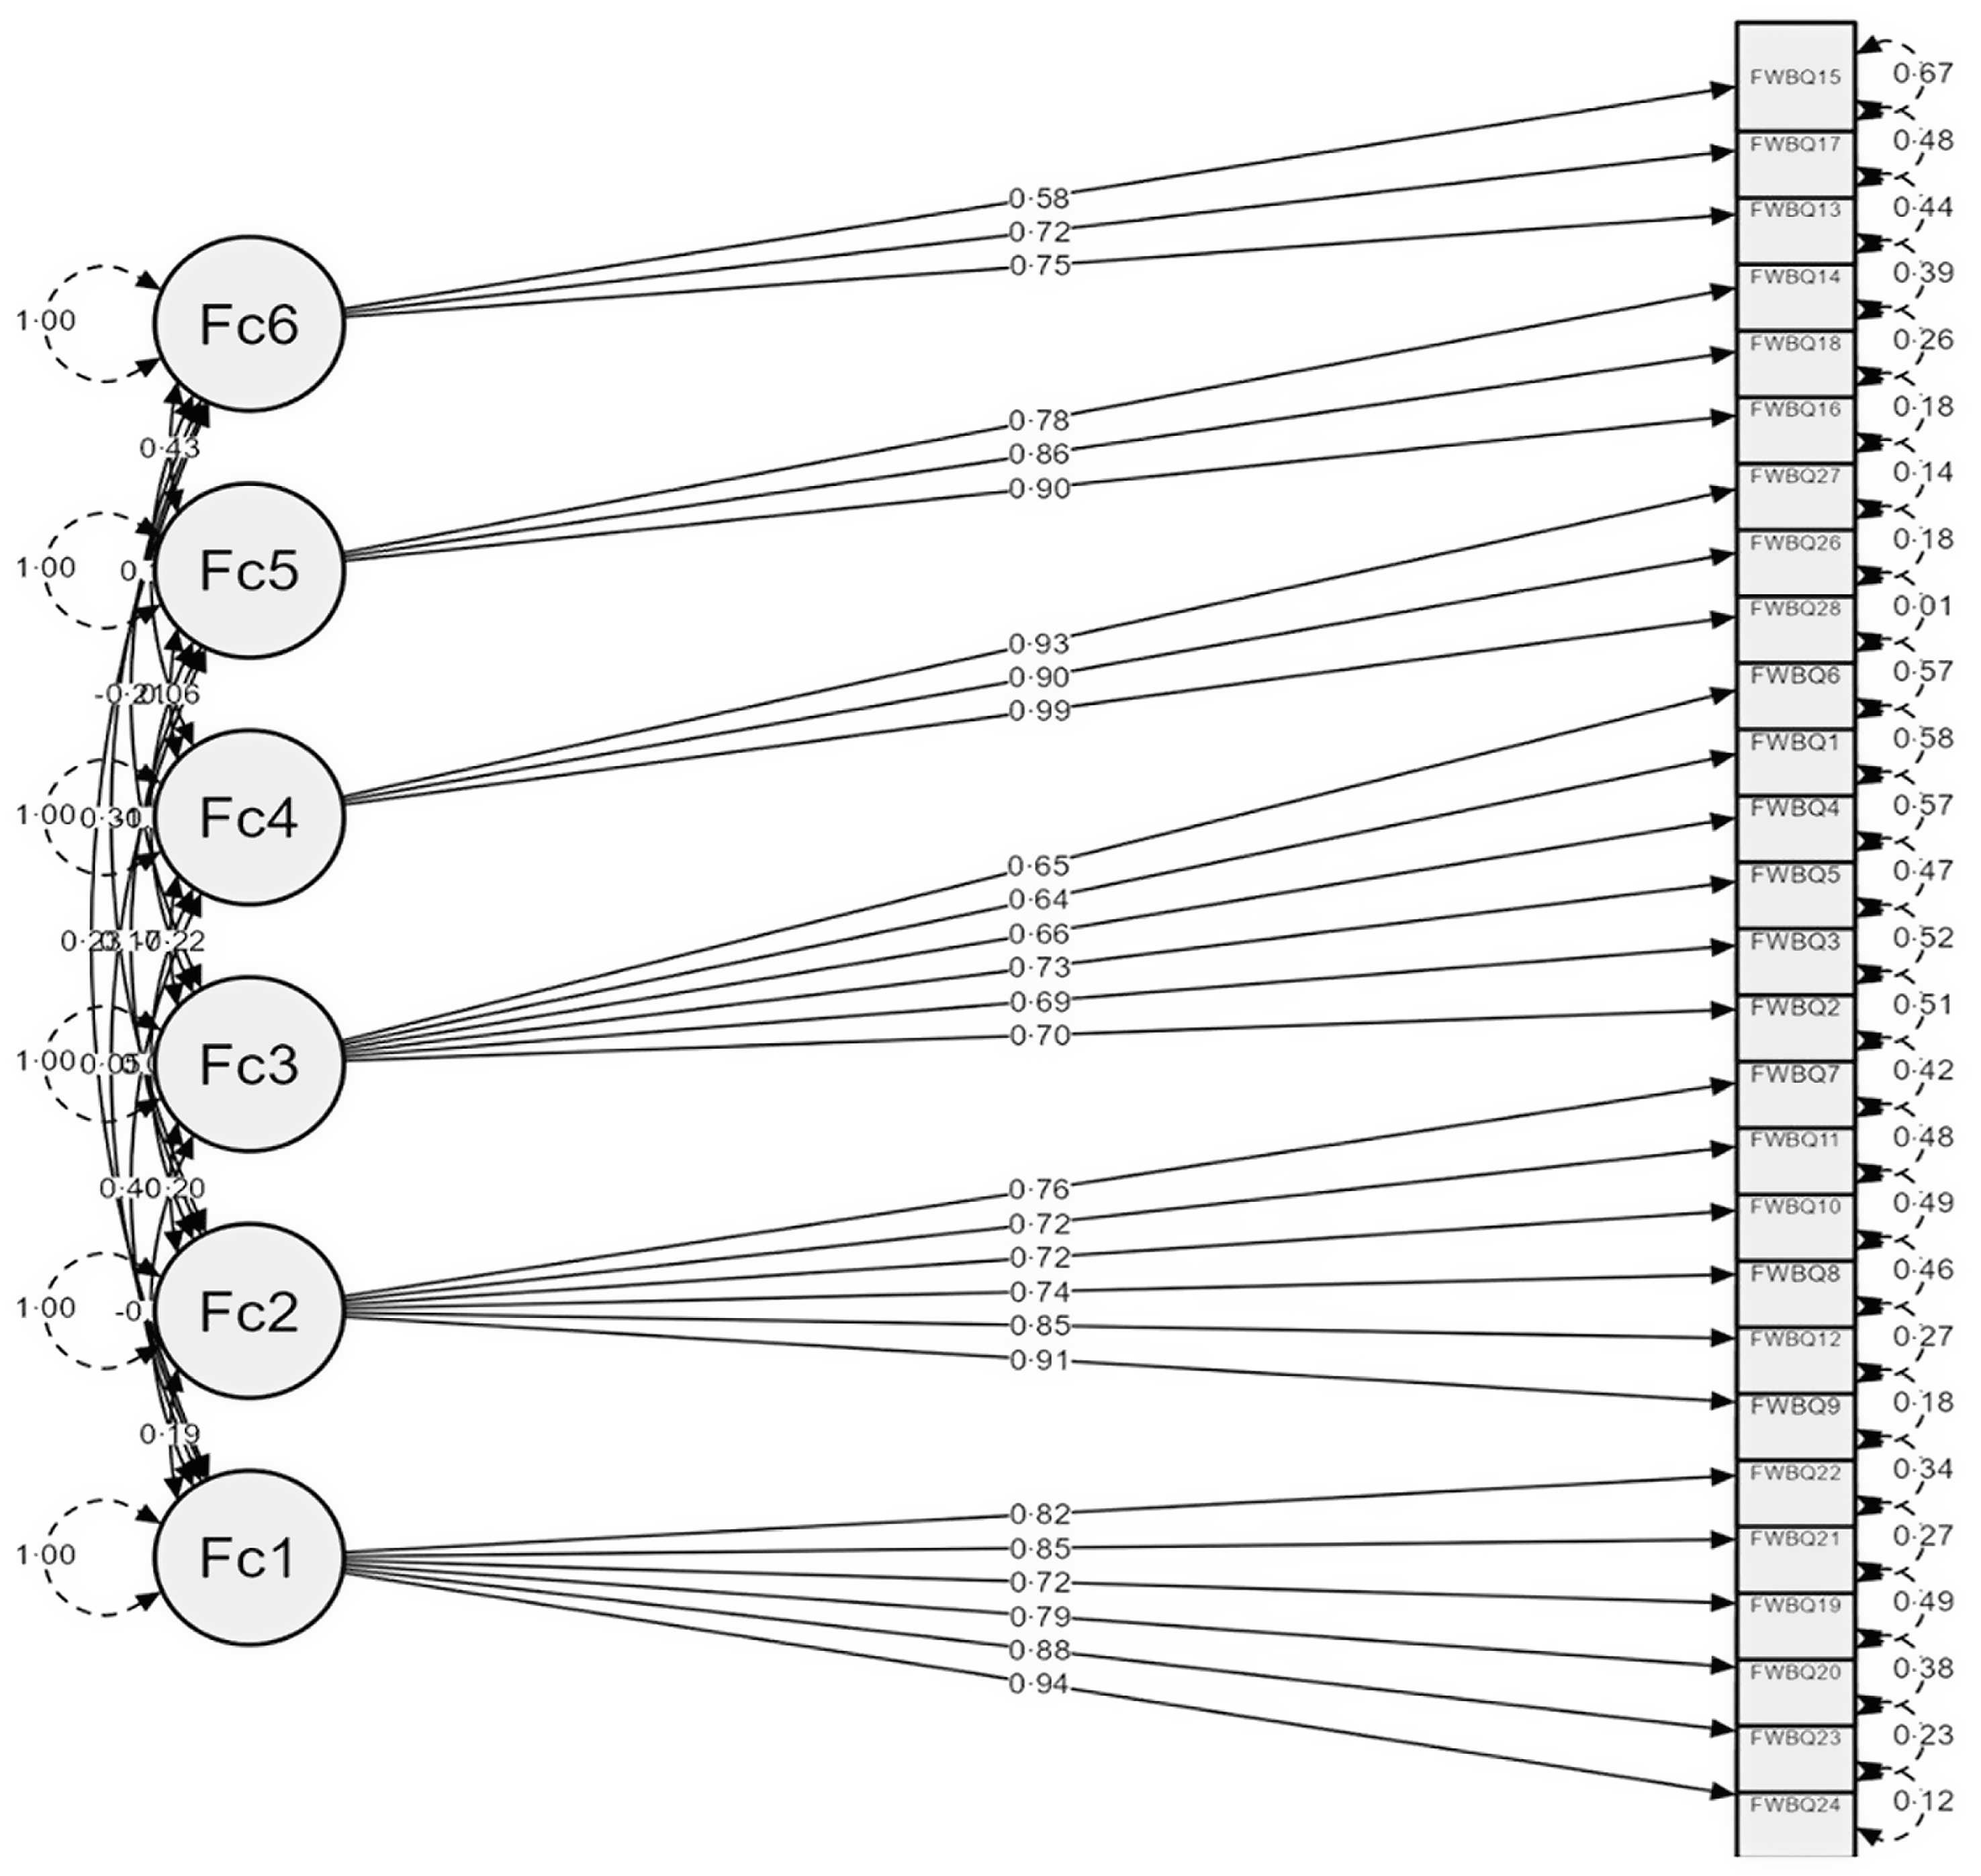
The structure that emerged from the EFA was re-evaluated with CFA without modification (Figure 2), and the χ2/df, comparative fit index, goodness of fit index, Tucker–Lewis index, normed fit index, root mean square error of approximation and standardised root mean square residual fit indices were calculated, as shown in Table 3. According to these results, the values obtained from the questionnaire confirm the acceptability and applicability of the Turkish version of the FWBQ.
Confirmatory factor analysis model of the Food Wasting Behaviours Questionnaire.

Goodness-of-fit indices of the FWBQ models

GFI, goodness of fit index; CFI, comparative fit index; TLI, Tucker–Lewis index; NFI, normed fit index; RMSEA, root mean square error of approximation; SRMR, standardised root mean square residual; FWBQ, Food Wasting Behaviours Questionnaire.
The internal consistency reliability was assessed using the CA reliability coefficient, which ranged from 0·700 to 0·924, indicating that all factors were sufficiently reliable. The intraclass correlation coefficient values for test-retest reliability ranged from 0·787 to 0·896, signifying good reliability for all factors (Table 4).
Reliability analyses

CA, Cronbach’s alpha; ICC, intraclass correlation coefficient.
Exploratory analyses
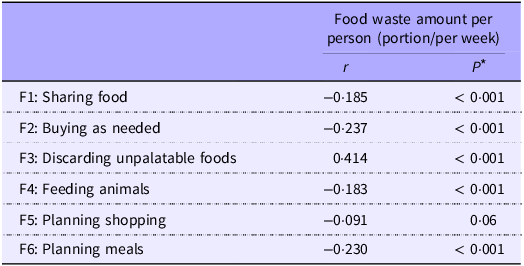
The relationships between the average amount of food waste per person and each factor of FWBQ were examined with Pearson (r) correlation coefficients and interpreted according to the classification proposed by Cohen(Reference Cohen36). A statistically significant relationship was found between the amount of food waste and all factors except the ‘Planning shopping’ factor (P < 0·001). The relationship between the amount of food waste and the ‘Discarding unpalatable foods’ factor was positive and moderate (r 0·414), while weakly negative correlations were observed for the ‘Buying as needed’ (r –0·237), ‘Planning meals’ (r –0·230), ‘Sharing food’ (r –0·185) and ‘Feeding animals’ (r –0·183) factors (Table 5).
Correlation between FWBQ factor scores and food waste amount

* Pearson correlation, P < 0·05.
FWBQ, Food Wasting Behaviours Questionnaire.
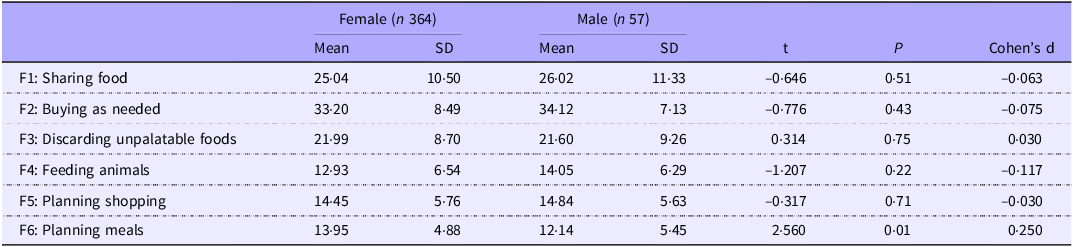
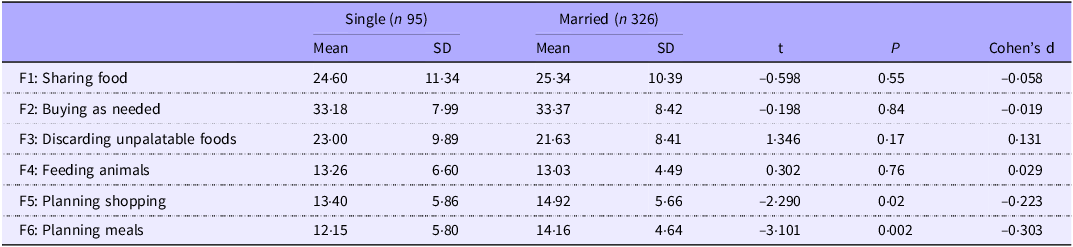
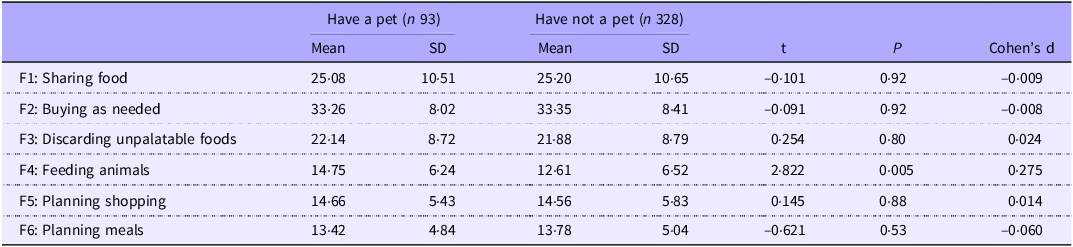
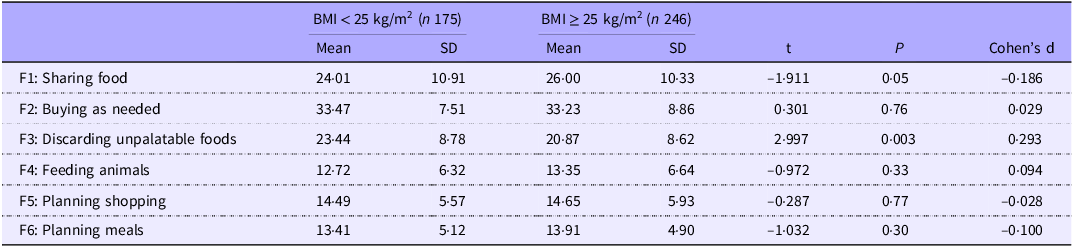
In this study, FWBQ factor scores were compared according to gender, marital status, pet ownership status and BMI to examine whether food waste behaviours varied depending on socio-demographic characteristics. The findings show that women planned meals more frequently compared to men (P = 0·01, Cohen’s d = 0·250) (Table 6). It was also observed that married individuals planned their meals and shopping more than single individuals (P = 0·002, Cohen’s d = –0·303; P = 0·02, Cohen’s d = –0·223, respectively) (Table 7). People who owned pets fed animals with food leftovers more frequently than those who did not (P = 0·005, Cohen’s d = 0·275) (Table 8). In addition, individuals with a BMI ≥ 25 kg/m2 less frequently discarded food due to its unpalatability compared with individuals with a BMI < 25 kg/m2 (P = 0·003, Cohen’s d = 0·293) (Table 9).
FWBQ factor scores by gender

FWBQ factor scores by marital status

FWBQ, Food Wasting Behaviours Questionnaire.
FWBQ factor scores by pet ownership status

FWBQ, Food Wasting Behaviours Questionnaire.
FWBQ factor scores by BMI

FWBQ, Food Wasting Behaviours Questionnaire.
Discussion
In this study, the FWBQ, which measures the food wasting behaviours of consumers, was adapted to Turkish, and validity and reliability studies were conducted. Although various scales exist to evaluate food waste behaviours in consumers in Türkiye(Reference Aydin and Yildirim10,Reference Aydin and Aydin21–Reference Karakas24) , it has been observed that they do not comprehensively measure the range of behaviours needed to compare different categories of food waste. The Turkish version of the FWBQ is the first questionnaire that systematically measures consumers’ food waste behaviours in a comprehensive range in Turkish society. In addition, this study is the first adaptation study of the FWBQ.
The exploratory and confirmatory factor analyses supported a six-factor structure, slightly diverging from the original five-factor solution proposed by Misiak et al. (Reference Misiak, Sobol and Sakowski13). This finding suggests that food wasting behaviours may be conceptualised somewhat differently in Türkiye. Notably, the separation of ‘Planning meals’ and ‘Planning shopping’ into two distinct factors – whereas in the original study they were combined – may reflect cultural or practical distinctions in how Turkish households manage food-related tasks. This split offers a more fine-grained understanding of food planning practices and underscores the importance of cultural adaptation in scale validation.
According to the analysis, the Turkish version of the FWBQ is a valid and reliable questionnaire with six factors and 27 items. In our study, the CA coefficients of the factors were between 0·700 (‘planning meals’) and 0·924 (‘feeding animals’). Similarly to our study, in the original questionnaire, the CA coefficients varied from 0·770 (‘discarding unpalatable foods’) to 0·940 (‘feeding animals’). In line with our findings, the comparative fit index had a good fit, and root mean square error of approximation and standardised root mean square residual had an acceptable fit in the original questionnaire.
The ‘discarding unpalatable foods’ factor describes a group of food waste behaviours occurring from food quality. People who score high on this factor tend to waste food more often because it does not look appetising. Similar to our findings, a study conducted by Misiak et al. (Reference Misiak, Sobol and Sakowski13) with the original questionnaire, it was found that individuals who discard food more frequently because it is unpalatable waste more food significantly. Our findings also showed that individuals with a lower BMI were more likely to discard food because it was unpalatable. In a study conducted by Hoek et al. (Reference Hoek, Pearson and James37), some participants stated that reducing food waste would mean eating more food by not leaving leftovers on their plates. For this reason, individuals may prefer to throw away the food they cannot eat rather than consume it to maintain their body weight.
The ‘buying as needed’ factor is related to behaviours related to purchasing according to individuals’ needs and avoiding excessive shopping. Williams et al. (Reference Williams, Wikström and Otterbring38) showed that 20–25 % of food waste was caused by packaging sizes that were too large to be consumed at once. Another study showed that marketing strategies implemented in markets caused surplus food to be purchased, thus increasing the amount of food waste(Reference Mondéjar-Jiménez, Ferrari and Secondi39). A study conducted in Türkiye found that individuals who shop responsibly and buy as much as they need report less food waste(Reference Aydin and Yildirim10). Similarly, our findings showed that individuals who buy as needed tend to waste less food.
The ‘feeding animals’ factor is related to behaviours related to the use of food scraps and excess food to feed animals. The way leftover food is disposed of also affects the amount of food wasted(Reference Schanes, Dobernig and Gözet7). It has been shown that individuals who recycle and reuse food scraps tend to waste less food than those who do not(Reference Secondi, Principato and Laureti40). On the other hand, it has been found that individuals with high environmental awareness tend to waste less food(Reference Principato, Mattia and Di Leo6). Our findings have shown that individuals who feed animals with leftover food more frequently waste less food. In addition, our findings showed that individuals who took care of a pet fed their animals more with leftover food, similar to the findings obtained in the study conducted by Misiak et al. (Reference Misiak, Sobol and Sakowski13) with the original questionnaire.
The ‘planning meals’ factor includes the frequency of planning meals to be prepared in advance. Meal planning can be an effective way to reduce food waste because it is the act of deciding what food to eat during a specific period(Reference Van Geffen, van Herpen and van Trijp41). Some studies have shown that meal planning is associated with less food waste, similar to our findings(Reference Stefan, van Herpen and Tudoran9,Reference Jörissen, Priefer and Bräutigam42) . Also, our findings are consistent with the study conducted with the original questionnaire(Reference Misiak, Sobol and Sakowski13), which reveals that women plan their meals more frequently than men. This may be because women are generally responsible for preparing meals at home and spend more time in the kitchen. Additionally, our findings showed that married individuals tend to plan their meals more frequently. This may be related to the lifestyles of single individuals, which may cause irregular eating habits(Reference Ganglbauer, Fitzpatrick and Comber43,Reference Lee, Lee and Kim44) .
The ‘sharing food’ factor measures behaviours related to individuals sharing their food with others in order to reduce food waste. Evidence regarding sharing excess food is quite limited in the literature(Reference Schanes, Dobernig and Gözet7). In the current study, it was observed that there was a very weak negative relationship between the food-sharing factor and the amount of food waste per person. Sharing cooked food with others appears to be an uncommon practice. This may be due to concerns that others might perceive the food as unpalatable, a reluctance to expose one’s culinary skills to judgement or fears that shared food could cause illness or discomfort in others(Reference Lazell45,Reference Evans46) .
The ‘planning shopping’ factor includes behaviours such as pre-shopping planning and using a shopping list. Jörissen et al. (Reference Jörissen, Priefer and Bräutigam42) showed that individuals using shopping lists had an approximately 20 % reduction in the amount of food waste. However, in our study, no statistically significant relationship was found between the shopping planning factor and the amount of food waste. Effective communication between household members can help prevent repeat purchases of the same products(Reference Farr-Wharton, Foth and Choi47). The findings obtained in this study show that married individuals tend to plan more shopping. However, in households where more than one person lives, even if individuals plan their shopping, a lack of communication between family members can lead to excess food being purchased, which can increase the amount of food waste. Also, a study stated that the reason why single individuals tend to plan less shopping is because they cannot predict when they will be home and what foods they will need, because they go out more often(Reference Ganglbauer, Fitzpatrick and Comber43).
The present study provides substantial data on the FBWQ. The Turkish version of the FBWQ is the first questionnaire to systematically and comprehensively measure consumers’ food waste behaviours within Turkish society. However, it also has limitations. Due to its cross-sectional design, the results cannot be generalised to the entire Turkish population. As Misiak and colleagues(Reference Misiak, Sobol and Sakowski13) point out, the patterns observed in the results may be specific to the sample and could differ across cultures. Additionally, this study was carried out in a single city, potentially overlooking other regions of Türkiye with distinct cultural characteristics.
Conclusion
In conclusion, the FWBQ, adapted into Turkish, is a valid and reliable questionnaire consisting of six factors and twenty-seven items that evaluate consumer food waste behaviours. Food waste is a major global issue due to its negative environmental, societal and economic consequences, with the majority of food waste occurring at the household level. Therefore, reducing household food waste is a critical priority, and to do so effectively, it is essential to understand the behaviours that drive it.
The FWBQ offers a low-cost and systematic tool for preliminary research on food waste behaviours. It enables researchers to identify specific behavioural patterns that contribute to food waste and to target them through tailored interventions or public campaigns. Notably, the emergence of a sixth factor in the Turkish version – distinguishing between planning meals and planning shopping – highlights the importance of cultural and practical contexts in shaping how food management behaviours are organised. This finding suggests that adaptations of the FWBQ may reveal locally specific behavioural structures, which should be taken into account when designing interventions or conducting cross-cultural comparisons.
This approach helps identify behaviours that can be addressed during information campaigns or other interventions aimed at minimising consumer food waste behaviour. However, further studies are needed to understand how food waste behaviours differ depending on sociodemographic characteristics and how they affect the amount of food waste.
Supplementary material
For supplementary material/s referred to in this article, please visit https://doi.org/10.1017/S0007114525104108
Acknowledgements
The authors would like to thank all the experts who took part in the translation, adaptation and statistical analysis steps and individuals who participated in the study.
This research received no specific grant from any funding agency, commercial or not-for-profit sectors.
G. K.: Conceptualisation, data curation, investigation, methodology, validation, visualisation, writing – original draft. G. A-S.: Conceptualisation, methodology, project administration, supervision, validation and writing – review and editing. O. M. C.: Conceptualisation, methodology, supervision, validation and writing – review and editing. M. M.: Supervision and writing – review and editing.
The authors declare there are no conflicts of interest.
The data that support the findings of this study are openly available in ‘Open Science Framework’ at http://doi.org/10.17605/OSF.IO/AS82K (for peer review: https://osf.io/as82k/?view_only=ac3f26f4c7e24984ac85c8f1c5b85f83).