Implications
The results from this study provide benchmark data for trends in reproductive performance, breeding policy and production performance for herds of different scale and rates of expansion. They show that expanding a herd and managing larger herds present few barriers to achieving satisfactory performance, giving confidence in likely future expansion within the dairy industry.
Introduction
A reduction in total herd numbers and a simultaneous increase in the average size of dairy herds have been a consistent trend over the past decade in many countries within the European Union (EU) and internationally (Hemme, Reference Hemme2007 and Reference Hemme2008). In 2008 to 2009, there were 1.3 million dairy farmers in the 27 EU member states. The population of dairy farmers declined in every member state and among the EU-15 fell by 25.5% (144 400 farmers) between 2003 to 2004 and 2008 to 2009 (Dairy Statistics, 2010). In countries outside of the EU, the trend has been just as dramatic. For example, in New Zealand, the world's largest exporter of dairy products, the number of herds has decreased by 25%, whereas the average herd size has increased by 60% over the past decade (New Zealand Dairy Statistics, 2009). Similar trends have been observed in the US dairy industry (MacDonald et al., Reference MacDonald, O'Donoghue, McBride, Nehring, Sandretty and Mosheim2007). Reform of the EU common agricultural policy, leading to the removal of milk quotas in 2015, is expected to increase the rate of expansion within EU countries as production moves to areas of competitive advantage.
Expanding a herd presents choices in terms of increasing homebred replacements or sourcing animals bred on other farms, as well as the challenges of managing more cows and the associated changes in infrastructure and labour. As herd size expands, the task of the manager changes; human resource, financial, operational, herd management and strategic management skills are most important for successful expansion (Hadley et al., Reference Hadley, Harsh and Wolf2002). Although benefits of scale have been reported for milk production (Oleggini et al., Reference Oleggini, Ely and Smith2001) and milk quality as a result of lower somatic cell count (Norman et al., Reference Norman, Miller, Wright and Wiggans1999; Oleggini et al., Reference Oleggini, Ely and Smith2001), a number of studies have shown increased herd size to be associated with poorer reproductive performance (Oleggini et al., Reference Oleggini, Ely and Smith2001; Washburn et al., Reference Washburn, Silvia, Brown, McDaniel and McAllister2001), higher calf mortality (Gulliksen et al., Reference Gulliksen, Lie, Loken and Osteras2008), poorer hoof health (Wells et al., Reference Wells, Garber and Wagner1999; Smith et al., Reference Smith, Ely and Chapa2000) and a higher rate of involuntary culling (Oleggini et al., Reference Oleggini, Ely and Smith2001).
The objective of this study was to determine trends in breeding policy, reproduction and production performance for spring-calving herds that are characterised according to size and rate of expansion, using Irish data as a model. Like farmers in many EU countries, an increasing number of farmers in Ireland are seeking to expand the scale of their dairy enterprises (O'Donnell et al., Reference O'Donnell, Shalloo, Butler and Horan2009). In 1987, Ireland had 69 000 dairy farms with an average of approximately 30 cows (National Farm Survey Data, 1988); by 2008, this had reduced to 22 000 dairy farms with an average herd size of 55 cows (National Farm Survey Data, 2009). In contrast to the majority of farming systems in Europe, Irish dairy farms are predominantly spring-calving, with cows grazing pasture for between 200 and 235 days depending on the region (Dillon et al., Reference Dillon, Roche, Shalloo and Horan2005). Thus, grazed grass makes a major contribution to the diet of Irish dairy cows. Given the temperate climate and the ability to grow large amounts of relatively low-cost grass, it is predicted that spring-calving herds with a grass-based diet will dominate Irish production systems in the future (Dillon et al., Reference Dillon, Roche, Shalloo and Horan2005). Successful expansion in seasonal-calving systems depends largely on the reproductive performance of the herd, in particular the ability to maintain a compact calving pattern and production. For these reasons, understanding the implications of herd expansion on breeding policy and reproductive performance is important.
In the post-quota era, farm expansion is likely to accelerate. The results of this analysis will aid in determining possible hazards and quantifying risks for future expansion of dairy herds.
Material and methods
The Animal Care and Use Committee's approval was not requested for this study because all data were obtained from the pre-existing database infrastructure operated by the Irish Cattle Breeding Federation (ICBF) database, Bandon, Co. Cork, Ireland.
Data
Performance data from milk recording herds, comprising 1 628 738 lactation records (n = 36 964 herd years) for the years 2004 to 2008 inclusive, were obtained from the ICBF database. The years 2004 to 2008 were chosen to avoid the complications and carry-over effects of an outbreak of foot and mouth disease that occurred in 2001. Only herds with at least 20 cows and present for all 5 years (i.e. 2004 to 2008) of the study period (n = 19 395 herd years) were retained. Herds with <20 cows are highly likely to be mixed enterprises and are not representative of future farms and therefore were excluded. In Ireland, spring-calving farming systems predominate and are predicted to be the most common production system in the future. Therefore, only herds with >80% of cows calving between 15 December and 30 June, inclusive, were retained (mean calving date was day 71 of the year). A total of 775 795 lactations from 2555 herds remained.
Characterisation of herds
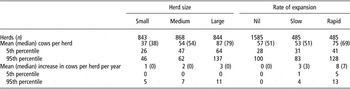
Herds were classified into three groups based on herd size and separately into three groups based on the annual rate of expansion (Table 1). Herds were classified rather than treated as continuous variables in the analysis to avoid the detection of non-linear associations, which were merely an artefact of the size of the data set used rather than a biologically significant phenomenon. Also to minimise the impact of extreme values on the regressions due to the mathematical properties of regression, and to facilitate the determination of whether or not an interaction existed between herd size and rate of expansion.
Number of herds, mean and median cows per herd and mean and median rate of increase (cows/year) for each herd size and rate of herd expansion category

Linear robust regression was fitted to the annual herd size of each herd separately in PROC ROBUSTREG (SAS, 2009). The output from this analysis was an intercept (i.e. predicted herd size in the year 2004) and a linear annual rate of change in herd size for each herd. Herd size, as predicted from the regression, was used to categorise herds as Small, Medium or Large based on the predicted herd size in 2006 (i.e. the middle year of the study period). Categorising herds for rate of expansion was based on the linear regression coefficient. If the linear regression coefficient was not different (P > 0.05) from zero (n = 1585), herds were coded as not expanding (Nil). Herds with a regression coefficient greater (P < 0.05) than zero were divided into two equal groups, each of 485 herds (Slow, increasing at an average rate of three cows/year; Rapid, increasing at an average rate of eight cows/year). Herds with a negative linear regression coefficient (P < 0.05) were discarded from the analysis (n = 130).
Individual animal performance data
Production
Lactation (i.e. 305-day) milk, fat and protein yields were estimated using the standard lactation curve methodology outlined by Olori and Galesloot (Reference Olori and Galesloot1999). Lactation milk yields of <1000 kg or >15 000 kg milk were discarded. Lactations yielding <50 kg or >600 kg fat or protein were also excluded. Following edits, production data on 718 277 lactations were available.
Breed and herd of origin
Breed information was also extracted from the ICBF database. The proportion of Holstein-Friesian (HF, including all crosses between the Holstein and Friesian breeds), Jersey (JE), ‘other dairy’ (Montbéliard, Normande or Norwegian Red) or ‘other breeds’ was determined. A cow was classified as crossbred if the proportion of HF, JE, Montbéliard, Normande or Norwegian Red was less than one; Holstein and Friesian were treated as one breed since there is rarely nowadays a distinction made between them. Breed of calf was defined according to the proportion of HF, JE, ‘other dairy’ (Montbéliard, Normande or Norwegian Red), British beef (Aberdeen Angus, Hereford), Continental beef (Charolais, Belgian Blue, Limousin) or ‘other breed’ (including unknown) proportions. Calves were classified as beef if the calf had any proportion of British or Continental beef. Animals that did not contain any beef ancestry were classified as crossbred (Calf crossbred) if the proportion of HF, JE, Montbéliard, Normande or Norwegian Red was less than one. A cow was classified as homebred if the herd of origin equalled the herd of birth and non-homebred if the herd of origin did not equal the herd of birth. Calf crossbred, cow crossbred, calf beef and homebred were all defined as binary traits in the analysis. Information on cow breed and calf breed on 775, 795 cows and 573 813 calves was available.
Calving performance
Three binary calving performance traits were defined. Calving difficulty is recorded in Ireland by farmers on a scale of 1 to 4: (1) unassisted calving, (2) minor assistance, (3) major assistance and (4) veterinary assistance. Assistance score was dichotomised as no assistance (calving difficulty score = 1) or assistance required (calving difficulty score >1). Similarly, dystocia score was dichotomised as no dystocia (calving difficulty score ⩽2) or dystocia (calving difficulty score ⩾3). Perinatal mortality was defined as occurred or not. Pregnancies ending as an abortion were removed. Dystocia information was available on 558 303 calving events and information on perinatal mortality was available on 645 688 calving events.
Reproduction
A range of fertility variables was derived; they can be broadly classified into interval and binary traits. The four interval traits were as follows: (1) Calving to first service interval (CFS) was defined as the number of days from calving to first insemination and only CFS records between 10 and 250 days were retained; (2) Calving interval (CIV) was defined as the number of days between consecutive calvings. Where no insemination data were available, only CIV records between 300 and 600 days were retained; if CFS was <150 days, then CIV records between 300 and 800 days were retained; (3) age in months at first calving; and (4) day of the year at calving were also determined.
Three binary traits relating to submission rate, calving rate and conception at first service were defined. Submission rate (SR21) in this study was defined as whether or not a cow, irrespective of her calving date, was inseminated in the first 21 days of the breeding season; SR21 for cows not inseminated during a predefined breeding season was set to missing. The start of the breeding season was defined as the date when five multiparous animals were inseminated within the subsequent 14 days. Data on nulliparous animals were not included when defining the start of the breeding season since in Ireland heifers are generally mated earlier than cows. The end of the breeding season was defined as the last service within a herd, which was not followed by a subsequent service within 21 days. Only breeding seasons spanning between 35 and 140 days with at least 20 multiparous cows were retained. The start of the calving season was defined using similar methodology, in that the calving season was deemed to have commenced when five consecutive calving events were within 14 days of each other. Calving seasons were defined separately for heifers and mature animals. Only calving seasons between 35 and 200 days in length were retained and each calving season defined for heifers had to have at least six calving events and at least 20 calving events when defined for pluriparae.
Calving rate in the first 42 days of the calving season (Calv42) was defined as whether or not a cow calved in the first 42 days of the calving season where the start of the calving season was as previously described. As previously mentioned, a separate calving season was defined for primiparae and pluriparae. Calv42 records for cows not calving during a calving season were set to missing with the exception of cows that calved within 14 days prior to the start of the calving season; these cows were deemed to have calved in the first 56 days and this edit was included to account for premature births or short gestations.
Pregnancy rate to first service (PRFS) was defined as whether or not a pregnancy resulted from first service. Since some natural services were not recorded, this trait was only defined within herds that used artificial insemination (AI) and only first service records during the breeding season were used. If the cow had a recorded service within 30 days of the end of the AI breeding period or her date of culling, then she was coded as missing for the respective trait. However, where a second service was recorded, the cow was assumed not to have conceived to first service (i.e. PRFS = 0). Subsequent calving dates, where available, were used to (in)validate pregnancy to first service. Where a HF bull was used to mate the cow, if the cow calved more than 287 days after first service, then the cow was assumed not to have become pregnant to first service; for other breeds of cows calving more than 300 days after first service, they were assumed not to have become pregnant to first service. Pregnancy diagnosis data were also used, where subsequent calving dates were not available, to attempt to determine if the cow became pregnant to first service. Where no subsequent calving date was available, and the cow had no recorded second service, then she was deemed to have become pregnant to first service. Fertility information was available on up to 775 795 animals.
Analyses
Multi-level hierarchical linear and non-linear models were fitted in ASREML (Gilmour et al., Reference Gilmour, Cullis, Welham and Thompson2009) with herd, and cow within herd, as random effects. Year was forced in all models as a fixed effect as well as herd size and rate of expansion and the interaction between herd size and rate of expansion. When the dependent variable was binary, a logit link function was used as well, accounting for the binomial distribution of the data.
Odds ratios were derived for all binary traits by acquiring the exponent of the regression coefficients. Odds ratios compare opposing probabilities to determine the more likely result for a given outcome. An odds ratio >1 implies an increased likelihood of a positive outcome, whereas the opposite is true for an odds ratio <1. To help explain associations between herd size, rate of expansion and performance, an additional analysis was undertaken which also included parity, breed and calving month as fixed effects in the multiple regression model. The effect of accounting for these fixed effects on the significance of the association between herd size and rate of expansion with performance was determined.
Results
The average herd size, excluding those with a negative linear regression coefficient, increased from 48 in 2004 to 57 in 2008. Of the 2555 herds in the analysis, 38% increased in cow number over the 5 years of the study. Rapidly expanding herds were, on average, larger than non-expanding or slowly expanding herds (Table 1). Expressed as a percentage increase, medium and large herds were expanding at a greater rate than small or medium size herds (Table 1).
Milk production
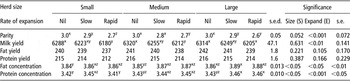
Milk production and parity structure for the different rates of expansion within each herd size category are presented in Table 2. Average parity of the cows in the herd decreased as rate of expansion increased (Nil 3.0, Slow 2.9, Rapid 2.6 years, s.e.d. 0.02, P < 0.001). There was a tendency for the average parity number to decrease with increasing herd size (P = 0.052).
Average parity; milk, fat and protein yield (kg/cow/305-day lactation); and milk fat and protein concentration (%) for each herd size and rate of herd expansion category

x,y,z Means for rate of expansion within herd size category with different letters are significantly different at P < 0.05.
There was no difference in 305-day fat yield and protein yield between herds differing in rate of expansion or herd size. However, a negative association (P < 0.001) existed between 305-day milk yield and rate of expansion (Nil 6307 l, Slow 6242 l, Rapid 6199 l, s.e.d. 41.3, P < 0.01). The association between herd size and milk components differed depending on the rate of expansion (Table 2). Expanding herds had greater milk protein percent (Nil 3.43%, Slow 3.45%, Rapid 3.44%, s.e.d. 0.006, <0.001) and milk fat percent (Nil 3.85%, Slow 3.87%, Rapid 3.87%, s.e.d. 0.011, P < 0.05) than herds that were not expanding. Similarly, medium and large herds had greater milk protein percent (Small 3.43%, Medium 3.44%, Large 3.45%, s.e.d. 0.006, P < 0.05) and milk fat percent (Small 3.85%, Medium 3.86%, Large 3.88%, s.e.d. 0.010, P < 0.05) than small herds. In both cases, although these differences were statistically significant, they were biologically small. After adjustment for parity structure, year, breed and calving month, only the association between rate of expansion and protein percent persisted (P < 0.05).
Breed composition
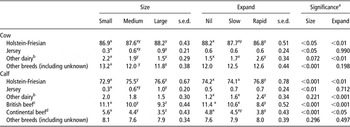
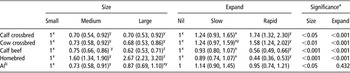
The average HF proportion of the cows in the study population was 87.6%. The proportion of HF was greater for non-expanding herds than rapidly expanding herds (Table 3), although some of this difference may have been due to a larger proportion of the breed fraction being known in non-expanding herds. The average proportion of non-HF dairy breeds combined was <4% for all herd size and expansion categories. HF was the predominant dairy breed of calves born to cows in herds of all herd sizes and expansion categories (Table 3). Although relatively small, the proportion of JE breed in calves increased (P < 0.05) with increasing herd size but did not differ among herds differing in rate of expansion. The proportion of calves born with some beef genetics decreased (P < 0.001) as herd size and rate of expansion increased (28.0%, 22.6%, 19.3%, s.e. = 0.07 for Small, Medium and Large herds, respectively, and 27.1%, 25.7% and 17.4% for Nil, Slowly and Rapidly expanding herds, respectively). Larger herds had lower odds of having beef calves and dairy crossbreds (both cows and calves), but greater odds of having homebred animals compared with smaller herds (Table 4). Rapidly expanding herds had higher odds of having crossbreds (both cows and calves) but lower odds of beef calves than slow or non-expanding herds (Table 4). The likelihood of a cow in rapidly expanding herds being homebred was lower than in non-expanding herds.
The mean breed proportion (×100) of cows and calves in small, medium and large herds and herds that were not expanding, or expanding at a slow or rapid rate

aNo significant interactions between herd size and rate of expansion for any of the variables.
bNormande, Montbéliard, Norwegian Red.
cAberdeen Angus, Hereford.
dCharolais, Belgian Blue, Limousin.
x,y,z Means in a row, within herd size or expansion category, with different letters are significantly different at P < 0.05.
ORs (relative to small herd size and to nil expansion) and 95% CIs in parentheses, for the effect of herd size and rate of expansion on the proportion of homebred animals and crossbred cows and calves in a herd and proportion in-calf to AI

AI = artificial insemination.
aNo significant interactions between herd size and rate of expansion.
bProportion in-calf to AI.
x,y,zMeans in a row, within herd size or expansion category, with different letters are significantly different at P < 0.05.
Reproduction and calving performance
There was no association between either herd size or expansion and calving ease (assistance score and dystocia score). Perinatal mortality was not associated with herd expansion but cows in medium and large herds had lower odds of perinatal mortality than those in small herds. Expanding herds had better fertility than non-expanding herds as shown by an earlier mean calving date, shorter CIV (Table 5), a higher percentage of animals calved in the first 42 days after planned start of calving (Calv42, Nil = 60%, Slow = 64%, Rapid = 64%), a higher submission rate (SR21, Nil = 61%, Slow = 64%, Rapid = 64%) and a higher PRFS (Nil = 47%, Slow = 49%, Rapid = 49%). Animals in expanding herds calved for the first time at a younger age relative to non-expanding herds (Table 5).
Herd size and rate of herd expansion effects on reproductive performance in spring calving herds

aNo significant interactions between herd size and rate of expansion.
x,y,z Means in a row, within herd size or expansion category, with different letters are significantly different (P < 0.05).
Larger herds calved animals at a younger age, calved earlier in the year and had a shorter CIV than smaller herds (Table 5). Larger herds also had a higher submission rate than smaller herds (SR21, Small = 60%, Medium = 63%, Large = 66%), but had a lower proportion of cows calving in the first 42 days (Calv42, Small = 64%, Medium = 63%, Large = 61%; Table 6). Even after accounting for parity, year, breed structure and calving month differences among herds, the associations between herd size and rate of expansion and proportion of animals calved in the first 42 days after planned start of calving, SR21 and pregnancy to first service ratio (herd size only) remained significant.
ORs (relative to small herd size and to nil expansion) and 95% CIs in parentheses, for the effect of herd size and rate of expansion on, proportion animals calved in the first Calv42, SR21 and the PRFS

Calv42 = 42 days after planned start of calving; SR21 = 21-day submission rate; PRFS = pregnancy to first service ratio.
aNo significant interactions between herd size and rate of expansion.
x,y,z Means in a row, within herd size or expansion category, with different letters are significantly different at P < 0.05.
A greater (P < 0.05) percentage of calves were born to AI in small herds compared with medium but not large herds (Small 68%, Medium 61%, Large 65%). The likelihood of perinatal mortality was lower for medium and large herds relative to small herds (Small 4.1%, Medium 3.8% Large 3.7%). When parity, year, breed structure and calving month were accounted for in the model, only the association between herd size and perinatal mortality (P < 0.001) remained.
Discussion
More than one third of seasonal-calving herds in this study were expanding between the years 2004 to 2008. Although this study only included herds participating in milk recording (approximately 25% of Irish herds), the trend of increasing herd size is consistent with national figures showing a gradual decline in herd numbers concomitant with an increase in herd size over recent years (National Farm Survey, 2009). It is also consistent with trends observed in many EU countries (Hemme, Reference Hemme2007 and Reference Hemme2008). Compared to industry data, herds in this study had a lower 305-day milk yield but higher protein and fat concentration (ICBF, 2008), consistent with seasonal grass-based v. year-round milk production systems. This study revealed differences in breeding policy and reproductive performance for both larger herds and those that were expanding, although little difference in production performance was evident between herds differing in size and rate of expansion.
Herd size
Advantages of large herds include the ability to capture efficiencies through better utilisation of capital and labour (O'Brien et al., Reference O'Brien, Gleeson, O'Donovan, Kinsella and Ruane2002). Larger scale producers in Ireland are also in a superior position relative to the smaller scale producers due to their ability to cope with a cost/price squeeze (Thorne and Fingleton, Reference Thorne and Fingleton2005). However, managing more cows requires technical competence and skilled management to maintain production performance. In this study, there was little evidence for herds of different size differing in production performance. The exception was for fat and protein percentage, which further evaluation revealed could be explained by a lower average parity number for larger herds and differences in cow breed. This lack of difference in herd performance is an important result as it shows that managing larger herds in Ireland need not be a barrier to achieving satisfactory production performance. It is recognised that the technical efficiency of the farmer can influence herd performance. Detailed management data (e.g. age of farmer, years in farming, facilities, etc.) were not available for the farms included in this study, and therefore it was not possible to account for management influences in a herd's performance. However, the large number of farms included in the analysis will average out some of these effects, and by focusing on seasonally calving herds, the data are representative of what are likely to be the predominant herds in Ireland in the future (Dillon et al., Reference Dillon, Roche, Shalloo and Horan2005).
More HF and JE breeds were present in the larger herds. Differences in breeding policy were also associated with herd size, with calves in larger herds having a greater proportion of dairy and less of beef breeds. Larger herds had fewer animals that were not homebred, indicating that they were able to produce sufficient replacement animals to maintain the herd size from within their herd.
Reproductive performance is an important element of seasonal production systems, which rely on a compact calving pattern to coincide with maximum pasture growth on the farm and a 12-month production cycle. Many factors contribute to the reproductive performance of a herd; however, animal management plays a key role and poor reproductive performance is often a reflection of overall farm management. For example, poorly grown young stock have poorer reproductive performance (Short and Bellows, Reference Short and Bellows1971) and poor heat detection will result in a low submission and conception rate. It could be expected that managing more cows may lead to poorer reproductive performance as reported by Weigel et al. (Reference Weigel, Palmer and Caraviello2002). However, in this study, there was no evidence that reproductive performance was compromised in larger herds. Data on labour input were not available for the farms, and therefore it is unknown if the ratio of cows to people differed for different herd size categories.
There are relatively few published studies that report industry reproductive performance. Compared to this study, Buckley et al. (Reference Buckley, O'Sullivan, Mee, Evans and Dillon2003) reported higher submission rates (81%) and percentage of cows calving in the first 42 days of calving (57%) for 74 spring-calving dairy herds in which good practices for health and reproductive management were implemented. This difference highlights the gap between average performance and highly managed herds.
The improved reproductive performance with increasing herd size was in contrast to results of international studies, which showed that increasing herd size is associated with poorer conception rates (Washburn et al., Reference Washburn, Silvia, Brown, McDaniel and McAllister2001) and more days open (Oleggini et al., Reference Oleggini, Ely and Smith2001). One major difference between this study and others is the seasonal nature of breeding in Ireland. Although there may be more cows requiring heat detection in larger herds, breeding occurs over a relatively short time allowing staff to focus specifically on this task. In addition, in larger herds, there will be more cows approaching, or in oestrous, at any one time, which will aid the formation of sexually active groups, making it easier to identify cows in oestrous. The lower incidence of perinatal mortality may not only be due to better management of animals leading up to and around calving but may also be due to under-recording of this trait by farmers. Overall, the evidence suggests that reproductive and calving management did not decline as herds got larger.
Rate of expansion
Restricted land area around the milking parlour is a barrier for herd expansion in Ireland (Dillon et al., Reference Dillon, Hennessy, Shalloo, Thorne and Horan2006). However, the stocking rate in Irish dairy herds is relatively low and recent reports have indicated that many herds can increase within their existing land base (O'Donnell et al., Reference O'Donnell, Shalloo, Butler and Horan2009). This study provides evidence that herd expansion has been occurring in recent years among seasonal-calving herds and that rapidly expanding herds tend to be larger. Expanding a herd leads to many choices and challenges for a farmer, such as whether to increase the herd by purchasing replacements from other farms, rearing more replacement calves or retaining animals that would otherwise be culled. Evidence exists that farmers were purchasing stock to increase herd size (i.e. less likelihood of a cow in expanding herds being homebred relative to non-expanding herds) but that larger herds which were not expanding were maintaining herd size with homegrown replacement young stock. Expanding herds had lower parity animals than herds that were not expanding, suggesting that farmers were increasing numbers by introducing young animals into the herd.
Expanding a herd places strain on both infrastructure and staff as management systems evolve to cope with the larger numbers of cows. If expansion is achieved through the purchase of non-homegrown animals, there are risks of disease that can affect survival and performance (Faust et al., Reference Faust, Kinseal and Kirkpatrick2001). However, within this study group, there was no evidence that the reproductive performance of expanding herds was compromised. Despite superior reproductive performance among expanding herds, growth in cow numbers was being achieved by purchasing animals, and therefore farmers were either unable to generate sufficient replacement stock from within their existing herd or wanted to expand more rapidly than could be achieved through breeding and rearing their own young stock.
One way of generating more replacement stock is to use more AI and choose dairy breeds rather than beef sires. In Ireland, it is the norm to use natural mating with a bull from an easy calving beef breed at the end of the breeding season when sufficient dairy breed replacements have been generated. There was no evidence that expanding herds were using more AI, but calves born were more likely to be from dairy breeds, particularly Holstein-Friesian, and less likely to be beef breeds. The higher incidence of dairy crossbreeding in expanding herds is suggestive of a change in breeding policy by these farmers. Extensive research has been undertaken in the past 5 years in Ireland, exploring the potential for dairy cross animals in the pasture-based production system (Prendiville et al., Reference Prendiville, Pierce and Buckley2009), which may have contributed to the recent use of crossbreeding in these herds.
When expanding a herd, it is important to maintain production performance per animal to achieve some of the benefits of scale. The analysis showed that individual cow milk yield declined with increasing rate of expansion, but fat and protein yield were maintained due to a higher fat and protein concentration in the milk. Differences in breed and parity structure among herds were unable to account for the difference in milk composition recorded by the expanding herds. There are many possible explanations as to why this occurred, including a greater proportion of grass in the diet; however, without additional management and feeding data, it is not possible to determine the reason. Overall, the data indicate few associations between herd expansion and production and no adverse effect of herd expansion on production performance.
The relevance of these results as a model for herd expansion in the wider EU must be treated with some caution. Although herd size is similar and many EU countries are observing rapid expansion (Hemme, Reference Hemme2007 and Reference Hemme2008), the dairy production systems can differ considerably from that which is common in Ireland. This mainly relates to the proportion of grass in the diet (Dillon et al., Reference Dillon, Roche, Shalloo and Horan2005) and a focus on seasonal-calving patterns. However, there are implications for dairy herd expansion in the wider EU including the potential for disease transfer as a result of purchasing cattle, a decrease in young stock of beef breeds from dairy herds and a potential decrease in per cow milk yield (but not fat or protein yield) as herds expand and average herd parity declines.
Conclusion
A significant number of farmers expanded their herds between 2005 and 2008 by purchasing cattle. The proportion of dairy sires used in their breeding programme increased with more crossbreeding, although at a low rate. Similarly, the large herds used more dairy sires and fewer beef sires. Both large and expanding herds calved heifers at a younger age. Herd size resulted in few production differences; however, expanding herds had a lower milk yield but not fat and protein yield per cow. Expanding a herd and managing a larger herd appeared to present few barriers to achieving satisfactory reproductive and production performance in seasonal-calving dairy herds.
Acknowledgements
We thank the Irish Cattle Breeding Federation for providing access to the herd recording database.