INTRODUCTION
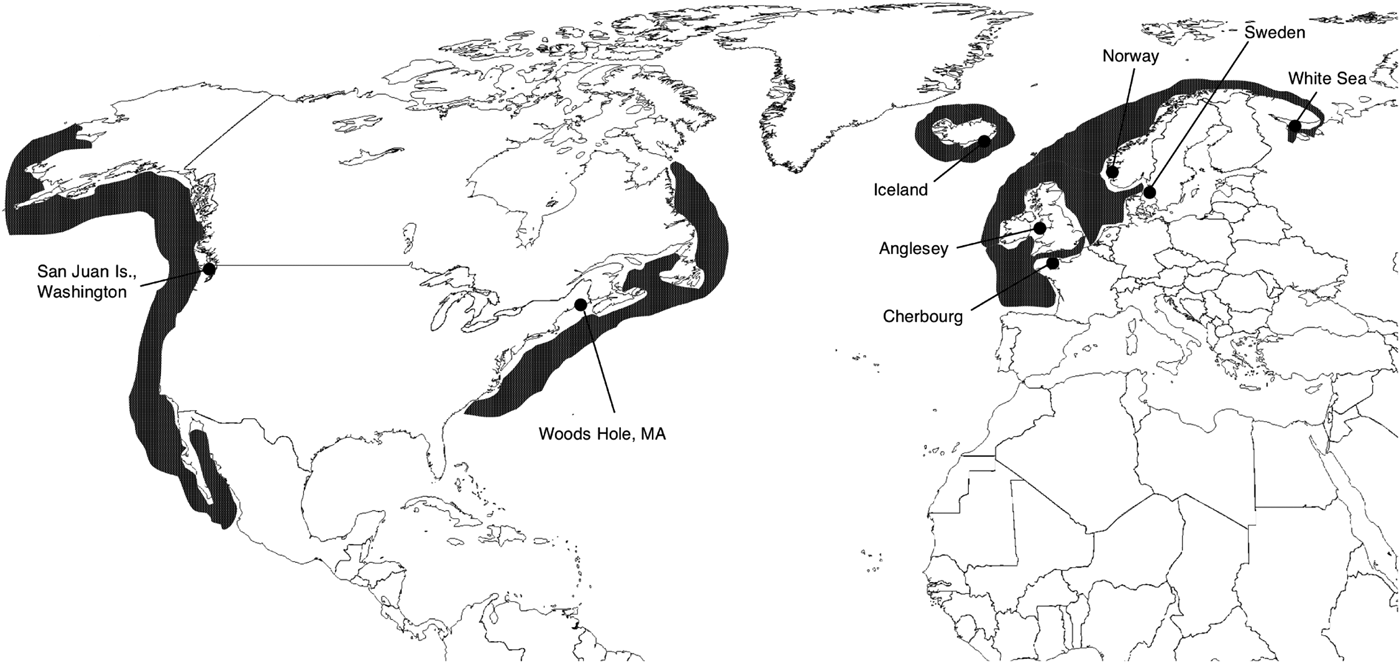
The horse mussel, Modiolus modiolus (Linnaeus, 1758), is a boreal species occurring in the northern hemisphere (Figure 1). Sensitivity to changes in temperature and salinity make horse mussels dependent on deeper, subtidal waters from a few metres down to 100 m of depth, although individuals have been reported at 280 m (Schweinitz & Lutz, Reference Schweinitz and Lutz1976) as well as in the intertidal (Davenport & Kjorsvik, Reference Davenport and Kjørsvik1982). These mussels often form biogenic reefs, which can sustain large numbers of associated invertebrate taxa (Brown & Seed, Reference Brown, Seed, Keegan, Cleidigh and Boddin1977; Ojeda & Dearborn, Reference Ojeda and Dearborn1989). The species is gonochoristic and has a generation time of 5–10 years with sexual maturity reached around 3–8 years of age (Jasmin & Brand, Reference Jasim and Brand1989). Individuals can reach 100 years old, although an age span of 20–35 years is more commonly reported (Anwar et al., Reference Anwar, Richardson and Seed1990). Spawning is sporadic and several years can pass without recruitment. The larval phase can be up to six months, and thus there is potential for long distance dispersal. Temperature requirements for adult specimens have been rather poorly investigated, but available data suggest an optimal growth temperature of around 7–10°C with an upper limit of around 15–20°C (Davenport & Kjørsvik, Reference Davenport and Kjørsvik1982), and a tolerance for below-zero temperatures for an extended period of time (e.g. during winter in the White Sea population; Howland et al., Reference Howland, Pantiulin, Millward and Prego1999).
Modiolus modiolus: map showing the eight sample sites. Dark-grey areas indicate the current species distribution.

Biology of the horse mussel (e.g. the need of subtidal habitat, resistance to freezing) makes the species a suitable indicator of how shallow subtidal marine areas have been affected by climate change, including temperature and sea level fluctuations. As opposed to genetic studies focusing on North Atlantic intertidal species (e.g. Muhlin & Brawley, Reference Muhlin and Brawley2009; Campo et al., Reference Campo, Molares, Garcia, Fernandez-Rueda, Garcia-Gonzalez and Garcia-Vazquez2010; Marko et al., Reference Marko, Hoffman, Emme, McGovern, Keever and Cox2010), patterns of shallow subtidal organisms can reveal information about an extended geographical range and duration of climate changes in the North Atlantic because subtidal organisms were presumably exposed to lower rates of localized extinction from, for example, ice scour. Additionally, such data provide insight to identification of source populations, historical species ranges, climate refugia and probable re-colonization routes. For instance, communities that have experienced prior extinctions are generally poor in species or have populations that are not highly specialized in terms of, for example, competition, predation and disease, and they are the ones most easily replaced (Vermeij, Reference Vermeij1996).
Most intertidal animals in the North Atlantic have limited genetic structure and evidence of recent population expansion (see Wares, Reference Wares and Cunningham2001; Wares & Cunningham, Reference Wares and Cunningham2001). Thus to test this generalization with a subtidal taxon, we investigated intraspecific genetic patterns of M. modiolus using partial mitochondrial gene cytochrome oxidase subunit 1 (CO1) data from several localities in the North Atlantic and one in the north-east Pacific. Results here provide insight as to how glaciation may have impacted near shore marine fauna that are not primarily intertidal in nature.
MATERIALS AND METHODS
Data collection
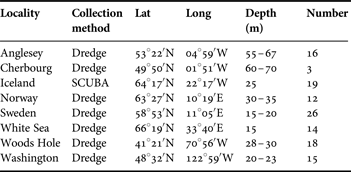
Modiolus modiolus specimens were collected during 2000–2005 in the north-east Pacific (San Juan Island, Washington, USA) and the North Atlantic (Figure 1; Table 1). DNA was extracted from large adductor muscle tissue from a total of 123 individuals with E.Z.N.A® Tissue DNA Kit II (200) from Omega Bio-Tek and then stored at −20°C. The mitochondrial cytochrome oxidase subunit 1 (CO1) gene was amplified using the LCO 1490/HCO 2198 (Folmer et al., Reference Folmer, Black, Hoeh, Lutz and Vrijenhoek1994) primer combination and standard recommendations of Illustra PuReTaq Ready-To-Go PCR Beads kit from GE Healthcare. Polymerase chain reactions (PCR) were run initially for 5 min at 95°C followed by 40 cycles of (95°C 40 s, 45°C 45 s, 72°C 30 s), and ended with 72°C 5 min. Completed PCR-reactions were purified with Qiagen™ Qiaquick Kit. Sequencing was performed by the genetic service facilities of Macrogen (Seoul, Korea) using the same primers as for PCR. Sequences were proofread in SeqMan, saved in EditSeq-format, aligned in MegAlign 5.51 (DNASTAR Inc.) with Clustal W implementation (Thompson et al., Reference Thompson, Higgins and Gibson1994), and confirmed by eye. Further editing of PHYLIP and NEXUS format files for subsequent analyses was performed in MacClade 4.07 (Maddison & Maddison, Reference Maddison and Maddison2005). The aligned data set is deposited as a population study at GenBank with haplotypes Mo1-Mo52 under Accession numbers KC119336–KC119387, respectively.
Modiolus modiolus. Collection information.
Genetic variation and population analyses
We applied a statistical parsimony algorithm (Templeton et al., Reference Templeton, Crandall and Sing1992) in TCS v.1.21 (Clement et al., Reference Clement, Posada and Crandall2000) to reconstruct genetic relatedness among haplotypes as a network. MrModeltest2 (Nylander, Reference Nylander2004) was used to determine the most appropriate model of nucleotide substitution as judged by the Akaike information criterion (AIC). Genetic statistics were conducted in DNAsp v.4.0 software (Rozas & Rozas, Reference Rozas and Rozas1999), and Arlequin software v.3.1 (Excoffier et al., Reference Excoffier, Laval and Schneider2005). We used the ratio of non-synonymous and synonymous substitutions, dN/dS, to test for positive selection and Tajima's D statistic (Tajima Reference Tajima1989) for selective neutrality. Fu and Li's F-statistic (Fu & Li, Reference Fu and Li1993) was used to test for deviations from a constant population-size. Further, we estimated haplotype diversity (Hd) and nucleotide diversity (π). Using only populations showing expansion (as judged by Tajima's D and Fu and Li's F statistics), the time (t) of onset of population expansion was inferred from tau (τ) as estimated from a mismatch analysis as t = τ/2u (Rogers & Harpending Reference Rogers and Harpending1992), where u = m Tµ (m T = number of nucleotides investigated, µ = mutation rate nucleotide-site−1). Confidence intervals of τ and the sum of squared deviation, which estimates the validity of the assumed stepwise expansion model, were generated by a parametric bootstrap (10,000 replicates). The raggedness statistic (r) that measures the smoothness of the mismatch distribution (Harpending, Reference Harpending1994), and its significance were also calculated. In population expansion calculations based on τ from the mismatch analysis, we used the hitherto estimated range of the CO1 gene divergence rates of 1–5.1% MY−1 for a number of marine bivalves (Marko & Moran, Reference Marko and Moran2002; Luttikhuisen et al., Reference Luttikhuisen, Drent and Baker2003; Won et al., Reference Won, Young, Lutz and Vrijenhoek2003). In addition, we also estimated divergence rates in M. modiolus for different codon positions in the Atlantic clade alone (see below), calibrated with the estimation of the trans-Arctic interchange based on Astarte bivalves of 5.32 million years ago (MYA) (Gladenkov et al., Reference Gladenkov, Oleinik, Marincovich and Barinov2002). Because this is considered one of the earliest stages of the Bering Strait opening, our calculations will represent minimum estimates of nucleotide change.
Population pairwise FST values were estimated between all sample sites (10,000 permutations for significance testing) with Tamura–Nei distance implementation (given by MrModeltest2, results not presented). Correlation analysis (Mantel test) was performed between the estimated FST values and the geographical distances in kilometres between all Atlantic sample sites (the Pacific site was too divergent be meaningful in the Mantel test). Distances were estimated by using the ruler function in Google Earth software (http://earth.google.com/) by tracing coastlines with shortest distances trajectories between sampling sites.
RESULTS
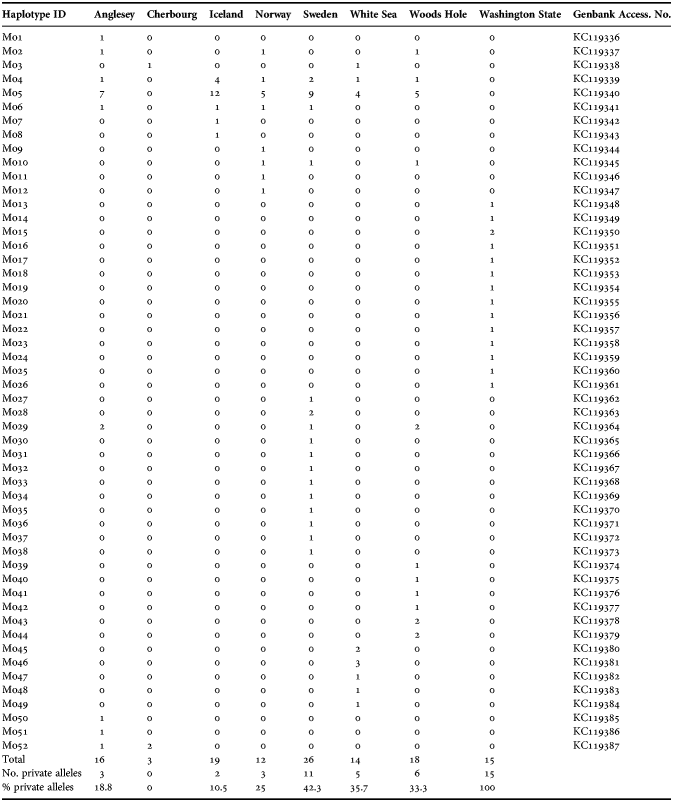
The aligned data set consisted of 598 bp (no indels present) for 123 individuals of Modiolus modiolus. Out of 98 (16.4%) variable sites, 70 (11.7%) sites were parsimony informative and a total of 70 synonymous and 31 non-synonymous changes were found (see Appendix). A total of 20 of the 31 non-synonymous changes were found in the Washington sample alone. Within each ocean basin, no more than five amino acids were different between any two individuals. The 52 haplotypes identified possessed uncorrected differences of 0.17–11%. TCS analysis with a 95% cut-off value produced two separate networks, one representing Pacific samples and one representing all Atlantic samples. No shared haplotypes were recovered between the Pacific and Atlantic (Figure 2; Table 2). From here on, we will refer to these two networks as the Pacific clade and the Atlantic clade. We found weak spatial genetic structuring in the Atlantic clade, seen as large, deeply nested haplotypes comprising all or most of the sample sites, but we also found a considerable number of private haplotypes. We chose to analyse the Pacific and the Atlantic samples separately where appropriate, to avoid biased results because of the apparently old separation between the two clades.
Modiolus modiolus: TCS parsimony haplotype network. Legend denotes the different sample sites shown in Figure 1. Each circle represents a unique haplotype and shows the haplotype ID (2; Appendix). The relative sizes of circles indicates number of included specimens, which is also shown above the haplotype ID (e.g. 42/Mo5). An empty line connecting haplotypes represents a single mutational change; each black dot on a line represents one mutational change (a missing intermediate specimen). The 95% connecting limit was estimated to 21 steps. *, indicates one mutational change between the Mo47 haplotype and a missing intermediate.
Modiolus modiolus: haplotypes recovered at each sampling site. Private alleles are totalled.
Statistics relating to nucleotide and haplotype diversity and mismatch analyses are given in Table 3. Variable nucleotide sites within the Pacific clade (0.17–3%) were greater than in the Atlantic clade (0.17–1.50%). Nucleotide diversity ranged from 0.0021–0.0045 in the Atlantic (Iceland/Anglesey–White Sea), to 0.0127 in the Pacific sample. When analysed as a single sample, the Atlantic clade had a haplotype diversity of 0.837 (SD 0.034), and a nucleotide diversity of 0.0033 (SD 3.1·10−4). Sweden, the White Sea and Woods Hole display the highest haplotype diversities, while Iceland had the lowest value. Compared to Atlantic populations, the Pacific clade has all private alleles (100%) and all haplotypes were represented by single individuals (except for the Mo15 haplotype represented twice). This pattern stands in stark contrast to the Atlantic network illustrating a ‘star shape’ network with several singletons radiating from the two major and widely shared haplotype groups Mo4 and Mo5 that were found in all the Atlantic populations except Cherbourg (Figure 2; Table 2). For Mo4 and Mo5, the Icelandic population has a proportionally larger number of specimens represented while the White Sea population had the lowest.
Genetic statistics and results of the mismatch analysis for the inferred populations.

N, number of sampled specimens; h, number of haplotypes; Hd, haplotype diversity; π, nucleotide diversity.
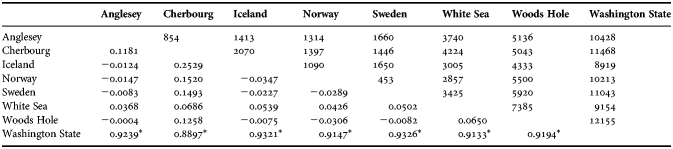
No positive selection was revealed by dN/dS values (0.14 and 0.16 for the Atlantic and Washington group, respectively). Tajima's D-value was not significant for separate populations, but highly significant for the Atlantic as a whole (−2.40; P < 0.001). The Pacific sample did not have a significant D-value (−1.41; P = 0.071). Fu and Li's F statistic was only significant for the Atlantic clade (−4.34; P < 0.05), demonstrating a deviation from the Wright–Fisher model of a constant-sized population (Hartl & Clark, Reference Hartl and Clark1997). The mismatch analysis showed an onset of population expansions in the Atlantic, based on the third codon position divergence rate, of around 26 KYA, τ-value of 1.45 (95% CI 0.69–3.14). Previously published divergence rates roughly conform to our estimates (Table 4). We chose to use the third codon position divergence rate since it is least prone to selection as most mutations are synonymous, but in Table 4 we also present results from the second codon position, for comparison. The raggedness statistic and the sum of squared deviation of the mismatch analysis were both non-significant for all populations (P ≫ 0.05). Analyses generated highly significant FST values for the Washington clade as compared to all other sites (Table 5). The Mantel test of correlation between pairwise population FST values and geographic distance was clearly non-significant between Atlantic populations (−0.076; P = 0.490).
Approximate divergence rate estimates for the CO1 mtDNA gene in the Atlantic clade alone based on different codon positions and calibrated at the trans-Arctic interchange 5.32 MYA. Results are compared to previously published estimates for bivalves and the subsequent times of invasion based on the Atlantic τ-value from the mismatch analysis are presented. Finally, an estimate of the time needed for the Atlantic clade to acquire the found 8–11% divergence from the Pacific clade is shown. KYA, thousand years ago; MY, million years; MYA, million years ago.
*, Won et al., Reference Won, Young, Lutz and Vrijenhoek2003; **, Luttikhuisen et al., Reference Luttikhuisen, Drent and Baker2003; ***, Marko & Moran Reference Marko and Moran2002. †, here we use the mean value of 1.5.
Genetic structure analysis showing population pairwise FST values (below diagonal) with Tamura–Nei distance implementation. Above diagonal shows geographical distance between sample sites (km) used in the Mantel test.
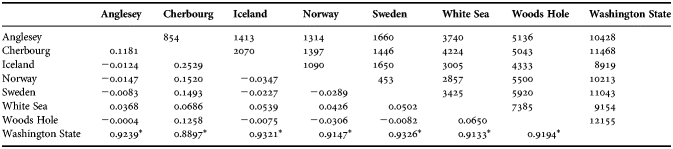
*, shows a significant P-value (<0.01) estimated with 10, 000 permutations.
DISCUSSION
Modiolus modiolus samples from the north-east Pacific and the North Atlantic are genetically distinct, forming two separate clades with no shared haplotypes. The Pacific population from Washington displays considerably higher haplotype and nucleotide diversity as compared to the Atlantic, suggesting a more recent origin for the latter population. This finding is consistent with time estimates in Table 3 that indicates the expansion in diversity of the Pacific samples started roughly 132 KYA where as all such dates in the Altantic are less than 50 KYA. Importantly, this estimate is based off a single Pacific locality, San Juan Island, Washington, and is thus likely a significant underestimate of Pacific diversity. Thus, the Pacific populations likely coalesce at a much earlier date then indicated here.
Given these considerations, M. modiolus likely expanded from the Pacific into the Atlantic. Similar patterns of Pacific-to-Atlantic expansion of species are recorded from fossil data for a great number of marine invertebrate taxa (Vermeij, Reference Vermeij1991; Cunningham & Collins, Reference Cunningham, Collins, Schierwater, Streit, Wagner and DeSalle1998; Luttikhuisen et al., Reference Luttikhuisen, Drent and Baker2003). Based on fossil evidence, the horse mussel is estimated to have invaded the North Atlantic basin from the Pacific around 3 MYA–125 KYA, with a population increase during Late Pliocene (2 MYA) peaking at Early Pleistocene (1.5 MYA), but declining in Late Pleistocene (20 KYA) (Janssen et al., Reference Janssen, Peeters and van der Slik1984; Vermeij, Reference Vermeij1989). Using divergence estimates for the CO1 third codon position, we calculated that M. modilus would have taken roughly 2.6–3.5 MYA to reach the 8–11% divergence observed between Atlantic and Pacific populations. This estimate is concordant with earlier estimates of bivalve and marine invertebrate divergence rates for the CO1 gene (Table 4). Thus genetic connectivity between Pacific and Atlantic populations appears to have been severed around the Pliocene/Pleistocene boundary (or just before) in agreement with the fossil data. The absence of genetic connectivity is further supported by the lack of shared haplotypes between the two oceans (but more Pacific sampling is needed).
In contrast, the Atlantic star-shaped network is indicative of relatively recent and rapid range expansions (Avise, Reference Avise2001). Here, shared haplotypes Mo 4 and Mo 5 (found at all Atlantic sites except Cherbourg) are central and nested in the network (Figure 2). The sampling of deeply nested Atlantic haplotypes throughout the North Atlantic suggests a recent range expansion and migration across the region, i.e. the ‘leading edge model’, resulting in low overall genetic diversity, as opposed to a sequential colonization by founder groups, i.e. the ‘stepping-stone’ model (Hewitt Reference Hewitt2000). This conclusion is bolstered by: (1) the non-significant raggedness and sum of square statistic from the mismatch analysis that indicate a recent demographic expansion (Rogers & Harpending, Reference Rogers and Harpending1992), or a range expansion with high levels of individuals migrating between demes (Ray et al., Reference Ray, Currat and Excoffier2003); (2) both Fst estimates and Mantel tests within the North Atlantic reported no significant differences between populations (Table 5); and (3) estimated onset of population expansion times varied only marginally across the Atlantic (Table 3) reflecting dispersal of individuals close in time.
Our results show several private haplotypes, proportionally highest in Sweden and Woods Hole localities (~42%), followed by the White Sea (~36%) (Table 2; Figure 2). These locations also have the highest observed genetic diversity in the Atlantic (Table 3) indicating that populations may have been refugia, close to refugia, or at least source populations for the Atlantic population expansion. In general refugia in the North Atlantic (e.g. Dahlgren et al., Reference Dahlgren, Weinberg and Halanych2000; Addison & Hart, Reference Addison and Hart2005), should display a higher proportion of unique haplotypes (Wares, Reference Wares2002; Vermeij, Reference Vermeij2005) with other areas in which a species have been expatriated should have a lower genetic diversity. However, Maggs et al. (Reference Maggs, Castilho, Foltz, Henzler, Jolly, Kelly, Olsen, Pereze, Stam, Vainola, Viard and Wares2008) noted that low genetic diversity alone can be unreliable as an indicator of recently recolonized areas, because of issues like bottlenecks. Also, areas with high genetic diversity might be secondary contact zones instead of refugia, as seen in the coastal ice-cream cone worm Pectinaria koreni (Jolly et al., Reference Jolly, Viard, Gentil, Thiebaut and Jollivet2006).
In the context of the present data, the White Sea has previously been hypothesized to host refuge populations (Audzijonyte & Väinölä, Reference Audzijonyte and Väinölä2006). This region was covered by the eastern lobe of the Scandinavian Ice Sheet around 20 KYA (Svendsen et al., Reference Svendsen, Alexanderson, Astakhov, Demidov, Dowedswell, Funder, Gataullin, Henriksen, Hjort, Houmark-Nielsen, Hubberten, Ingolfsonn, Jakobsson, Kjaer, Larsen, Lokarntz, Lunkka, Lysa, Mangerud, Matiouchkov, Murray, Moller, Niessen, Nikolskaya, Polyak, Saarnisto, Siergert, Siegert, Spielhagen and Stein2004), and the horse mussel population may have survived in or in close vicinity to the White Sea. The first findings of horse mussel shells from northern Spitsbergen are dated to ~8.3 KYA, and indicate marine climatic optimum conditions further north (Salvigsen, Reference Salvigsen2002). Although the White Sea may have been a refugium, the genetic diversity may be due to repeated colonization events from other regions (Ingólfsson, Reference Ingólfsson2009).
One other boreal subtidal species whose genetic structure has been examined in the North Atlantic is the ocean quahog, Arctica islandica (Linnaeus, 1767) (Dahlgren et al., Reference Dahlgren, Weinberg and Halanych2000; Weinberg, et al., Reference Weinberg, Dahlgren and Halanych2002). The ocean quahog's range does not differ markedly from that of the horse mussels in the North Atlantic, but it does not occur in the Pacific Ocean. The two species mostly differ in habitat preferences and life history. The ocean quahog occurs solely on sandy bottoms and therefore tolerates higher wave and tidal exposure (Sabatini & Pizzolla, Reference Sabatini and Pizzolla2008). Its larvae are long-lived and settle over a period of several months. Adults have a recorded longevity of more than 400 years and spawning can be intermittent on timescales of 10–20 years. Both adults and larvae of the horse mussel tolerate lower temperature than the ocean quahog, and have a high sensitivity to abrasion and decreased salinity (Tyler-Walters, Reference Tyler-Walters2007). Despite the overall similarities, phylogeographic patterns of the ocean quahog and the horse mussel differ. Specifically, ocean quahog populations show more east-to-west genetic structure in the North Atlantic. Additionally, the American east coast does not host any private haplotypes of the ocean quahog, while private haplotypes are abundant throughout the entire North Atlantic range of the horse mussel. On a smaller scale, however, gene flow does not seem to have been limited in the ocean quahog either (e.g. around Iceland and Nova Scotia).
In comparison with other North Atlantic subtidal organisms studied to date, the horse mussel haplotype diversity is comparable with the diversity found in the cone worm Pectinaria koreni (Jolly et al., Reference Jolly, Viard, Gentil, Thiebaut and Jollivet2006) and the hermit crab Pagurus longicarpus (Young et al., Reference Young, Torres, Mack and Cunningham2002) but much less than in the brittle star Ophiothrix fragilis where a high level of diversity is maintained by admixture of genetically differentiated cohorts produced from isolated populations (Muths et al., Reference Muths, Jollivet, Gentil and Davoult2009). The lower diversity in M. modiolus compared to other North Atlantic taxa might suggest that it only moved into the Atlantic recently.
Whether the Pacific and Atlantic populations of horse mussels should be separate species needs more consideration. In particular, mytilids are renowned for being extremely challenging taxonomically even when both molecular and morphological evidence are brought to bear. Herein we show that there are at least two lineages for as currently recognized M. modiolus, but how distinct they are will depend on future sampling in the Pacific. Our findings are in general agreement with palaeontological information on migration and expansion of this and other bivalves. But while there has been considerable work on the impacts of glaciation and climate change in the northern Atlantic, the northern Pacific has received less attention. Likewise, more efforts need to be devoted to subtidal shelf species to more accurately assess range shifts of continental shelf species during climatic changes.
ACKNOWLEDGEMENTS
We are grateful to Inger Holmqvist who assisted with laboratory work. Help with collection of some of the samples was provided by Jan Sørensen, Christin Appelqvist, Matthías Bjarnason, Marc Taimour Jolly, Toril Moen and Mikhail Fokin. AU Marine Biology contribution number 100.
FINANCIAL SUPPORT
Funding was provided by the Swedish Research Council (TGD & PS), and Magnus Bergvalls Foundation (TGD).
APPENDIX
Modiolus modiolus. Variable positions in the 52 haplotypes (Mo1–Mo52; cf. Figure 2. Mo13–26 are from the Pacific). Numbers refer to the positions on the CO1 gene fragment. Shaded columns indicate first positions and numbers in bold indicate second positions, while all others are third positions. Bases in bold show non-synonymous changes.