American cities face a fiscal challenge from large unfunded future pension and rising retiree health care commitments (Brown, et al., Reference Brown, Clark and Rauh2011; Novy-Marx and Rauh, Reference Novy-Marx and Rauh2011; Lutz and Sheiner, Reference Lutz and Sheiner2014; The Pew Charitable Trusts, 2018). Any adjustments to bring these jurisdictions’ current spending and future liabilities into better alignment with their revenue almost certainly will fall in part on active and retired public employees because payroll is a large component of municipal spending. For example, 40% of local government spending is on elementary and secondary education, and another 6% is on police, both of which are labor intensive (Urban Institute, 2015). The constitutional protections afforded public employee pensions make adjustments on other margins such as payroll and health care benefits larger than would otherwise be the case. Exacerbating the situation are rising health insurance costs and premiums; already health insurance for active and retired employees is a major expense for many cities. In this paper we explore adjustments that cities facing fiscal challenges have made to margins related to employment and health insurance and possible effects on health outcomes.
We examine five individual cities in extreme fiscal difficulty, three of which declared bankruptcy and two whose bonds were downgraded to speculative grade or junk. Our main focus, however, is on a group of 23 cities in fiscal difficulty as indicated by municipal bond rating downgrades and a comparison group of 31 matched cities from the same bond rating database whose bond ratings were stable.
We use a standard difference-in-difference analysis to compare active and retired public employees in these two groups of cities before and after the bond rating change on measures of employment status, health insurance status, health care spending and use, and the proportion of active or retired employees who rate their overall health status as fair or poor, as well as their ratings of physical and mental health. We call the group of cities with bond downgrades the ‘Distressed’ group and the group with stable ratings the ‘Control’ group. We match the cities in the Distressed and Control groups to cities in the sampling frame of the Medical Expenditure Panel Survey (MEPS) to obtain data on employment, health care, and health outcomes. The data on the five cities in extreme distress come from the American Community Survey (ACS).Footnote 1
We expect cities and towns under fiscal pressure may alter employment practices and adopt less generous health insurance plans. Public employees may also alter their behavior. Unfortunately, theory does not let us sign effects on employment, use of health care services, or health outcomes. Although cities in distress may be more reluctant to hire, as exemplified by hiring freezes, current workers may be more averse to leaving public employment, especially if stress in the public sector is related to a loss of tax revenue from a decline in the local economy and a concomitant lack of job prospects in the local private sector. With respect to health insurance, less generosity may take the form of a smaller premium subsidy and/or greater cost sharing. If the employee continues to purchase insurance, however, theory would suggest any premium increase would have only a small income effect on use that would likely not be detectable.Footnote 2
A bleak fiscal situation could cause a public sector employee to retire sooner than initially planned, perhaps moving from the area. Alternatively, if the employee thought his or her pension might be less than previously expected or that a transition to local private employment was unlikely, the employee might remain employed longer than initially planned. If the employee did retire, however, both the monetary and time costs of health care could change. Both costs are known to affect use (Phelps and Newhouse, Reference Phelps and Newhouse1974; Manning et al., Reference Manning, Newhouse and Duan1987; Brot-Goldberg et al., Reference Brot-Goldberg, Chandra, Handel and Kolstad2017). Change in the cost of time may also affect health habits such as exercise, alcohol consumption, and use of drugs including opioids (Ruhm, Reference Ruhm2000; Cawley and Ruhm, Reference Cawley, Ruhm, Pauly, McGuire and Barros2012; Ruhm, et al., Reference Ruhm, Hollingsworth and Simon2017). Even in the absence of changes in the local labor market or a public employee's insurance status, municipal fiscal difficulty might alter the health status of employees through other pathways, including increased stress leading to detrimental effects on both physical and mental health or delayed or avoided care from less generous insurance plans. Mortality has been shown to increase after job displacement from plant closings or mass layoffs (Sullivan and van Wachter, Reference Sullivan and van Wachter2009).
Specifying leads or lags for any of these possible effects is problematic. Cities may act on employment prior to a formal bond downgrade. An employee anticipating a less generous health insurance plan may seek medical care earlier, at which time an asymptomatic condition may be discovered that is then treated. Theory is of little help in specifying the time structure of effects, but there is no presumption that any effects would occur simultaneously with the downgrade.
In short, both the sign and the timing of effects of fiscal difficulty in the public sector on employment and health are not clear from theory. We therefore specified many dimensions that could be affected by fiscal difficulty without prespecifying those we expected to be affected; thus, we regard our analyses as exploratory or hypothesis generating. We show annual raw results during a 9-year window from 4 years before to 4 years after the bond downgrade, as well as a prespecified regression that compares the 2-to-4-year period prior to the downgrade with the 2-to-4-year period following and that accounts for prespecified covariates.
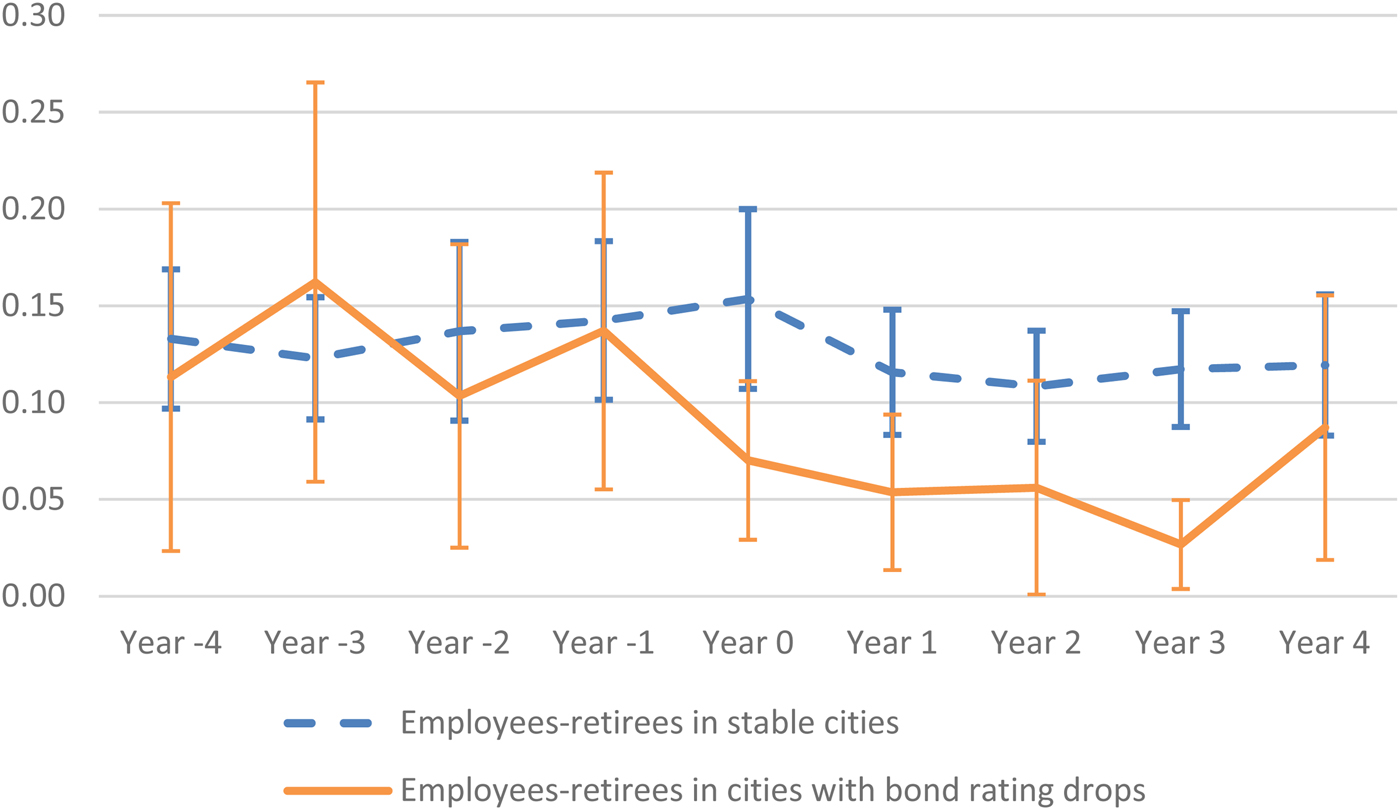
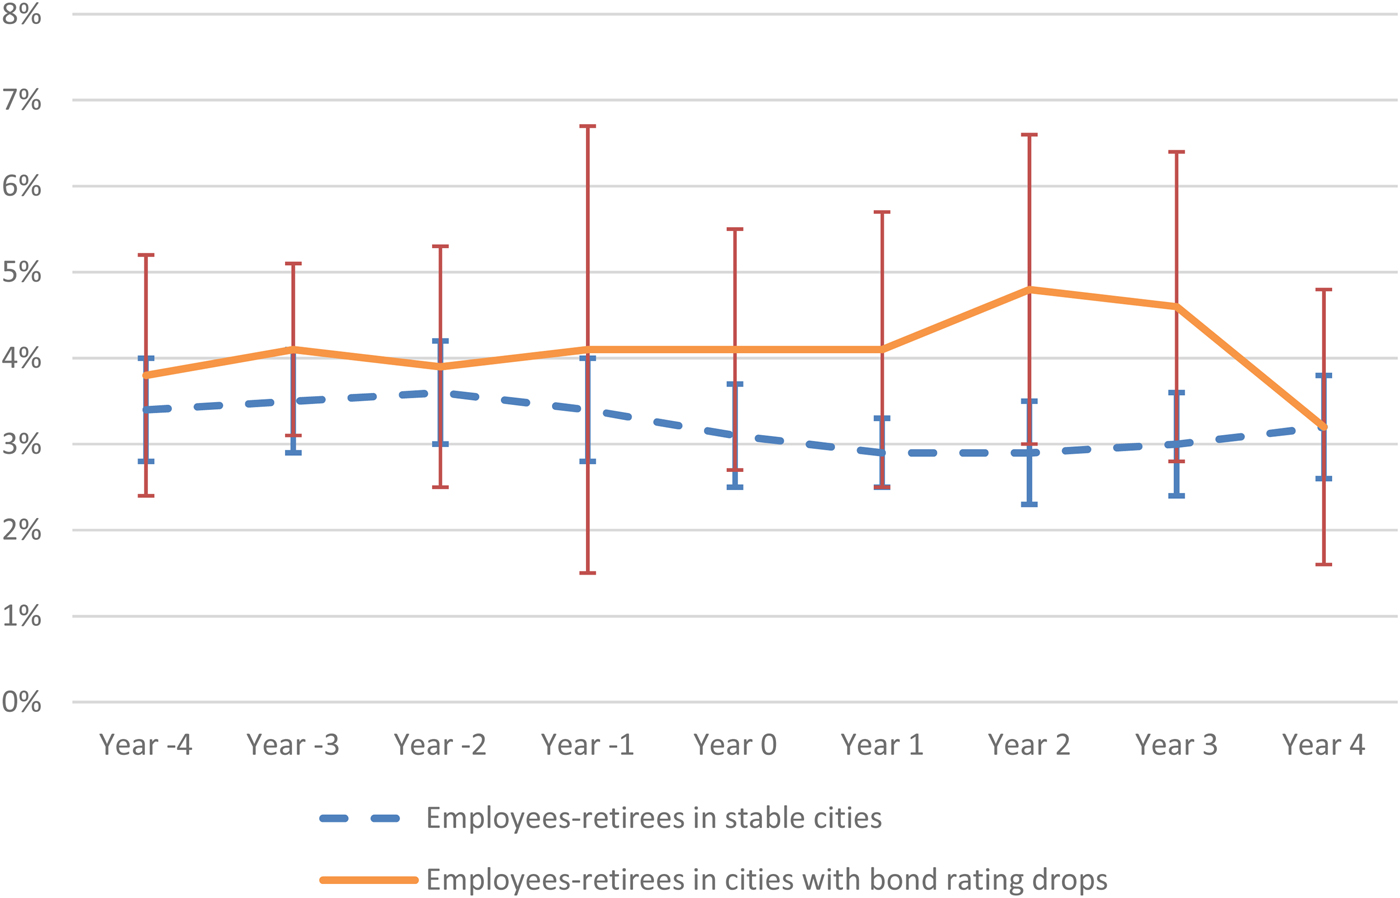
We find evidence of a labor market effect. In the raw results the separation rate, or the percentage of public employees annually leaving public employment (retired, quit, or fired), in the Control group was stable in the low teens throughout the 9-year window and was at a similar rate in the Distressed group up to the year before the bond downgrade. In that year, however, the separation rate fell around 8 percentage points, or roughly a factor of two, in the Distressed cities relative to the Control cities, and in the four subsequent years it remained around that level relative to the Control cities before rebounding to about 3 percentage points below the Control cities in the fourth year after the bond downgrade. The adjusted results show a smaller decline of about 5 percentage points in separations in the Distressed cities; the reduced amount relative to the raw annual data arises from excluding the year of the bond downgrade and the year after it and averaging the rebound in the fourth year after the downgrade with the two preceding years. Consistent with the fall in the separation rate, in the year before the downgrade public employees as a proportion of population rose in the Distressed group relative to the Control group in unadjusted data, but this effect was insignificant in the adjusted results.
We assumed that the difference in separation rates between the Distressed and Control cities starting the year before the bond downgrade stemmed from an exogenous event and went on to determine if there were effects on various measures of medical care use and health outcomes. Starting 2 years after the bond downgrade there was a larger percentage of public employees who rated themselves in fair or poor health at some time during the year in Distressed cities than in Control cities. While this change in overall health status was consistent with prior literature, we found no statistically significant effects on self-rated physical and mental health, medical care use, spending, or on the proportion of various services paid out-of-pocket, though our power was limited for these analyses.
Indeed, our analyses generally suffer from limited power. The union of the cities listed in the municipal bond rating database and the MEPS sampling frame contained only 23 Distressed cities and 31 Control group cities, and in each city there were only a few hundred MEPS respondents. Furthermore, to obtain even 23 cities with downgrades, we had to include cities that started with a sufficiently favorable credit rating that their post-downgrade rating continued to be qualitatively ‘superior.’ We could not analyze the smaller samples of cities with very low ratings after the downgrade in the MEPS for confidentiality reasons, but, as mentioned above, we also analyzed five highly distressed cities in our sample using ACS data.
Although our health results were mostly null, it seems plausible that workers, both public and private, in cities experiencing fiscal difficulties could exhibit health and medical care effects, both positive and negative. The numbers of cities and states experiencing fiscal difficulties likely will continue to rise over time as their unfunded liabilities become actual expenses. As a result, we hope this line of work will stimulate future work using other approaches or other data to confirm or disconfirm these exploratory analyses.
1. Methods
Municipal bond ratings from credit rating agencies provide a unified measure of the fiscal health of the municipality at the time of a debt issue and have been shown to be associated with economic, financial, debt, and administrative conditions (Hajek, Reference Hajek2011; Palumbo and Zaporowski, Reference Palumbo and Zaporowski2012). Additionally, bond ratings provide a consistent rating system with which to compare cities. This is particularly useful given that rigorous, uniform financial data for municipalities are scarce. Nonetheless, the ratings are specific to a given debt issue and so are an imperfect proxy for a municipality's financial well-being.
We began by identifying cities experiencing fiscal difficulties using downgrades in Moody's bond ratings. Of the three main credit rating agencies, Fitch, Moody's, and Standard & Poor's, we selected Moody's for having the fewest unrated cities and other missing values in our primary dataset. Moody's long-term municipal bond ratings rank from Aaa (highest) to C (lowest); it groups short-term bonds into four categories, VMIG1 (highest or ‘superior’) to SG (speculative grade or ‘junk’). The Appendix shows all Moody's ratings with a mapping of the ratings to qualitative descriptions.
We limited our scope to long-term general obligation municipal bond ratings both for consistency across jurisdictions and to have the most direct view possible of municipal finances. There are two primary types of general obligation municipal bonds: general obligation limited tax (GOLT) and general obligation unlimited tax (GOULT) bonds. Ratings for both types are based on the same underlying methodology, although GOULT bonds may be more stable (Moody's Investor Services, 2014). To maximize our sample, we included cities with either GOLT or GOULT bonds; in cases where data on both types are available, we used GOULT ratings as the more conservative estimate of a city's potential fiscal difficulties.
We used a three-pronged strategy to identify municipalities with downgrades. First, we identified downgrades in Moody's general obligation bond ratings using data from the Statistical Abstract of the United States (United States Bureau of the Census, various years). The Statistical Abstract published Moody's general obligation bond ratings for the 80 most populous US cities from 1995 to 2010 with a 2-year lag. The Statistical Abstract stopped publication after the 2012 edition, which gave 2010 ratings, so 2010 is the most recent year in our 80-city sample.
Second, we used a press report search of Factiva, a global news and business database operated by Dow Jones & Company, to identify downgrades among smaller cities outside the 80-city scope of the Statistical Abstract. We searched using the following keywords: city; bond rating; downgrade; general obligation; and Moody's. All keywords were required to include a result, and we restricted the date range from January 1, 2000 to December 31, 2015. This search yielded 613 non-duplicated results. We reviewed these 613 reports individually to see if they fit the inclusion criteria of a non-duplicate city general obligation bond with a Moody's credit downgrade.Footnote 3
Third, we identified cities that had defaulted on municipal bonds using a publicly available Moody's Investors Services report (Moody's Investor Services, 2017). In the period from 1995 to 2015 this report identified defaults and/or bankruptcies in seven municipalities: Detroit, MI; Harrisburg, PA; Stockton, CA; Mammoth Lakes, CA (unrated default); Moberly, MO (unrated default); San Bernardino, CA (unrated default); and Vadnais Heights, MN (unrated default). The identity of individual cities included in the MEPS sample is confidential, so we utilized the ACS, which had data from three of these cities, Detroit, Harrisburg, and Stockton. In addition, the ACS had data from two Nevada cities, Las Vegas and North Las Vegas that experienced downgrades of their bonds to speculative grade.Footnote 4 For these five cities we looked at the number of local public sector workers annually. This ACS-based analysis focusing on defaults was meant to complement the larger MEPS analyses that examined cities experiencing a broader range of distress.
In our larger sample of 23 cities with downgrades we constructed a comparison group by matching a group of 31 communities without bond rating changes in the Moody's data using propensity scores, according to the year of the downgrade, initial bond rating, population, (population)2, and census region. We explicitly did not match on state because this would have limited our power considerably. We applied weights proportional to the probability of each observation's being in the opposite group; this effectively downweighted communities that are not likely to have observable characteristics that overlap with communities in the other group and improved balance (Li et al., Reference Li, Zaslavsky and Landrum2007).
Our primary outcome data for this larger group of 54 cities come from the MEPS, a large nationally, representative household survey of the civilian, non-institutionalized population conducted annually since 1996. To align the date range of the bond ratings with the availability of the MEPS data, we restricted our date range of interest to 2000–2015. The MEPS data offer several advantages. First, they capture consistent data over time for residents in a large sample of US cities with information about each survey subject's current and past employer; thus, one can identify current local government employees, retirees who formerly worked for cities, and their spouses and dependents. Second, the MEPS survey captures information about each subject's current employment status and employer, health insurance coverage, medical use, and health status, which can be used to estimate relationships between municipal fiscal distress and the financial and medical health of their employees. Third, the survey includes a cross-section of city residents during each wave, with annual waves over multiple years; fortuitously, MEPS captured at least 9 years of data on persons in many of our Distressed cities.Footnote 5 Fourth, the MEPS includes information about every member of the household, so one can examine effects of fiscal distress on both current and retired public employees as well as their spouses and dependents.
We linked the Distressed and Control cities with the MEPS data using the five-digit zip codes corresponding to each city. Unfortunately we had to exclude over two-thirds of the full MEPS sample of public employees and dependents because we lacked bond rating data for the cities where they lived. These omitted MEPS subjects resided in smaller cities, i.e., not among the most populous 80 cities in the United States.
To maximize our sample we originally carried out an analysis that included all 31 cities with any bond downgrades in the Moody's data. This produced many null results, so we therefore focused on the smaller sample of 23 cities for which the post-downgrade bond rating was Aa3 or lower, i.e., the point at which Moody's describes bonds as having more than ‘very low credit risk.’ Eliminating the cities that even after the downgrade had ratings above Aa3 reduced the sample size of employees by almost half, leaving us with a sample of 598 current municipal workers or retirees in the Distressed cities and 1,927 in the Control cities. Although Aa3 is a relatively high rating, using only cities with ratings of Baa1 or lower (‘acceptable credit quality or lower’) would have resulted in more than an 80% reduction in the original sample size, and power is problematic even with the sample size that we use. Another way to say this is that about 75% of the cities with any downgrade in the Moody's data remained in the VMIG1 group (‘superior credit quality’) even after the downgrade. For confidentiality reasons, we cannot show the detailed distribution of ratings.
We then conducted an analysis of several outcomes potentially affected by fiscal difficulties. The sample consisted of active and retired public employees that are common between the Distressed and Control cities from the Moody's data and the sampling units included in the MEPS. The initial set of outcomes we examined included: separation rates, proportion of the population that are public employees, percentage of persons without health insurance during the year, measures of total medical spending, health insurance status, percentage of medical expense paid out-of-pocket, overall self-rated health (excellent, very good, good, fair, poor), global measures of physical and mental health from the SF-12, preventive health measures, and a survey measure of consumer satisfaction with health care (Agency for Healthcare Research and Quality, 2018).
The results we present here use only the sample of active and retired public employees. We also examined a sample that included dependents, but those results were generally similar and we do not show them.
All the analyses with the MEPS data apply the MEPS sampling weights, and all standard errors and statistical tests account for clustering at the city level. We alternatively computed standard errors using the MEPS Primary Sampling Unit/cluster structure, but found similar results, largely because clustering at the city level is a close approximation; consequently we do not show the results with the PSU/cluster structure.
2. Results
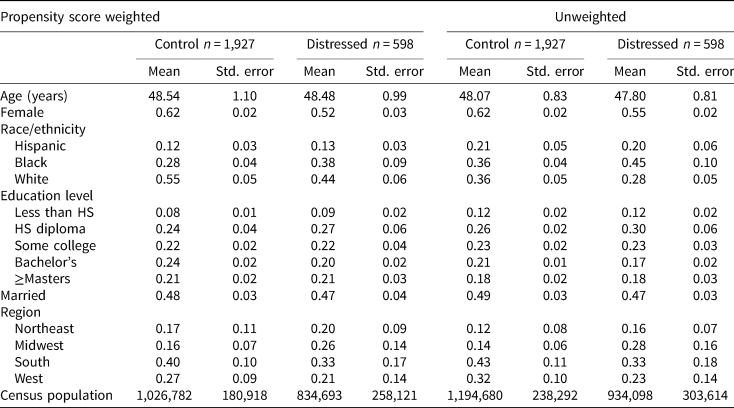
Despite the effort to match, the Distressed cities in the MEPS sample have a notably higher proportion of blacks, a smaller proportion of females and whites, less well educated population, and are disproportionately in the Midwest than the Control cities (Table 1). The only null hypothesis of no difference that one can reject at the 5% level, however, is that the percent female is the same, and even that rejection would not survive a multiple comparison correction. Most of the difference between the unweighted and weighted samples comes from applying the MEPS sampling weights; the additional propensity score matching did not much change the numbers shown in Table 1.
Control vs. Distressed group – public employees and retirees

Source: Authors’ Analysis of the Medical Expenditure Panel Survey.
In the 23 Distressed cities the effects of financial distress on public employee separations appear in the year of the bond downgrade, when the raw rate of public employee separation (retired, quit, fired) falls by around a factor of two (Figure 1). Thereafter it falls further until it somewhat rebounds in year 4 after the downgrade.
No longer a public employee (retire, resign, or lose job). Source: Authors’ Analysis of Medical Expenditure Panel Survey.

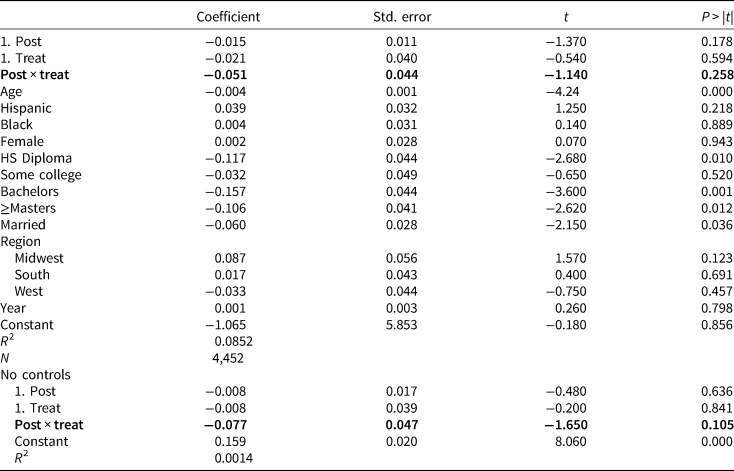
Table 2 shows difference-in-difference results for the rate of separation. Our prespecification excluded the year of the downgrade as well as the years before and after it from these results. This specification does not show an effect of the bond downgrade at usual tests of significance, though it would if we fit the time pattern shown in Figure 1 and compared the period from 2 years before the downgrade to subsequent years.
No longer a public employee1 years −2, −3, −4 vs. years +2, +3, +4

1 The years −1, 0, and +1, where 0 is the year of the bond downgrade, are omitted.
Standard errors and statistical tests adjust for clustering at the city level.
Source: Authors’ analysis of the Medical Expenditure Panel Survey.
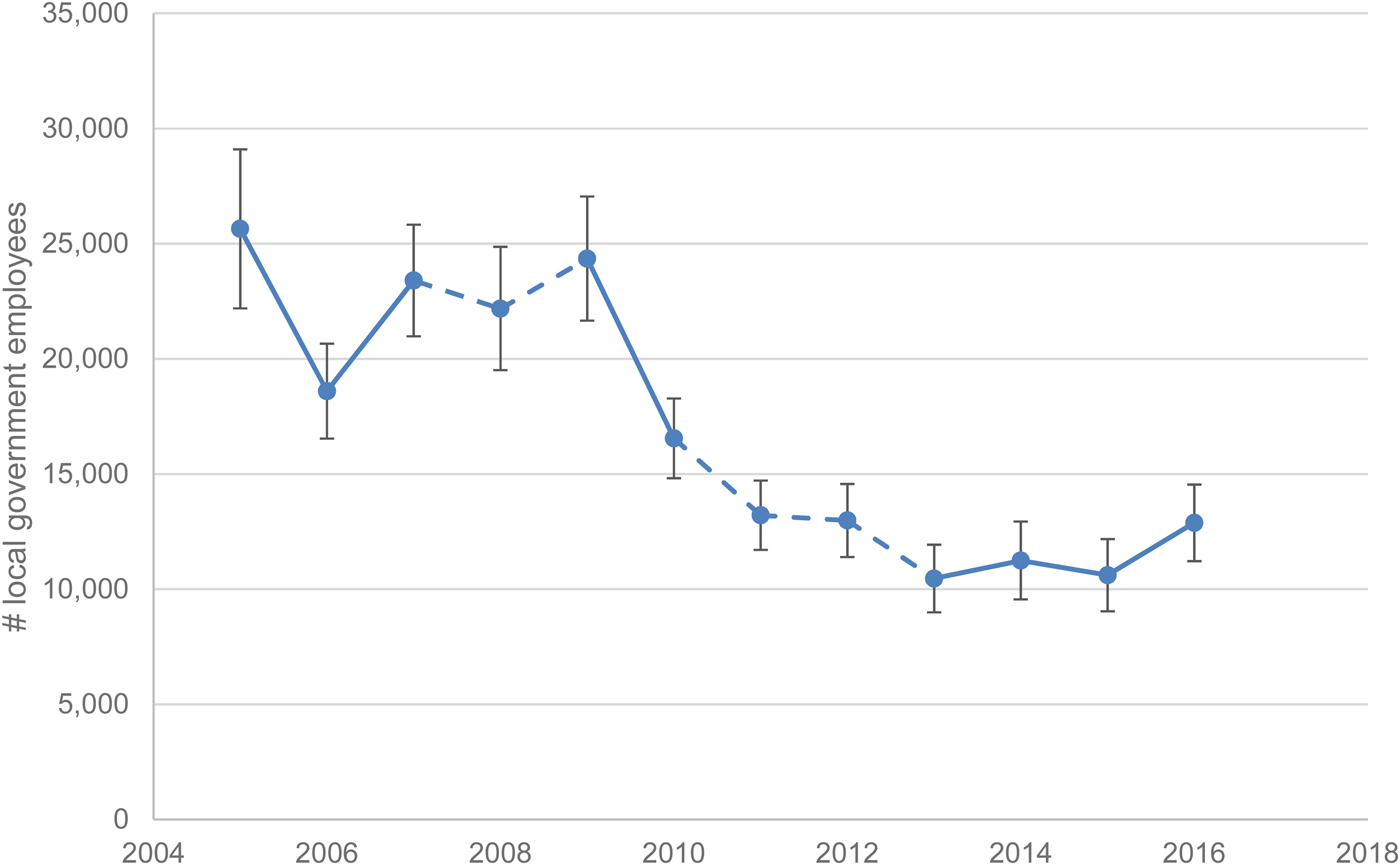
Using the ACS sample, Detroit, which suffered three downgrades and two defaults, experienced a sharp decline in local public sector employment, about a 60% decrease between the time of its second downgrade in 2009 until its second default in 2013 (Figure 2). Three of the other cities in the ACS sample (Harrisburg, Stockton, and North Las Vegas) also experienced 20–30% declines in the number of local public employees (not shown). Las Vegas was an exception; it had stable local public employment prior to its 2013 downgrade, and even a small increase by the second year after the downgrade. In all five cities the changes in the proportion of local public employees in the population is driven by changes in the numerator.
Detroit MI local government employees. Dashed lines represent years of downgrade or default: 2008: downgrade; 2009: downgrade. 2011: default. 2012: downgrade. 2013: default. Source: Authors’ calculations from United States Census Bureau/American FactFinder. ‘Class of Worker by Sex and Median Earnings in the Past 12 Months for the Civilian Employed Population 16 Years and Over.’ 2008–2014 American Community Survey and United States Census Bureau/American FactFinder. ‘Class of Worker by Sex for the Civilian Employed Population.’ 2015–2016 American Community Survey.

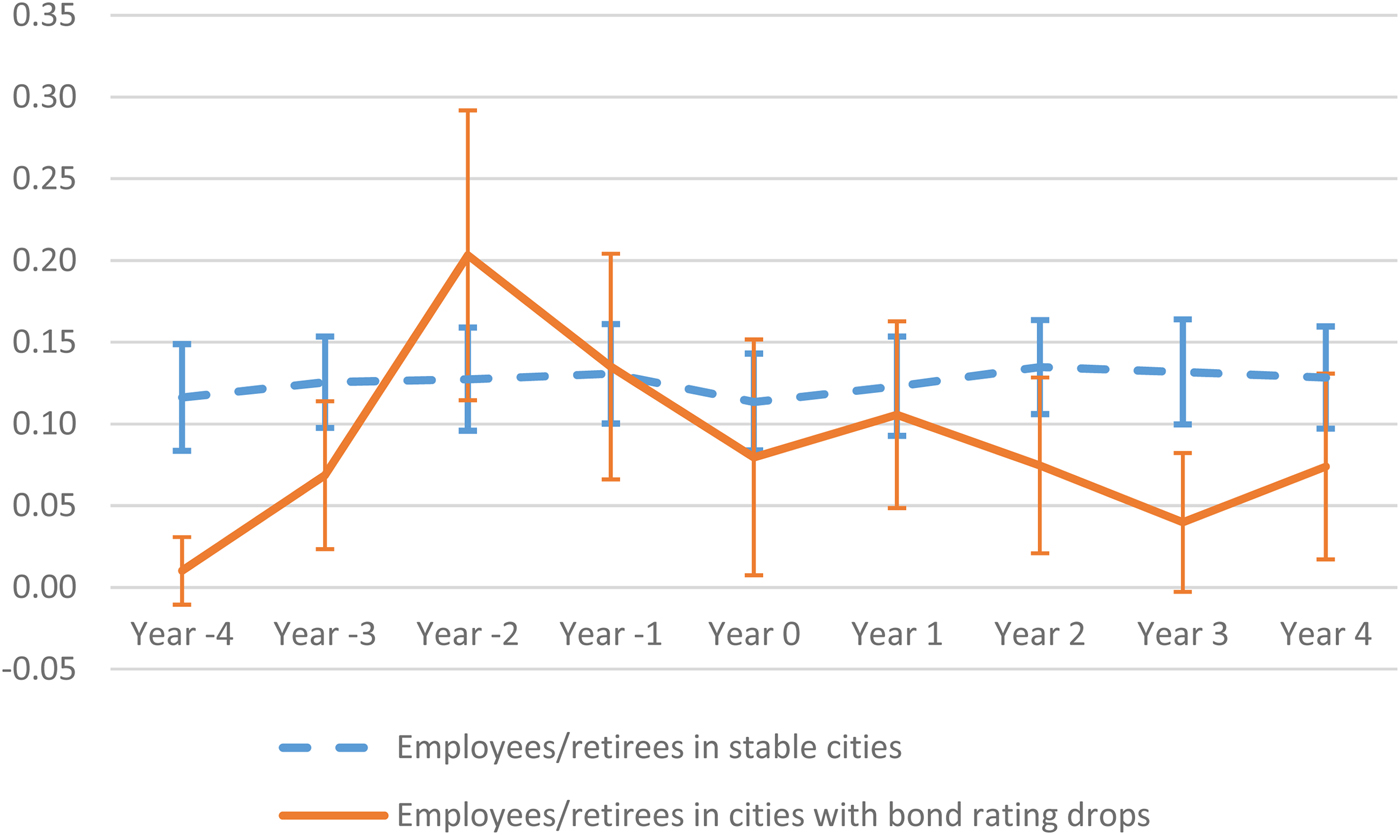
This pattern of decline in public employment, however, was not replicated in either the raw results from the broader MEPS sample, where local public employees as a proportion of population rose in the Distressed group relative to the Control group (Figure 3). In the adjusted results we examined public employment both as a proportion of the total population and as a proportion of total employment. Although both point estimates were positive, consistent with the raw results, neither was significant at usual levels (not shown).
Proportion of population who are public employees. Source: Authors’ Analysis of Medical Expenditure Panel Survey.

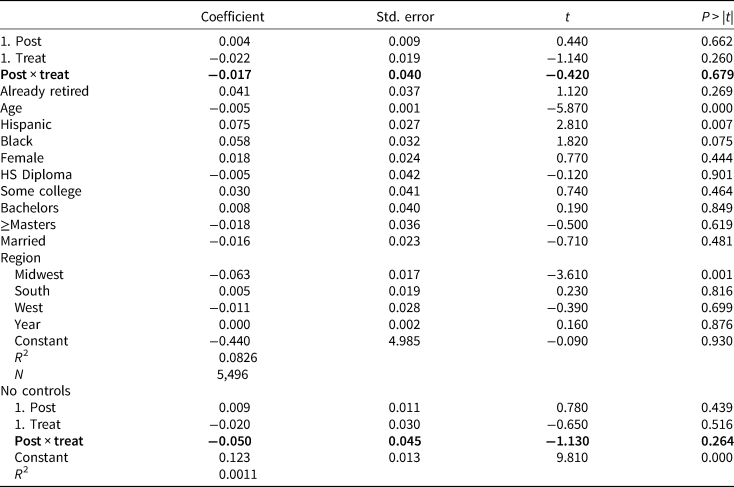
Turning from labor market effects to the uninsured rate, 2 years before the downgrade there was a temporary increase in the raw rate of persons who were uninsured for part of the year in the Distressed group (Figure 4). After the downgrade the uninsured rate was lower in the Distressed group (Figure 4), but the difference-in-difference analyses show no measurable effect, suggesting the differences in the raw rate are attributable to imbalances between the Distressed and Control groups, especially the differences in age, the proportion of minorities, and the regional imbalances (Table 3).
Any uninsured spell during the year. Source: Authors’ Analysis of Medical Expenditure Panel Survey.

Uninsured at any time during the year, years −2, −3, −4 vs. years +2, +3, +41

1 The years −1, 0, and +1, where 0 is the year of the bond downgrade, are omitted as washout years. Standard errors and statistical tests adjust for clustering at the city level.
Source: Authors’ analysis of the Medical Expenditure Panel Survey.
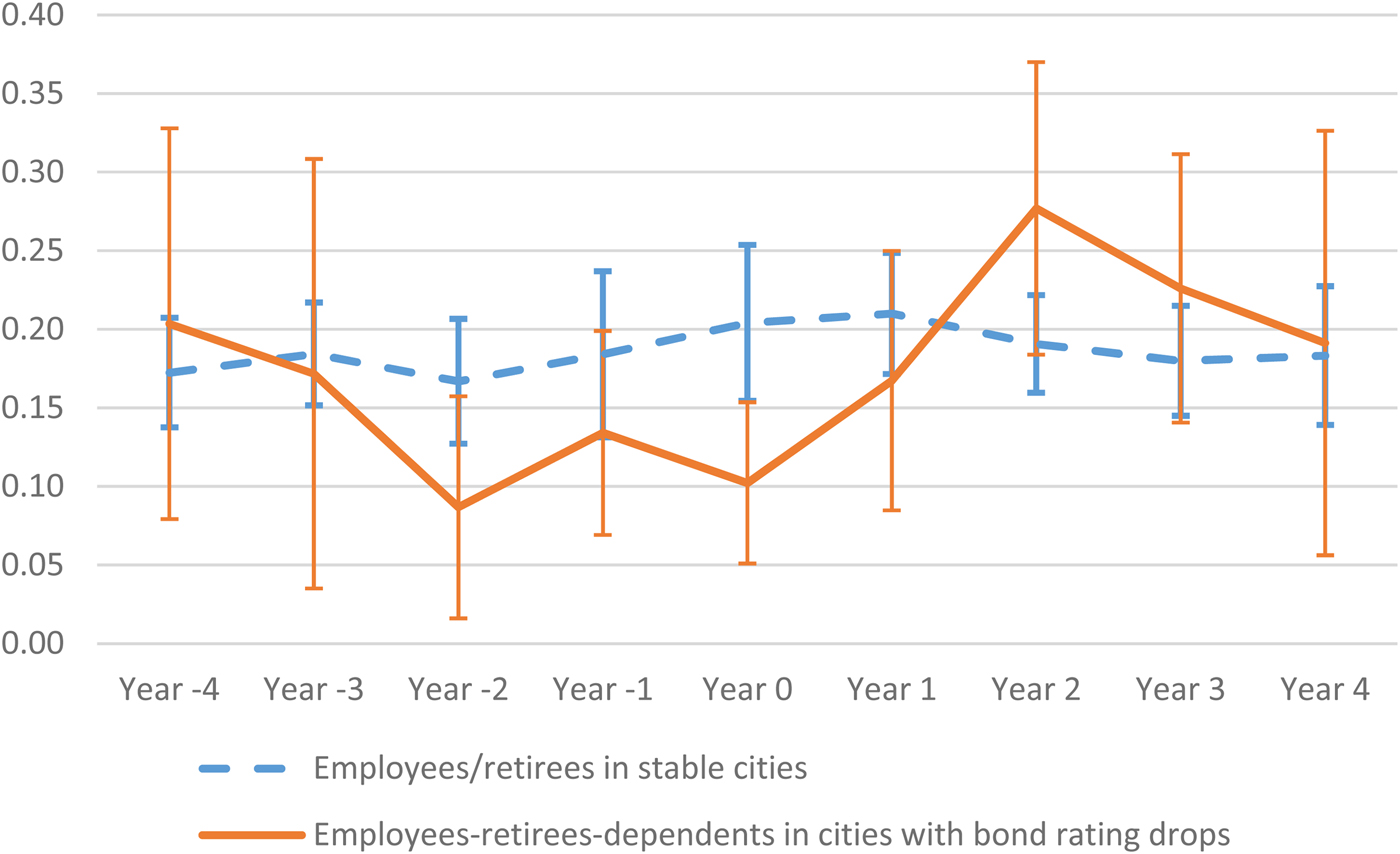
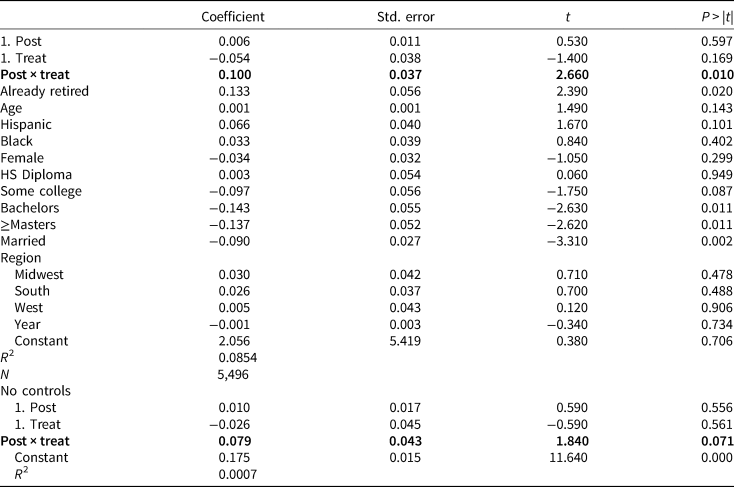
We find a rise in the raw frequency of reporting poor or fair health in the second and third years following the downgrade (Figure 5), and Table 4 shows that this difference in those reporting themselves to be in poor or fair health after the bond downgrade is significant without correcting for multiple comparisons. The sample for Table 4 is cities with downgrades to Aa3 or lower, but the result on poor or fair health shown in Table 4 is little changed by using the full sample of 31 cities with downgrades. Differences in poor or fair health, however, do not appear if dependents are included in the sample (not shown). The SF-12 subscales for physical and mental health, however, showed no statistically significant effect (results not shown).
Poor/fair self-reported health during the year. Source: Authors’ Analysis of Medical Expenditure Panel Survey.

In poor or fair health at any time during the year1

1 The years −4, −3, −2, +2, +3, +4 are included; the years −1, 0, and +1, where 0 is the year of the downgrade, are omitted as washout years. Standard errors and statistical tests adjust for clustering at the city level.
Source: Authors’ analysis of the Medical Expenditure Panel Survey.
We looked at a variety of effects on medical use and spending in the MEPS data, but no effects emerged that would remotely survive a multiple comparison correction.
3. Discussion
During the years 2000 to 2015, we identified 31 US cities that experienced drops in their bond ratings, 23 of which had decreases to ratings at or below Aa3, and five that either declared bankruptcy or whose bonds were downgraded to junk status. These bond rating decreases reflected external recognition that the cities had clear fiscal difficulties such that potential lenders faced increased credit risk.
Using the sample of 23 cities and linking them to the MEPS sampling frame, we found that the raw separation rate from public employment was similar in the Distressed cities relative to Control cities up to a year before the downgrade, when it fell substantially and remained below the rate in the Control cities for the following five years. We also prespecified a difference-in-difference analysis that excluded the year of the rating decrease and the years immediately before and after it; excluding those 3 years reduced the size of the estimated rate of separation, and it was no longer statistically significant. Any drop in separation rates from a steady state rate will be transitory, however, so the change in the raw rate in fourth year after the bond rating decrease back to something closer to a steady state rate seems plausible.
Public sector employment fell sharply in four of five cities in extreme distress, defined as having defaulted or having their bonds rated as junk. This result was not replicated in the larger and broader MEPS sample, however, where the proportion of local public sector employment in the Distressed group if anything rose relative to the Control group, consistent with the fall in the separation rate.
We found a higher rate of public employees and retirees assessing themselves to be in fair or poor health in the Distressed group starting 2 years after the bond decrease compared with the Control group, but this result could be an artifact of examining many outcomes. We examined several other measures of health care use, health care spending, and health outcomes and found no strong effects. Nor did we find effects when we included dependents.
While the impact of the growing fiscal challenges for cities on the financial and medical health of their employees and retirees is a critical question, there has been little prior study of it. This current effort aims to begin exploring the area and to illustrate some of the important questions, but our data were limited as was our power to detect any true effects. As a result, we view our mainly null findings as likely reflecting the lack of power to detect a true effect rather than evidence of any lack of effect. Our analytic sample was limited to 23 cities in the Distressed group and 31 in the Control group, and the post-downgrade bond rating in many of the cities in the Distressed group still left them with ratings that Moody's considered to be ‘superior’ credit quality. During the next economic downturn, there may be more cities with severe fiscal problems that can provide data to shed more light on the questions we sought to answer, especially as more cities face their pension obligations and experience rising health insurance premiums. Arguably, the pension accounting standards change in 2012 should lead to more accurate reporting, with potentially deleterious effects for those cities with overly optimistic estimates of their obligations.
The current and former employees and dependents of cities in fiscal difficulty almost certainly will bear some of the responses to this pressure. To the extent that there are clear pathways between these fiscal difficulties and the welfare of local public employees and their families, there could be opportunities for policy interventions. For example, if, contrary to what we observed, health insurance coverage declined because of leaving the public sector before age 65, policies facilitating transitions into private insurance markets, for example, limited premium differential age bands or risk adjustment modifications, could mitigate any adverse health effects.
Future efforts to examine the health and labor impact of municipal fiscal difficulty could benefit from both more refined measures of fiscal difficulty and from larger samples. The cities in our bond rating data sample had sufficiently little overlap with the MEPS sample that we had to exclude the majority of local public employees in the MEPS sample. A more intensive look at this issue could potentially utilize financial statements of cities, something that was beyond the scope of this paper.
More detailed linked data on municipal employee labor force behavior, health insurance decisions, and medical outcomes also would be valuable. In particular, the household portion of the MEPS survey, which we used, had limited information on the generosity of health insurance offered over time by cities, e.g., changes in actuarial value, benefit design, provider networks, or cost sharing amounts for specific services. The insurance portion of the MEPS survey, however, provides such details and could be analyzed.Footnote 6 Conceivably, cities might be more likely to alter insurance generosity than to reduce employment (except through attrition) in response to fiscal difficulty (Clemens et al., Reference Clemens, Kahn and Meer2018). As noted earlier, however, the observed employment and insurance decisions also reflect decisions by employees and households. And in many cases, there would be relevant third or fourth parties such as public employee unions and spouses that would influence the nature and timing of city changes or employee responses. Increases in the amounts of data on these variables could improve future work.
A major limitation of the current work is the lack of precision in our estimates, related in large part to the relatively small sample sizes available on public employees in cities where we had available bond-rating data. As discussed above, a more complete set of bond ratings could identify public employees in additional cities that could be included in both the Distressed and Control groups. The inclusion of more years of MEPS data as more cities experience difficulties over time could be helpful. Larger samples with more information at the city and individual levels could improve the comparability of the Control group. Other national datasets, including the ACS, the Current Population Survey, or the Health and Retirement Survey might also be helpful in examining certain outcomes. Claims data from aggregators such as IBM/Truven alone or in combination with state-based entities (e.g., CALPERS), could increase the sample. Claims data may be particularly helpful for estimating the effects of fiscal distress on health care utilization and spending. Health care utilization and spending is skewed, so estimating effects is particularly sensitive to sample size. Larger data sets would allow exploring the three components of the separation rate, retired, quit, and fired. They would also permit exploration whether these effects differed according to the phase of the business cycle.
4. Conclusion
In sum, we examined the potential labor market and health outcomes in the United States following cities’ bond rating downgrades. We found a number of cities that experienced downgrades in recent years, and expect that these numbers could increase in future years. Using linked data from bond ratings and the MEPS household survey, we found likely lower rates of separation from public employment in these cities compared with cities with stable bond ratings. To reach more definitive answers on labor market and health effects, however, will require better data lest the search under the proverbial lamp post leaves too much in the shadows.
Acknowledgements
This paper represents the views of the authors, and no official endorsement by the Agency for Healthcare Research and Quality or the Department of Health and Human Services is intended or should be inferred. We thank Robin McKnight for her most helpful comments on an earlier draft, as well as participants of the NBER Conference on Incentives and Limitations of Employment Policies on Retirement Transitions, held in August 2018. We also thank the Alfred P. Sloan Foundation for sponsoring the conference.
Appendix
Moody's bond ratings