Introduction
Effective energy shortage is one of the key issues in the new energy field. Supercapacitors are considered as new type of electrochemical energy storage device because of quick charge/discharge rate, long cycle life, environmental-friendly, energy saving, and low cost [Reference Wang, Zhang and Zhang1, Reference Xie and Zhou2, Reference Xie3]. The electrode material and electrolyte are important factors influencing the performance of the supercapacitor [Reference Xie and Wang4, Reference Xie and Sha5, Reference Xie and Sun6]. One key issue is to develop highly effective electrode materials with high energy density [Reference Li, Ruan, Xu and Xie7]. Generally, carbon electrode materials can be applied for double-layer capacitors. The transition metal oxides, polyoxometalates, and conductive polymers electrode materials can be applied for pseudo-capacitors [Reference Shilpa and Sharma8, Reference Zhou and Xie9, Reference Lu, Xie and Zhao10]. Carbon materials, such as activated carbon [Reference Abioye and Ani11], carbon nanofibers [Reference Lu and Xie12], carbon nanotubes [Reference Futaba, Hata, Yamada, Hiraoka, Hayamizu, Kakudate, Tanaike, Hatori, Yumura and Iijima13], and graphene [Reference Le, Ervin, Qiu, Fuchs and Lee14], are widely used in electrode materials of supercapacitors because they have the unique advantages of good electrochemical stability, large specific surface area, high conductivity, and rich source [Reference Ghosh and Lee15]. However, the electroactive carbon materials mostly keep the powder form. Polymer binders are required to prepare the working carbon electrodes, which limits their electrochemical performance [Reference Hu, He, Chen, Zhu, Hanif and Hou16]. It is essential to develop binder-free and self-supporting electrode materials to improve their electroactivity and capacitive performance [Reference Zhao, Xie and Lu17, Reference Zhao and Xie18].
Carbon paper with fine mechanical flexibility is manufactured by graphite powders under high pressure. It is a paper-like electrode material with high conductive properties [Reference Li, Yu, Liu, Liu and Wu19]. However, compared with some active carbon materials, such as graphene (100–200 F/g) [Reference Li, Zhang, Dou, Wu, Liu, Qian, Gu, Xia, Tu and Zhao20] and single-walled carbon nanotubes (100–200 F/g) [Reference Hu, Pasta, La Mantia, Cui, Jeong, Deshazer, Choi, Han and Cui21], normal carbon paper has the small specific surface area and a low specific capacitance value (1–2 F/g) [Reference Horng, Lu, Hsu, Chen, Chen and Chen22], leading to the low energy density of supercapacitor based on carbon paper electrodes [Reference Chen, Zhai, Wang, Yu, Wang, Zhao and Li23, Reference Lee, Lee, Kim, Lee, Yi, Yoon, Song and Song24]. Until now, great efforts of carbon activation have been devoted to promote the specific capacitance, which include the thermal treatment, acid treatment, electrochemical treatment, and plasma treatment [Reference Fan, Li, Wang, Lu, Xu, Liu and Yan25]. It was reported that activated carbon paper (ACP) had the coarse surface and the increased specific surface area, which was prepared using the modified Hummer’s method [Reference Qiu, Dang, Cheng, Lin, Wang, Fan and Wang26]. It was reported that graphene could be prepared through electrochemical re-intercalation of a flexible graphite sheet in the (NH4)2S2O8 electrolyte. The graphene rooted in the flexible graphite sheet substrate could provide a large surface [Reference Xin, Wang, Zhang, Jia, Zang and Wang27]. It was also reported that the exfoliated graphite substrate offered a large surface area for supporting pseudo-capacitive materials [Reference Song, Feng, Liu, Li and Liu28]. It was reported that porous N-doped carbon supported on flexible carbon cloth could act as a high-performance electrode material [Reference Mao, Zhao, Wang, Zeng, Lu and Tong29]. Despite these attainments, it still remains a huge challenge to fabricate highly selective electrode materials with high capacitive performance.
In this study, ACP with high specific surface area and the expanded layer distance of graphite carbon is prepared by nitrate ion–assisted and sulfate ion–assisted electrochemical exfoliation process and then hydrothermal reduction process. The electrochemical measurements of ACP have been fully investigated, displaying an excellent electrochemical capacitance performance for supercapacitor application.
Results and discussion
Structural characterization
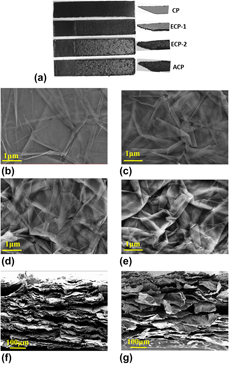
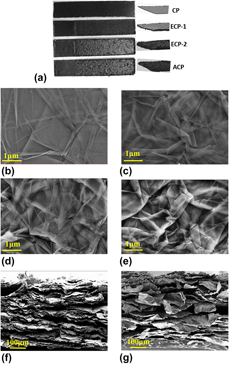
Figure 1(a) displays top-view and side-view photographs of carbon paper (CP), Exfoliated carbon paper (ECP)-1, ECP-2, and ACP. CP shows very smooth surface. ECP-1, ECP-2, and ACP show relatively rough surface with different patches, which are ascribed to the partially exfoliated graphite nanosheets. ECP-2 and ACP show much rougher surface than CP. The gas evolution during the exfoliation process could surmount the van der Waals force between the graphene layers on the carbon paper surface, leading to the expansion of graphite layers. The surface of ACP exhibits self-crimping wrinkle patches. There was no obvious difference between ECP-2 and ACP because hydrothermal reduction reaction could not change the morphology of the graphite. The cross-section dimension is correspondingly increased to follow the order of CP < ECP-1 < ECP-2 ≈ ACP.
(a) Top-view and side-view photographs of CP, ECP-1, ECP-2, and ACP. (b–e) Top-view SEM images of CP, ECP-1, ECP-2, and ACP. (f, g) Side-view SEM images of CP and ACP.

Figures 1(b)–1(e) show top-view scanning electron microscope (SEM) images of CP, ECP-1, ECP-2, and ACP, respectively. Graphite sheets with different sizes are distributed on the surface of carbon paper. ECP-1 shows smaller patches and more wrinkle than CP. ECP-2 and ACP show similar morphology with very small fragments, which are overlapped to form many chambers. The activation treatment of graphite carbon could well generate more active interface for electrochemical reaction.
Figures 1(f) and 1(g) show cross-section SEM images of CP and ACP. The carbon graphite shows closely packed layers. The carbon paper layers are expanded after the activation treatment. ECP-2 shows much larger graphite layer distance than ECP-1, which may be related to the insertion/extraction of electrolyte ions in the solution and gas bubbling between the graphite layers during the electrochemical exfoliating process [Reference Singh and Zeng30]. The interlayer of ACP shows distinct expansion effect. This ACP with enlarged graphite layer distance can provide more accessible surface area, facilitating the diffusion and transportation of the electrolyte ions into the interior of carbon paper electrode material. So, ACP is expected to have the improved capacitance and rate performance.
Structural analysis
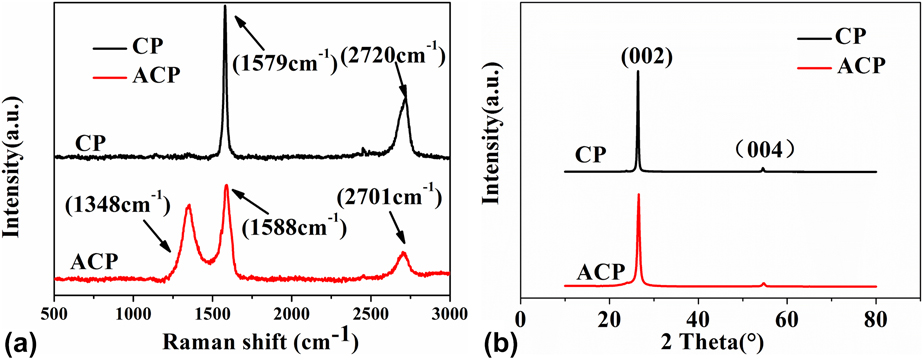
Raman spectroscopy is applied for structural characterization of the as-fabricated carbon materials. Figure 2(a) shows Raman spectra of CP and ACP. The Raman spectrum of CP shows that CP has a sharp and strong characteristic peak (G band) at 1579 cm−1, corresponding to the E2g vibrational mode of sp 2 hybrid carbon in graphite. But no obvious D band was observed, indicating that the structure of carbon paper is irregular, crystallinity is good, and defects are few. The spectrum of ACP presented a sharp increase of D band (1348 cm−1) compared with that of the CP, which shows that the partial sp 2 hybrid carbon atoms is converted into the sp 3 hybrid structure. The C=C double bond in the graphite layer is destroyed. The resulted graphene edge has more defects [Reference Ramesha and Sampath31]. The I D/I G ratios also reflect the number of defects on the surface. The ACP electrode exhibits higher intensity ratio of D band to G band (I D/I G = 0.79) in comparison with CP electrode (I D/I G = 0.39), implying that the surface disorder of ACP increased obviously and ACP has smaller in-plane sp 2 hybrid carbon domains. During the electrochemical exfoliation process, the introduction of oxygen-containing groups into graphene nanosheets could change partially the bonded carbon atoms from sp 2-hybridization to sp 3-hybridization. In addition, the wavenumber of the G band (1588 cm−1) in ACP is slightly higher than that in CP, which may be due to the ion intercalation in the electrochemical exfoliating process [Reference Song, Feng, Liu, Li and Liu28, Reference Song, Liu, Xu, Feng, Yao, Kou, Liu and Li32]. The formation of ion intercalation compound will lead to red shift of G band [Reference Song, Feng, Liu, Li and Liu28]. The 2D band of CP was located at 2720 cm−1. However, the ACP showed the 2D band at 2701 cm−1. It means that number of graphene layers reduced [Reference Song, Liu, Xu, Feng, Yao, Kou, Liu and Li32]. The ACP with abundant defect could increase reactive site of carbon paper electrode material.
(a) Raman spectra and (b) XRD patterns of CP and ACP.
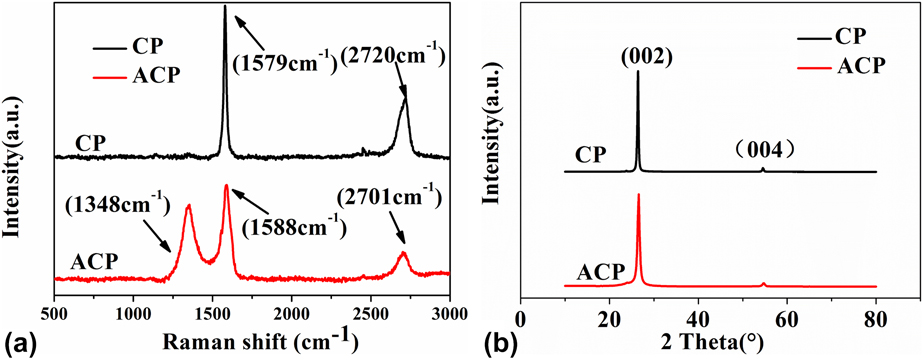
Figure 2(b) shows the X-ray diffraction (XRD) patterns of CP and ACP. ACP shows the characteristic diffraction peak at 26.3°, which is ascribed to the (002) crystal plane of graphite. The corresponding interlayer d-spacing is 3.48 Å. CP shows the similar diffraction peak at 26.5°, corresponding to the interlayer d-spacing of 3.36 Å. The slightly increased d-spacing indicates that ACP still keeps a small amount of functional groups [Reference Parvez, Wu, Li, Liu, Graf, Feng and Mullen33].
Electrochemical properties
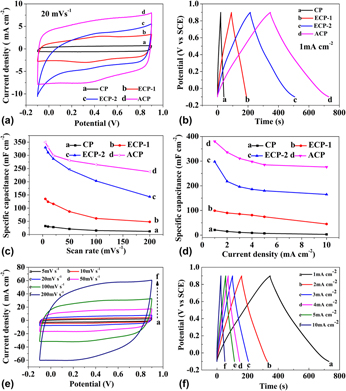
Figure 3(a) shows the cyclic voltammetry (CV) curves of CP, ECP-1, ECP-2, and ACP at a scan rate of 20 mV/s in 1 M H2SO4 electrolyte solution. The CV curves of ECP-1 and ECP-2 show a pair of broad redox peaks around 0.44 and 0.36 V, which are associated with the oxygen-containing group on the surface of graphite carbon paper. Comparatively, the CV curve of ACP exhibits rectangle-like shape with much high current response, mostly demonstrating electrical double-layer capacitive behavior. The appearance of weak reversible hump indicates the existence of the residual oxygen-containing group of ACP. Furthermore, ACP shows a quite enhanced capacitance compared with that of others. The conductive ACP with the curled graphite sheet structure could effectively improve its reactivity.
(a) CV curves at a scan rate of 20 mV/s, (b) GCD curves at 1 mA/cm2. (c) Capacitance curves from CV measurement in terms of scan rate. (d) Capacitance curves from GCD measurement of CP, ECP-1, ECP-2, and ACP. (e) CV curves at different scanning rates of ACP. (f) GCD curves at different current densities of ACP.
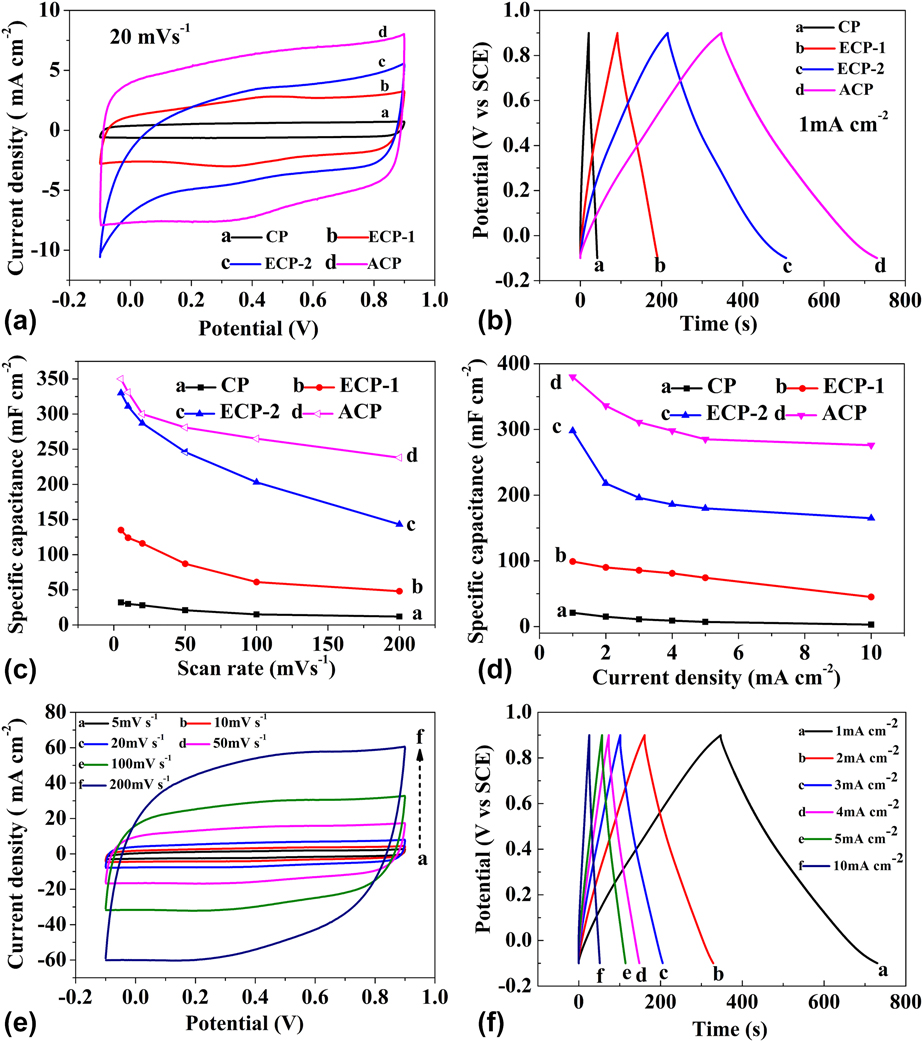
Figure 3(b) shows the galvanostatic charge–discharge (GCD) curves of CP, ECP-1, ECP-2, and ACP at 1 mA/cm2. The discharge time of ACP is much longer than that of CP, ECP-1, and ECP-2, indicating the enhanced electrochemical capacitance. In view of the reversible characteristic in charge–discharge process, the GCD curve of ACP shows approximately symmetrical triangle shape, which is corresponding to the rectangle-like shape in the CV curves. The specific capacitance of the as-prepared electrode materials can be calculated using Eq. (1) on the basis of GCD curves.
 $${C_{\rm{s}}} = {Q \over {\Delta V \times S}} = {{I{\rm{\ }} \times {\rm{\ }}t} \over {\Delta V \times S}}\quad ,$$
where I is the discharge current (A), t is the discharge time (s), S is the area of active material (cm2), ΔV is the potential range of discharge (V), and C s is the specific capacitance (mF/cm2).
The specific capacitance of CP, ECP-1, ECP-2, and ACP was 21, 99, 298, and 380 mF/cm2, respectively, at 1 mA/cm2. These results could be related to the surface activation level of carbon paper. The corresponding Internal resistance (IR) drop was 30.8, 10.3, 5.8, and 4 mV, respectively. The lower IR drop of ACP indicates smaller internal resistance and higher conductivity. This result implies that the conductivity of the carbon paper is improved after the hydrothermal reduction treatment of ECP-2. Figure 3(c) shows the capacitance curves at different scan rates. When the scan rate increases from 5 to 200 mV/s, ACP achieves a capacity retention of 68%. It is higher than the rate capability of CP (30%), ECP-1 (35%), and ECP-2 (42%). Figure 3(d) shows the specific capacitance of CP, ECP-1, ECP-2, and ACP at different current densities. When current density increased from 1 to 10 mA/cm2, the capacitance decreases from 21 to 4 mF/cm2 with a capacity retention of 14% for CP, from 99 to 45 mF/cm2 with a capacity retention of 47% for ECP-1, and from 298 to 164 mF/cm2 with a capacity retention of 55% for ECP-2. ACP also exhibits the capacitance retention ratio of 73%, presenting a good rate capability. Good electrical conductivity of the electrode is the key factor for achieving high rate capability. Electrochemical over-oxidation could destroy the carbon π conjugated system. The introduction of partially unstable functional group lowers the stability of the carbon paper. These unstable oxygen-containing functional groups of ECP-2 could be mostly removed during hydrothermal reduction process, which accordingly improves electrical conductivity of ACP. The highest occupied molecular orbital and lowest unoccupied molecular orbital of graphene are mainly concentrated at the edge of the graphite sheet. This outwardly tilted graphite sheet can accelerate electron transfer and is favorable for electrochemical reaction [Reference Brownson, Munro, Kampouris and Banks34]. Therefore, ACP has better capacitive performance than CP, ECP-1, and ECP-2.
Figure 3(e) shows the CV curves of ACP electrodes at scan rates from 5 to 200 mV/s and potential window from −0.1 to 0.9 V. All CV curves exhibit approximately rectangular shapes with electrical double-layer capacitance characteristic. The shape of CV curves does not change significantly at scan rates from 5 to 200 mV/s, indicating its good rate performance. Figure 3(f) shows GCD curves of ACP electrode at different current densities. The shapes of the charge–discharge curves are nearly symmetrical with a triangular shape and slight curvature, implying good reversibility of electrode reaction during the electrochemical process and high rate capability of ACP.
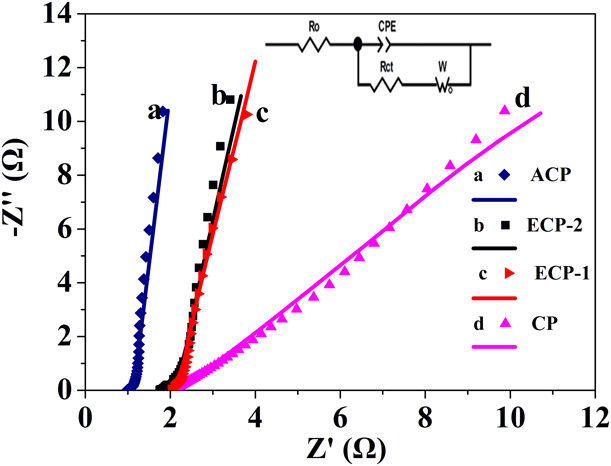
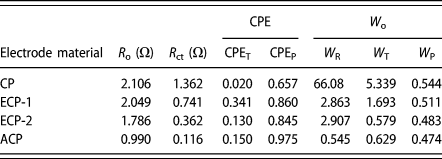
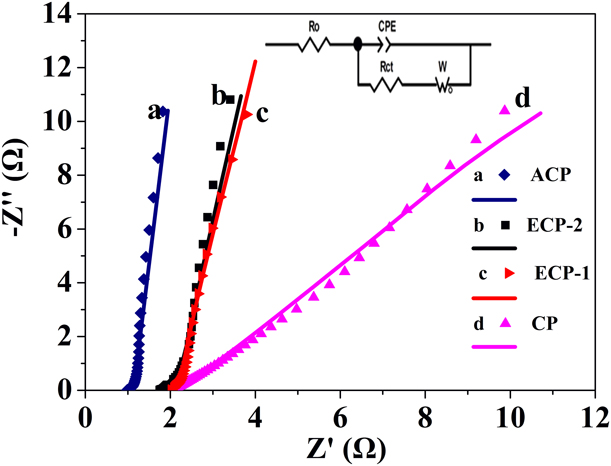
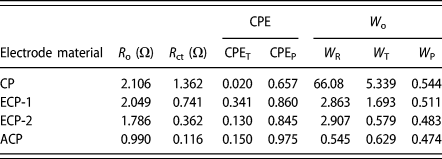
The charge transfers and ion diffusion properties of electrode materials were determined by electrochemical impedance spectroscopy (EIS) measurement. Figure 4 shows EIS Nyquist plots and the corresponding fitting curves of CP, ECP-1, ECP-2, and ACP electrode materials. The insets show the corresponding equivalent circuit. The fitting values of the equivalent circuit elements of CP, ECP-1, ECP-2, and ACP are listed in Table I. The equivalent circuit diagram comprises equivalent elements, including the ohmic resistance (R o), the charge transfer resistance (R ct), the constant phase element (CPE), and the Warburg element (W o). The R o values, which is equal to the intercept of the left end of the semicircle with the imaginary axis Z′ of the high-frequency region in the EIS, are concluded to be 2.106, 2.049, 1.786, and 0.990 for CP, ECP-1, ECP-2, and ACP, respectively. R o values include the total resistance of the ionic resistance of electrolyte, intrinsic resistance of active materials, and the contact resistance at the active materials/current collector interface and active materials/active materials interface [Reference Xie and Sha5]. R ct value can be estimated based on semicircle diameter in high frequency range. Notably, the R ct of CP (1.362 Ω) is larger than that of ECP-1 (0.741 Ω), ECP-2 (0.362 Ω), and ACP (0.116 Ω). ACP with accessible surface area of graphene sheets is more favorable to facilitate the interfacial charge transfer. The CPE is related to the inhomogeneity of the surface of the electrode material, which is used to characterize non-ideal capacitor. The CPE includes two parameters: CPET and CPEE. CPEP = 1 indicates the ideal capacitor. CPEP = 0.5 represents Warburg impedance behavior. ACP shows higher CPEP value (0.975) than CP (0.657). Its CPET value (0.150) is also much higher than that of CP (0.020). ACP has more layered structure and interspace than CP, which is consistent with the SEM characterization result. The W o is used to characterize the ionic diffusion impedance during the process of ionic diffusion from the bulk phase of electrolyte solution to the surface of electrode. W R is the Warburg diffusion resistance, W T is the diffusion time constant, and W P is a fractional exponent between 0 and 1. The W R values of CP, ECP-1, ECP-2, and ACP are 66.08, 2.863, 2.907, and 0.545 Ω, respectively. ACP has a lower Warburg resistance, which is more beneficial for ionic diffusion. The W T can be expressed by the formula W T = L 2/D. Herein, L is the effective diffusion distance and D is the effective diffusion coefficient. The W T values of CP, ECP, and ACP are 5.339, 1.693, 0.579, and 0.629, respectively. ACP has a relatively higher diffusion coefficient. Overall, in comparison with CP, ECP-1, and ECP-2, ACP has superior capability of charge transfer and ion diffusion during the electrochemical process. Therefore, the EIS analysis results are in accordance with the CV and GCD measurement results, proving the superior electrochemical performance of ACP electrode material rather than ECP-1, ECP-2, and CP.
Nyquist plots and fitting curves of CP, ECP-1, ECP-2, and ACP.
Fitting values of the equivalent circuit elements of CP, ECP-1, ECP-2, and ACP.
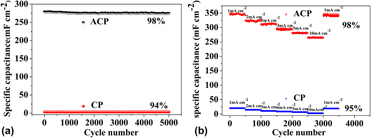
Cycling performance is one of the methods for evaluating the electrochemical performance of electrode materials, which is of great significance for the practical application of electrode materials. ACP and CP electrodes have been carried out long-time cycling charge–discharge process over 5000 cycles at 10 mA/cm2. Figure 5(a) shows the specific capacitance of CP and ACP in terms of cycle number. The specific capacitance of ACP was declined from 278 mF/cm2 in the first cycle to 274 mF/cm2 in the 5000 cycles. It is noteworthy that nearly 98% capacitance retention was obtained after 5000 charge/discharge cycles, while CP exhibits 94% capacitance retention after 5000 charge/discharge cycles. This outstanding cycling performance proves excellent stability of the electrode. Figure 5(b) shows the rate performance of CP and ACP at different current densities from 1 to 10 mA/cm2. GCD measurement is carried out for 500 cycles at every current density. When the current density increases from 1 to 10 mA/cm2, the capacitance progressively decreases. When the current density is recovered to 1 mA/cm2, ACP electrode shows insignificant capacitance decay of 2%, which is lower than 5% for CP electrode. This excellent cycling stability and rate capability of ACP electrode could be ascribed to the following reasons. The ACP electrode with graphite nanosheets and large interlayer spacing enhances ion accessible surface area. ACP with reasonable conductivity ensures fast electron transport in the electrochemical process.
(a) Capacitance and capacitance retention curves of CP and ACP at a current density of 10 mA/cm2 and (b) rate capability performance of CP and ACP at different current densities.
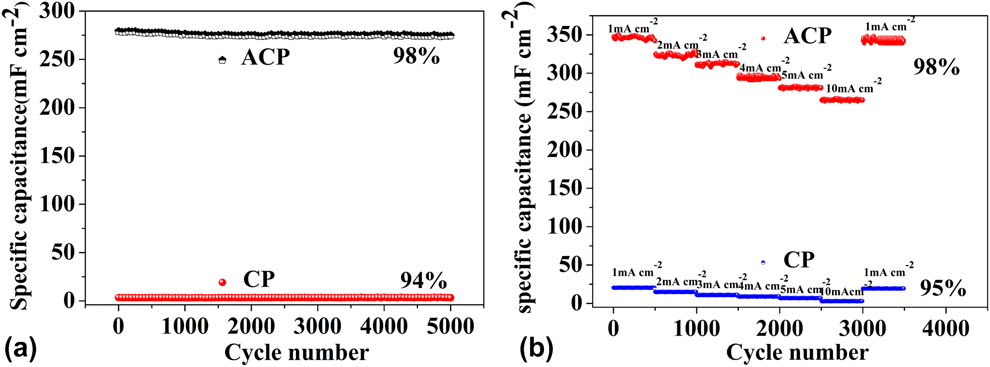
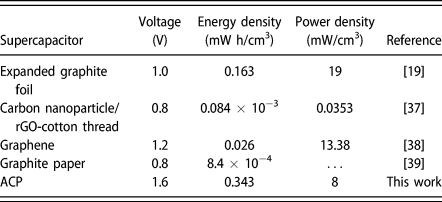
Table II lists the electrochemical properties of the as-reported carbon-based electrode materials for the comparison with ACP in this study. ACP has a much larger specific capacitance than other carbon-based electrode materials. The worthy electrochemical performance of ACP electrode is in connection with the microstructure. ACP with high reactive surface provides more active sites in the electrochemical process. The residual oxygen-containing group could provide additional pseudo-capacitance for ACP electrode materials. It is noticeable that nearly 98% capacitance retention was obtained after 5000 cycles at 10 mA/cm2. This remarkable cycling performance proves the excellent stability of the electrode.
Specific capacitance and cycle life of ACP electrode material in comparison with the as-reported carbon electrode materials.

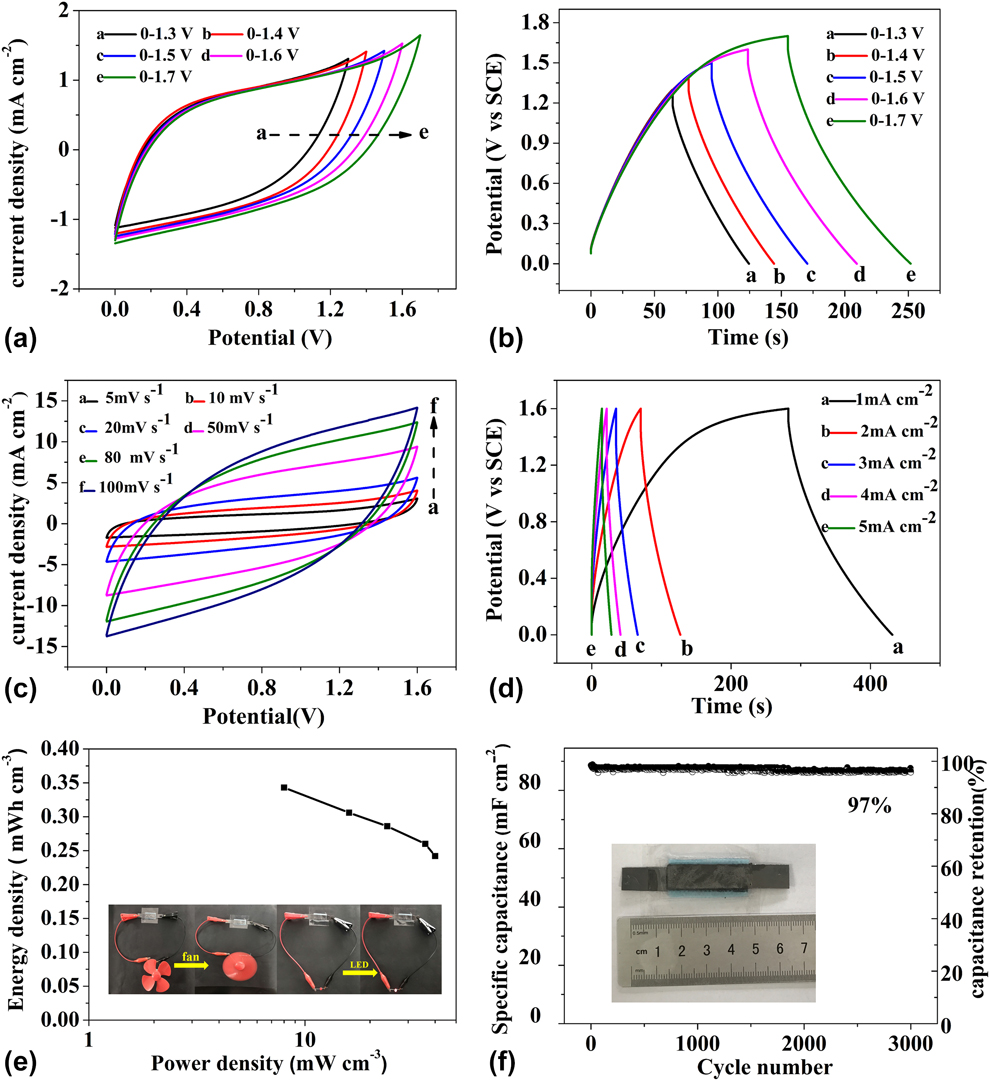
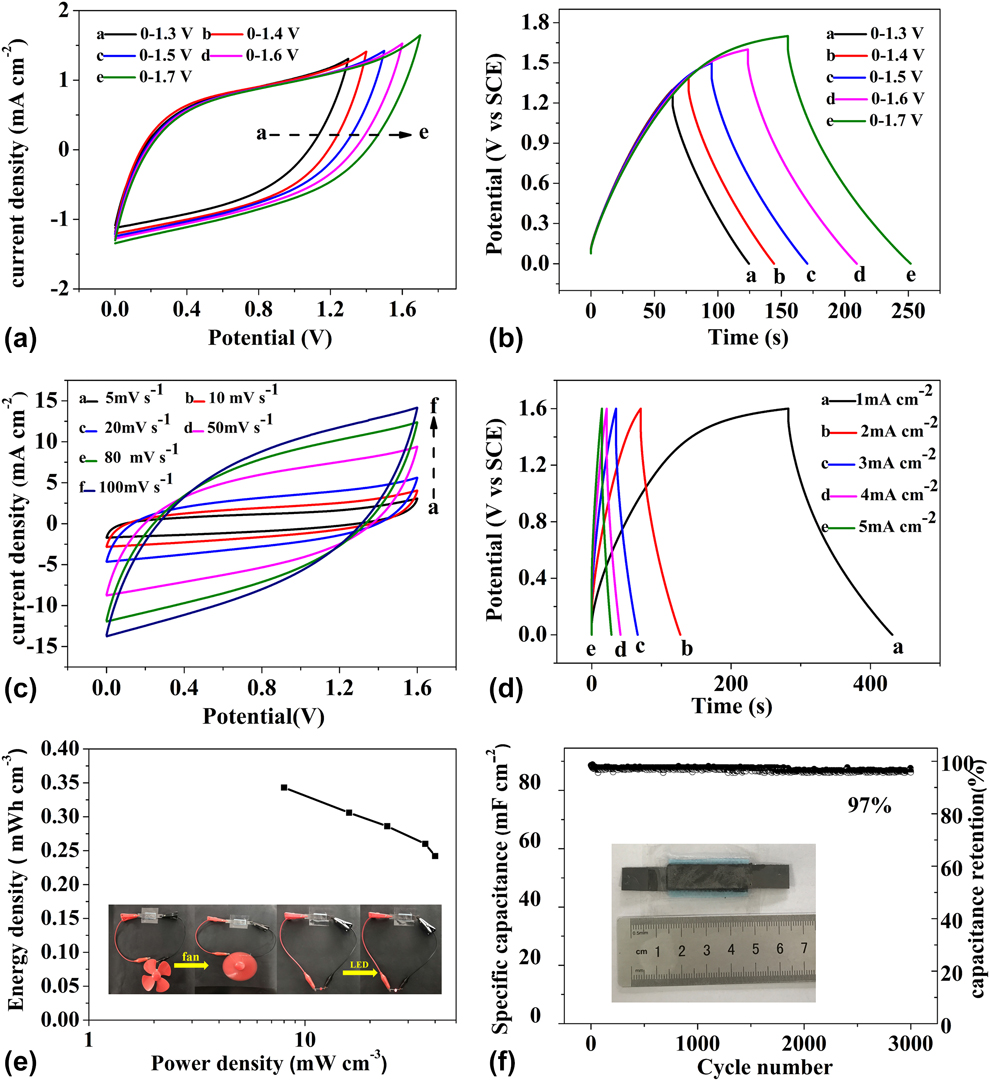
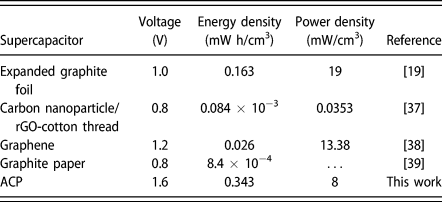
All-solid-state supercapacitor was constructed using ACP as electrode and using H2SO4-polyvinyl alcohol (PVA) gel as electrolyte without any current collectors and binders. The electrochemical capacitance performance of ACP supercapacitor was investigated by CV and GCD measurements. Figures 6(a) and 6(b) show CV curves at 5 mV/s and GCD curves at 1 mA/cm2 of ACP supercapacitor with an expanded voltage window from 1.3 to 1.7 V. Usually, a wider voltage window of supercapacitor can contribute to higher energy density. However, more obvious polarization also causes lower electrochemical cycling stability. So, the following electrochemical measurements of ACP supercapacitor were conducted at a voltage window of 1.6 V. Figure 6(c) shows CV curves of ACP supercapacitor at scan rates from 5 to 100 mV/s with voltage window from 0 to 1.6 V. The CV curves exhibits rectangular shape at different scan rates, which demonstrates excellent ideal capacitor behavior. Figure 6(d) shows GCD curves of ACP supercapacitor at current densities from 1 to 5 mA/cm2 and voltage window ranging from 0 to 1.6 V. The specific capacitance of ACP supercapacitor reaches 97 mF/cm2 at 1 mA/cm2 and still achieves 68 mF/cm2 even at 5 mA/cm2, presenting the rate capacity retention of 70%. Figure 6(e) shows the Ragone plot of ACP supercapacitor. The inset shows that an all-solid-state ACP supercapacitor can power a light-emitting diode (LED) and an electric fan. Moreover, the energy density declines from 0.343 to 0.242 mW h/cm3 when the power density increases from 8 to 40 mW/cm3. The comparison of electrochemical performance for carbon-based supercapacitors is listed in Table III. However, these as-reported supercapacitors still showed a lower energy density and output voltage. Notably, ACP supercapacitor in this study exhibits obvious higher energy density (0.343 mW h/cm3 at 1 mA/cm2) and higher output voltage. In addition, single unit of ACP supercapacitor could operate an LED and an electric fan, which is shown in the inset of Fig. 6(e). Figure 6(f) shows the cycling performance of ACP supercapacitor at 5 mA/cm2. The inset of Fig. 6(f) shows the prototype of ACP supercapacitor. The capacitance retention of 97% after 3000 cycles displays good cycling life. So, ACP supercapacitor demonstrates good application for electrochemical energy storage.
(a) CV curves and (b) GCD curves at the expanded voltage window. (c) CV curves at different scan rate. (d) GCD curves at different current densities. (e) Ragone plot of all-solid-state symmetric ACP supercapacitor. (f) Cycling capacitance retention curves of ACP supercapacitor at 5 mA/cm2.
Comparison of electrochemical performance of carbon-based supercapacitors.
Conclusions
The ACP has been prepared by the two-step electrochemical exfoliation and the hydrothermal reduction processes. The ACP with the enhanced interlayer distance could open up channels for ion diffusion. The ACP with abundant defect could enhance the reactive site of carbon paper electrode material. The as-prepared ACP electrode exhibits a high specific capacitance of 380 mF/cm2 at 1 mA/cm2 and good cycling stability with the capacitance retention ratio of 98% after 5000 cycles. The ACP supercapacitor retains the specific capacitance of 95 mF/cm2 and energy density of 0.343 mW h/cm3 at 1 mA/cm2 and an output voltage of 1.6 V. The cycling capacitance retention of 97% is achieved after 3000 cycles at high current density of 5 mA/cm2. So, the ACP electrode presents the potential application for high-performance electrochemical energy storage.
Methodology section
Preparation of ACP
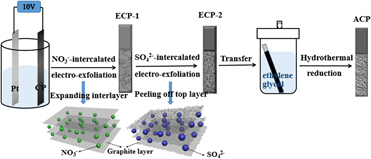
Figure 7 shows the schematic of the preparation process of ACP. Electrochemical exfoliation process is performed in a two-electrode system using an electrochemical workstation. CP was used as a working electrode and a platinum (Pt) sheet electrode was employed as a counter electrode. The two-step electrochemical exfoliation process includes the nitrate ion–assisted exfoliation and then sulfate ion–assisted exfoliation.
Schematic of the preparation process of ACP.
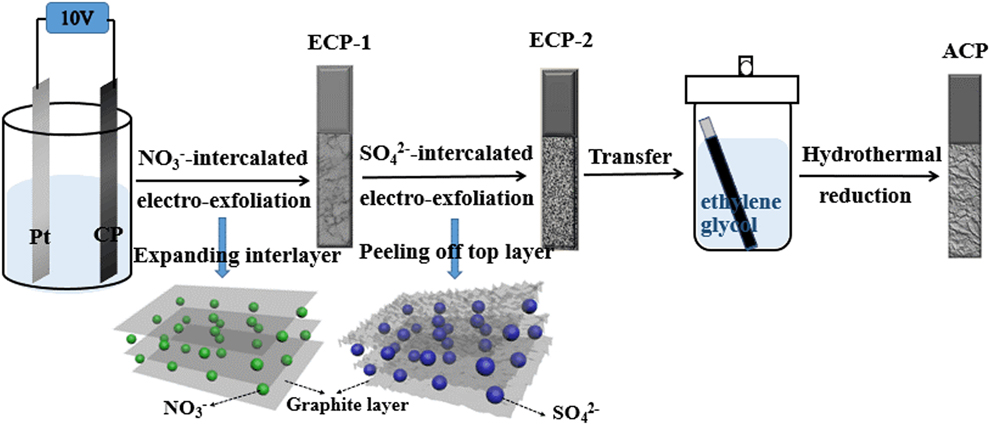
In the first step, the nitrate ion–assisted exfoliation was carried out in 1 M NaNO3 solution at an oxidation voltage of +10 V for 5 min. The obtained product was denoted as ECP-1. The carbon paper could demonstrate the graphite layer expansion especially at the edges and grain boundaries, which could promote the intercalation of other anions. According to Eqs. (2)–(4), the nitrate ions could intercalate into the carbon paper interlayer to form nitrate ion–intercalated graphite (Cx+NO3−). Cx+NO3− is thermodynamically unstable and would hydrolyze in aqueous solution to form oxygen functionalized graphite [Reference Song, Liu, Xu, Feng, Yao, Kou, Liu and Li32].
In the second step, ECP-1 conducted sulfate ion–assisted exfoliation in 1 M (NH4)2SO4 electrolyte at an oxidation voltage of +10 V for 5 min. The obtained product was denoted as ECP-2. In this process, the water molecules may co-intercalate into the expanded interlayers of ECP-1 with SO42− anion in the form of SO42−(H2O). The generated oxygen bubbles subsequently could assist the exfoliation at the defect sites of the carbon paper [see Eq. (5)]. Multilayer graphene sheets could be peeled from the top surface of ECP-1. ECP-2 kept the rough graphite layer on the top of the carbon paper. As the electrochemical process proceeds, the unstable oxygen-containing group (such as epoxy groups) might form, which lowers the stability of the carbon paper.
It is reported that ethylene glycol can reduce the unstable oxygen-containing group [Reference Xu, Yuan and Wang40].
 $${{\rm{C}}_x} + {\rm{N}}{{\rm{O}}_{\rm{3}}}^ - \to {{\rm{C}}_x}^ + {\rm{N}}{{\rm{O}}_{\rm{3}}}^ - + {{\rm{e}}^ - }\quad ,$$
 $${{\rm{C}}_x}^ + {\rm{N}}{{\rm{O}}_3}^ - + {{\rm{H}}_{\rm{2}}}{\rm{O}} \to {{\rm{C}}_x} - {\rm{OH}} + {\rm{HN}}{{\rm{O}}_3}\quad ,$$
 $${{\rm{C}}_x}^ + {\rm{N}}{{\rm{O}}_3}^ - \!+ 2{{\rm{H}}_{\rm{2}}}{\rm{O}} \to {{\rm{C}}_{x - 1}} \!-\! {\rm{COOH}} + 3{{\rm{H}}^ + } + 2{{\rm{e}}^ - } \!+\! {\rm{N}}{{\rm{O}}_{\rm{3}}}^ - \quad ,$$
 $$2{\rm{S}}{{\rm{O}}_{\rm{4}}}^{2 - }\left( {{{\rm{H}}_{\rm{2}}}{\rm{O}}} \right) \to {{\rm{O}}_2} + 4{{\rm{H}}^ + } + 2{\rm{S}}{{\rm{O}}_{\rm{4}}}^{2 - } + 4{{\rm{e}}^ - }\quad .$$
Thus, in subsequent step, the ECP-2 conducted the hydrothermal reduction process in 50 mL Teflon-lined stainless steel autoclave with 30 mL ethylene glycol solution at 180 °C for 12 h. The obtained product was denoted as ACP.
Fabrication of ACP supercapacitor
All-solid-state ACP supercapacitor was fabricated using two symmetric ACP electrodes. The acidic PVA gel electrolyte with H2SO4 was obtained by a solution casting method. One gram of PVA was dissolved in 5 mL deionized water and was continuously stirred at 80 °C for 2 h until to form a homogeneous solution. Then, 5 mL of 2 M H2SO4 was added into the above homogeneous liquid drop wise and stirred for 3 h at room temperature. Afterward, two symmetric ACP electrodes were uniformly coated with PVA–H2SO4 gel electrolyte and then dried at room temperature to evaporate excess water. A porous dialysis membrane used as a separator of two symmetric electrodes along with PVA–H2SO4 gel electrolyte were packaged together with ultra-thin plastic film to form all-solid-state ACP supercapacitor. The prototype of such an ACP symmetric supercapacitor showed very thin and compact packing characteristics.
Experimental
Materials preparation
Sodium nitrate (NaNO3, purity >99%), ammonium sulfate (NH4)2SO4, purity >99%), ethylene glycol (C2H6O2, purity >99%), and sulfuric acid (H2SO4, purity >98%) were purchased from Sinopharm Chemical Reagent Co., Ltd. China. Deionized water was used throughout all experiments.
Characterization and measurement
The morphology and microstructure of the all products were investigated using SEM (ZEISS Ultra Plus Scanning Electron Microscope, Germany). Raman spectroscopy was characterized on a Raman spectrometer (Renishaw Raman Spectrometer, United Kingdom) using a He–Ne that emitted the samples at 532 nm excitation. XRD (Bruker D8 Advance X-ray Diffractometer, Germany) were tested with the use of Cu Kα radiation source (λ = 1.54178 Å) operating at 40 kV and 40 Å.
The electrochemical performance of all products with an effective working area of 3 cm2 was investigated by CV and GCD measurement in a three-electrode configuration at a potential range from −0.1 to 0.9 V versus saturated calomel electrode (SCE) using an electrochemical workstation (CHI760C, Shanghai Chenhua Instrument Co., Ltd. China). A Pt plate and an SCE were used as the counter electrode and the reference electrode, respectively. EIS was conducted in the frequency range of 10−2 to 105 Hz. Cycling stability measurements were conducted using A battery testing system (LAND CT2001A, Wuhan LAND Electronics Co., Ltd. China). All the electrochemical tests were performed in 1 M H2SO4 aqueous solution.
Acknowledgments
The work was supported by the National Natural Science Foundation of China (No. 21373047), Graduate Innovation Program of Jiangsu Province (KYCX18_0080), the Priority Academic Program Development of Jiangsu Higher Education Institutions, and the Fundamental Research Funds for the Central Universities.