1 Introduction
Domain Adaptation (DA) considers the problem of adapting a model trained using data from one domain (i.e. source) to a different domain (i.e. target). DA methods have been successfully applied to many natural language processing (NLP) tasks such as, Part-of-Speech (POS) tagging (Blitzer et al., Reference Blitzer, McDonald and Pereira2006; Kübler & Baucom, Reference Kübler and Baucom2011; Liu & Zhang, Reference Liu and Zhang2012; Schnabel & Schütze, Reference Schnabel and Schütze2013), sentiment classification (Blitzer et al., Reference Blitzer, Dredze and Pereira2007; Li & Zong, Reference Li and Zong2008; Pan et al., Reference Pan, Ni, Sun, Yang and Chen2010; Bollegala et al., Reference Bollegala, Mu and Goulermas2015; Zhang et al., Reference Zhang, Xu and Hu2015), and machine translation (Koehn & Schroeder, Reference Koehn and Schroeder2007). Depending on the availability of labelled data for the target domain, DA methods are categorised into two groups: supervised domain adaptation (SDA) methods that assume the availability of (potentially small) labelled data for the target domain, and unsupervised domain adaptation (UDA) methods that do not. In this paper, we focus on UDA, which is technically more challenging than SDA due to the unavailability of labelled training instances for the target domain. UDA is more attractive in real-world DA tasks because it obviates the need to label target domain data.
One of the fundamental challenges in UDA is the mismatch of features between the source and target domains. Because in UDA labelled data is available only for the source domain, even if we learn a highly accurate predictor using the source domain’s labelled data, the learnt model is often useless for making predictions in the target domain. The features seen by the predictor in the source domain’s labelled training instances might not occur at all in the target domain test instances. Even in cases where there is some overlap between the source and the target domain feature spaces, the discriminative power of those common features might vary across the two domains. For example, the word lightweight often expresses a positive sentiment for mobile electronic devices such as mobile phones, laptop computers, or handheld cameras, whereas the same word has a negative sentiment associated in movie reviews, because a movie without any dramatic or adventurous storyline is often perceived as boring and lightweight. Consequently, a classifier learnt from reviews on mobile electronic devices is likely to predict a movie review that contains the word lightweight to be positive in sentiment.
To overcome the above-mentioned feature mismatch problem in UDA, a popular solution is to learn a projection (possibly lower-dimensional) between the source and the target domain feature spaces (Blitzer et al., Reference Blitzer, McDonald and Pereira2006, Reference Blitzer, Dredze and Pereira2007; Pan et al., Reference Pan, Ni, Sun, Yang and Chen2010). To learn such a projection, first, we must identify a subset of the features that are common to the two domains. Such domain-independent features that can be used to learn a projection are often called pivots. For example, in structural feature alignment (SFA) (Pan et al., Reference Pan, Ni, Sun, Yang and Chen2010), a bipartite graph is constructed between the domain-independent (pivots) and domain-specific features. Next, spectral methods are used to learn a lower-dimensional projection from the domain-specific feature space to the domain-independent feature space. Using the learnt projection, we can transform a liner classifier trained using source domain’s labelled training instances to classify test instances in the target domain. On the other hand, structural correspondence learning (SCL) (Blitzer et al., Reference Blitzer, McDonald and Pereira2006, Reference Blitzer, Dredze and Pereira2007) first learns linear binary classifiers to predict the presence (or absence) of a pivot in a review. Next, the learnt pivot predictors are projected to a lower-dimensional space using singular value decomposition (SVD). As seen from SCL and SFA examples, pivots play an important role in many UDA methods (Bollegala et al., Reference Bollegala, Weir and Carroll2011, Reference Bollegala, Weir and Carroll2014, Reference Bollegala, Mu and Goulermas2015; Yu & Jiang, Reference Yu and Jiang2015).
Different strategies for selecting pivots such as the frequency of a pivot in a domain (FREQ), mutual information (MI), or pointwise mutual information (PMI) between a pivot and a domain label have been proposed in the literature. Despite the significant role played by pivots in UDA, to the best of our knowledge, no comparative study has been conducted evaluating the different pivot selection strategies. In particular, it remains unclear as to (a) how the sets of pivots selected using two selection strategies differ in practice?, and (b) what is the relative gain/loss in performance in an UDA task when we use pivots selected using a particular selection strategy?. In this paper, we answer both questions (a) and (b) by conducting a comparative study covering three previously proposed pivot selection strategies (i.e. FREQ, MI, and PMI) using cross-domain sentiment classification as a concrete UDA task. Specifically, to answer (a) we conduct an experiment where we compare two lists of pivots ranked according to two different pivot selection strategies using the Jaccard coefficient. High Jaccard coefficients indicate that the pivots selected by the two methods are similar. To answer (b), we set up an experiment where we use pivots selected using different strategies to train a cross-domain sentiment classifier using two UDA methods, namely SCL and SFA. Although we limit our evaluation to cross-domain sentiment classification because it is the most frequently used benchmark task for UDA methods in the NLP community, pivot selection is not limited to sentiment classification and appears in other DA tasks such as cross-domain POS tagging (Blitzer et al., Reference Blitzer, McDonald and Pereira2006) and cross-domain-named entity recognition (Jiang & Zhai, Reference Jiang and Zhai2007). Moreover, we evaluate the effectiveness of using labelled vs. unlabelled data for pivot selection.
Our experimental results reveal several interesting facts about the pivot selection strategies for UDA.
∙ For a particular pivot selection strategy, it turns out that it is better to select pivots using the labelled data for the source domain as opposed to unlabelled data for both domains. This result indicates that source domain labelled data play two distinctive roles in UDA. First, with more labelled data for the source domain we will be able to learn a more accurate predictor for a DA task. Second, and a less obvious effect is that we can identify better pivots using source domain labelled data. Indeed, prior work on multi-domain UDA (Bollegala et al., Reference Bollegala, Weir and Carroll2011; Mansour et al., Reference Mansour, Refaei, Gamon, Sami and Abdel-Hamid2013) show that the performance of an UDA method on a single target domain is improved by simply combining multiple source domains.
∙ Although there are a moderate level (i.e. Jaccard coefficients in the range [0.6, 0.8]) of overlap and a low level of rank similarity (i.e. Kendall coefficients in the range [0.1, 0.3]) among the top-ranked pivots selected using different strategies, the overlap quickly decreases when we select more pivots whereas the rank similarity increases. This result shows that different pivot selection strategies compared in this paper are indeed selecting different sets of features, and pivot selection strategy is an important component in an UDA method. Considering that in existing UDA methods pivots are selected in a pre-processing step that happens prior to the actual DA, we believe that our findings will influence future work on UDA to more carefully consider the pivot selection strategy.
In contrast to prior proposals to use MI as a pivot selection strategy (Blitzer et al., Reference Blitzer, Dredze and Pereira2007; Pan et al., Reference Pan, Ni, Sun, Yang and Chen2010), in our experiments PMI (Bollegala et al., Reference Bollegala, Mu and Goulermas2015) turns out be a better alternative. However, there is no clear single best pivot selection strategy for all source-target domain-pairs when applied to two state-of-the-art UDA methods. This raises several interesting questions such as whether there are even better pivot selection strategies, or pivot selection should be a domain-sensitive decision, which we leave for future work.
2 Background
Different DA methods have been proposed in the literature, by learning a lower-dimensional projection to reduce the mismatch between features in the source domain and the target domain. In this section, we will discuss three representative DA methods: SCL, SFA, and Sentiment Sensitive Thesaurus (SST) as well as the pivot selection methods have been used in these DA methods.
2.1 SCL
SCL (Blitzer et al., Reference Blitzer, McDonald and Pereira2006) is a method to automatically identify the correspondence between a source domain and a target domain to reduce the mismatch of the features in both domains. This method was initially introduced based on the task of POS tagging and later applied in sentiment analysis (Blitzer et al., Reference Blitzer, Dredze and Pereira2007). We can see from Algorithm 1, first, SCL selects k features by certain selection methods. Step 2, k binary predictors are trained to model the correlation of pivot features and non-pivot features. Step 3, SVD is performed on the weight matrix to learn a lower-dimensional projection for the pivot predictors. Finally, a binary logistic regression learner is trained on labelled data represented as the concatenation of (a) the original features and (b) the predicted pivot features.

Blitzer et al. (Reference Blitzer, McDonald and Pereira2006) defined pivots as features that behave in the same way for discriminative learning in both source and target domains. They selected features that occur frequently in both source and target domains as pivots. This pivot selection strategy does not require any labelled data, and was shown to perform well for sequence labelling tasks such as POS tagging, and dependency parsing. However, for discriminative classification tasks such as sentiment classification, Blitzer et al. (Reference Blitzer, Dredze and Pereira2007) showed that MI to be a better pivot selection strategy than frequency. In this strategy, MI between a feature and source domain positive and negative sentiment labelled reviews are computed. Next, features that have high MI with either positive or negative labelled reviews are considered as pivots. The expectation here is that features that are discriminative of sentiment in the source domain will also be discriminative for the sentiment expressed in the target domain. This approach requires source domain labelled data for selecting pivots.
2.2 SFA
SFA (Pan et al., Reference Pan, Ni, Sun, Yang and Chen2010) is a method designed for cross-domain sentiment classification. Algorithm 2 Step 1 all the features are divided into two groups mutually exclusive: domain-independent and domain-specific. Step 2 and Step 3 SFA constructs a bipartite graph between domain-independent and domain-specific features based on their total number of co-occurrence in the same instance across two domains. Step 4 and Step 5 SFA adapts spectral clustering to create a lower dimensional representation by top eigenvectors for projecting domain-specific features. Similar to SCL, the final step is to learn a binary logistic regression model using labelled data from the source domain by (a) the original features and (b) the projected domain-specific features.
Pan et al. (Reference Pan, Ni, Sun, Yang and Chen2010) proposed an alternative definition of pivots where they select features that are common to both source and target domains as pivots. They refer to such features as domain-independent features, whereas all other features are considered as domain-specific. They proposed the use of MI between a feature and unlabelled training instances in each domain as a pivot selection strategy. If a particular feature has low MI with both the source and the target domains, then it is likely to be a domain-independent feature. Considering that the amount of unlabelled data are much larger than that of source domain labelled data in UDA settings, we can make better estimates of MI using unlabelled data. However, we cannot select pivots that discriminate the classes related to the target prediction task (e.g. sentiment classification) using only unlabelled data.
2.3 SST
SST (Bollegala et al., Reference Bollegala, Mu and Goulermas2015) is a method to automatically create a thesaurus to group different features that express the same sentiments for cross-domain sentiment classification. We show the procedure in Algorithm 3. Step 1, each feature x is represented as a feature vector x by a set of features that co-occur with x and a set of sentiment features by the source labelled instances that x occurs. Step 2, SST measures the relatedness τ to other features and group them in the descending order of relatedness score to create a thesaurus. Additionally, SST creates sentiment features for a thesaurus by using the labelled information in the source instances that x occurs. After that, in Steps 3 and 4,the instance vector of d is expanded by inducting top k-related features from the thesaurus created in the previous step. Finally, a binary classifier is learnt using expanded document vectors
 $${d}'$$
.
Bollegala et al. (Reference Bollegala, Mu and Goulermas2015) proposed PMI (Church & Hanks, Reference Church and Hanks1990) as a pivot selection strategy for UDA. PMI has established as an accurate word association measure and have been applied in numerous NLP tasks such as collocation detection (Manning & Schütze, Reference Manning and Schütze1999), word similarity measurement (Turney, Reference Turney2001), relational similarity measurement (Turney, Reference Turney2006), etc. However, PMI as a strategy for pivot selection has not been compared against MI and frequency-based strategies.
As discussed above, SCL and SFA are the state-of-art DA methods, both of them heavily rely on the selection of pivots. In SCL, performing SVD is a higher time complexity process than other two methods. The experiments from original paper of SST (Bollegala et al., Reference Bollegala, Mu and Goulermas2015) suggested SST performed better than other two on combining multiple source domains, which requires more computation space than one-to-one cross-domain tasks. Otherwise, depending on the quality and relatedness of source domain, increasing the number of source domains involved in the method may not help the performance. SFA has the strength of lower time complexity, however, not all the features can be clearly defined into two groups (domain-specific and domain-independent) which may also drop the performance (Bollegala et al., Reference Bollegala, Mu and Goulermas2015).


Three distinct measures for selecting pivots proposed in three different UDA methods can be identified in the literature: FREQ, MI, and PMI. Moreover, those measures have been computed using either unlabelled data (available for both source as well as target domain), or labelled data (available only for the source domain). Next, we will conduct a systematic comparative study considering all possible combinations between types of data (labelled vs. unlabelled), and pivot selection strategies (FREQ, MI, PMI).
3 Pivot selection strategies for UDA
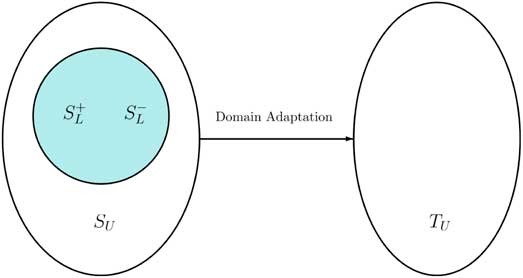
Let us consider the UDA setting shown in Figure 1 where we would like to adapt a model trained using labelled data from a source domain
 $${\cal S}$$
to a different target domain
 $${\cal T}$$
. We consider binary classification tasks involving a single source-target domain pair for simplicity. However, the pivot selection strategies we discuss here can be easily extended to multi-DA settings and other types of prediction tasks, not limiting to binary classification. In UDA, we assume the availability of labelled training data from the source domain for a particular task. For the binary classification setting we consider here, let us assume that we are given some positively and negatively labelled data for the task, denoted, respectively, by
 $${\cal S}_{L}^{{\plus}} $$
and
 $${\cal S}_{L}^{{\minus}} $$
. In addition to these labelled datasets, in UDA we have access to unlabelled datasets
 $${\cal S}_{U} $$
and
 $${\cal T}_{U} $$
, respectively, from the source and the target domains.
Unsupervised domain adaptation from
 $${\cal S}$$
to
 $${\cal T}$$

Next, we consider three popular pivot selection strategies proposed in prior work in UDA.
3.1 FREQ
If a feature x occurs a lot in both the source and the target domain unlabelled training instances (
 $${\cal S}_{U} $$
and
 $${\cal T}_{U} $$
), then it is likely that x is not specific to the source or the target domain. Therefore, we might be able to adapt a model trained using source domain’s labelled data to the target domain using such features as pivots. This approach was first proposed by Blitzer et al. (Reference Blitzer, McDonald and Pereira2006), and was shown to be an effective strategy for selecting pivots for cross-domain POS tagging and dependency parsing tasks. The frequency of a feature x in a set of training instances
 $${\cal D}$$
is computed as follows:
 $$\matrix{ {h(x,\,d)\,{\equals}\,\left\{ {\matrix{ 1 & {\hskip -12pt if\,x\ind} \,\in \, d\cr 0 & {{\rm otherwise}} \cr } } \right.} \cr\cr{{\hskip -41pt \rm FREQ}(x,\,{\cal D})\,{\equals}& \mathop{\sum}\limits_{d\in{\cal D}} h(x,\,d)} \cr } $$
d denotes a document in
 $${\cal D}$$
. Then we can compute the pivothood (the degree to which a feature is likely to become a pivot) of x as follows:
 $${\rm FREQ}_{U} (x){\equals}\min ({\rm FREQ}(x,\,{\cal S}_{U} ),\,{\rm FREQ}(x,\,{\cal T}_{U} ))$$
We sort features x in the descending order of their pivothood given by (2), and select the top-ranked features as pivots to define a pivot selection strategy based on frequency and unlabelled data.
One drawback of selecting pivots using (2) for discriminative classification tasks such as cross-domain sentiment classification is that the pivots with high FREQ(
 $$x,\,{\cal S}_{U} $$
) could be specific to the sentiment in the source domain, therefore not sufficiently discriminative of the target domain’s sentiment. To overcome this issue, Blitzer et al. (Reference Blitzer, Dredze and Pereira2007) proposed the use of source domain labelled data, which leads to the following pivothood score:Footnote
1
 $${\rm FREQ}_{L} (x)\,{\equals}\,\left| {{\rm FREQ}(x,\,{\cal S}_{L}^{{\plus}} ){\minus}{\rm FREQ}(x,\,{\cal S}_{L}^{{\minus}} )} \right|$$
Here, if a x is biased towards either one of
 $${\cal S}_{L}^{{\plus}} $$
or
 $${\cal S}_{L}^{{\minus}} $$
, then it will be a good indicator of sentiment in the source domain. The expectation in this proposal is that such sentiment-sensitive features will be useful for discriminating the sentiment in the target domain as well. We sort features in the descending order of their pivothood scores given by (3), and select the top-ranked features as pivots to define a pivot selection strategy based on frequency and labelled data.
3.2 MI
Using raw frequency to measure the strength of association between a feature and a set of instances is problematic because it is biased towards frequent features, irrespective of their association to the set of instances. MI overcomes this bias by normalising the feature occurrences, and has been used as a pivot selection strategy in prior work on UDA (Blitzer et al., Reference Blitzer, Dredze and Pereira2007; Pan et al., Reference Pan, Ni, Sun, Yang and Chen2010). MI between a feature x and a set of instances
 $${\cal D}$$
is given by:
 $${\rm MI}(x,{\cal D}){\equals}\,p(x,{\cal D})\log \left( {{{p(x,\,{\cal D})} \over {p(x)p({\cal D})}}} \right)$$
We compute the probabilities in (4) using frequency counts as follows:
 $$\eqalignno{ p(x,{\cal D})\,{\equals}\, & {\rm FREQ}(x,{\cal D})/{\rm FREQ}({\asterisk},{\asterisk}) \cr p(x)\,{\equals}\, & {\rm FREQ}(x,{\asterisk})/{\rm FREQ}({\asterisk},{\asterisk}) \cr p({\cal D})\,{\equals}\, & {\rm FREQ}({\asterisk},{\cal D})/{\rm FREQ}({\asterisk},{\asterisk}) $$
We use ‘*’ to denote the summation over the set of values (e.g. set of features, or sets of instances for all domains) a particular variable can take.
Blitzer et al. (Reference Blitzer, Dredze and Pereira2007) consider features that are associated with one of the two classes (e.g. positive or negative sentiment) to be more appropriate as pivots. Based on their proposal, we define the following pivothood score:
 $${\rm MI}_{L} (x)\,{\equals}\,\left| {{\rm MI}(x,\,{\cal S}_{L}^{{\plus}} ){\minus}{\rm MI}(x,{\cal S}_{L}^{{\minus}} )} \right|$$
We rank features x in the descending order of their MI L (x) scores, and select the top-ranked features as pivots to define a pivot selection strategy based on MI and labelled data.
Pan et al. (Reference Pan, Ni, Sun, Yang and Chen2010) used MI with unlabeled data to select pivots. They argue that features that have low MI with both source and the target domains are likely to be domain-independent features, thus more appropriate as intermediate representations for DA. Their proposal can be formalised to define a pivothood score as follows:
 $${\rm MI}_{U} (x)\,{\equals}\,\min ({\rm MI}(x,\,{\cal S}_{U} ),{\rm MI}(x,{\cal T}_{U} ))$$
Here, we sort features x in the ascending order of their MI U (x) scores, and select the top-ranked features as pivots to define a pivot selection strategy based on MI and unlabelled data.
3.3 PMI
PMI between a feature x and a set of training instances
 $${\cal D}$$
is given by:
 $${\rm PMI}(x,{\cal D})\,{\equals}\,\log \left( {{{p(x,{\cal D})} \over {p(x)p({\cal D})}}} \right)$$
where the probabilities are computed in the same manner as described in Section 3.2. Unlike, MI, PMI does not weight the amount of information obtained about one random event by observing another by the joint probability of the two events. PMI has been used extensively in NLP for measuring the association between words (Church & Hanks, Reference Church and Hanks1990). Because MI takes into account all the joint possibilities (i.e. by multiplying with joint probabilities) its value can become too small and unreliable when the feature space is large and sparse. To overcome this disfluency, Bollegala et al. (Reference Bollegala, Mu and Goulermas2015) proposed PMI as a pivot selection strategy for UDA.
Analogous to MI L and MI U defined, respectively, by (5) and (6), we define two PMI-based pivothood scores PMI L and MI U as follows:
 $${\rm PMI}_{L} (x)\,{\equals}\,\left| {{\rm PMI}(x,\,{\cal S}_{L}^{{\plus}} ){\minus}{\rm PMI}(x,\,{\cal S}_{L}^{{\minus}} )} \right|$$
 $${\rm PMI}_{U} (x)\,{\equals}\,\min ({\rm PMI}(x,\,{\cal S}_{U} ),{\rm PMI}(x,\,{\cal S}_{U} ))$$
We sort the features x separately in the descending order of PMI L (x), and in the ascending order of PMI U (x) scores, and select the top-ranked features to define two pivot selection strategies based on PMI.
4 Experiments
Pivot selection strategies do not concern a specific DA task, hence can be applied in any UDA method that requires a set of pivots. As a concrete evaluation task, in this paper we use cross-domain sentiment classification, where the goal is to learn a binary sentiment classifier for a target domain using the labelled data from a source domain. This problem has been frequently used in much prior work on UDA as an evaluation task. Therefore, by using cross-domain sentiment classification as an evaluation task, we will be able to perform a fair comparison among the different pivot selection strategies described in Section 3.
In our experiments, we use the multi-domain sentiment data setFootnote
2
produced by Blitzer et al. (Reference Blitzer, Dredze and Pereira2007). This data set consists of Amazon product reviews for four different product types: books (B), DVDs (D), electronics (E), and kitchen appliances (K). Each review is assigned with a rating (1–5 stars), a reviewer name and location, a product name, a review title and date, and the review text. Reviews with rating >3 are labelled as positive, whereas those with rating <3 are labelled as negative. For each domain, there are 1000 positive and 1000 negative examples, the same balanced composition as the polarity data set constructed by Pang et al. (Reference Pang, Lee and Vaithyanathan2002). The data set also contains unlabelled reviews (the number of unlabelled review for each domain shown within brackets) for the four domains K (16,746), D (34,377), E (13,116), and B (5947). Following previous work, we randomly select 800 positive and 800 negative labelled reviews from each domain as training instances (total number of training instances are 1600×4=6400), and the remainder is used for testing (total number of test instances are 400×4=1600). With the four domains in the data set, we generate
 $${4 \over 2}{\equals}12$$
UDA tasks, which we denote by the source-target domain labels. We select pivots for each pair of source-target domains using 3×2=6 strategies (FREQ, MI, PMI with
 $${\scr L}$$
or
 $${\cal U}$$
).
4.1 Pivot overlap and rank similarity
The degree of overlap between the top k-ranked pivots selected by two strategies is an indicator of the similarity between those strategies. To measure the overlap between the top k-ranked pivot sets ϕ k (M 1 ) and ϕ k (M 2 ) selected, respectively, by two strategies M 1 and M 2 , we compute their Jaccard coefficient, J(M 1 , M 2 ), as follows:
 $$J(M_{1} ,M_{2} )\,{\equals}\,{{\left| {\phi _{k} (M_{1} )\,{\cap}\,\phi _{k} (M_{2} )} \right|} \over {\left| {\phi _{k} (M_{1} )\,{\cap}\,\phi _{k} (M_{2} )} \right|}}$$
A pivot selection strategy must ideally rank pivots that are useful for DA at the top. However, Jaccard coefficient is insensitive to the ranking among pivots selected by different strategies. To compare the ranks assigned to the common set of pivots selected by two different pivot selection strategies M 1, and M 2, we compute their Kendall’s rank correlation coefficient, τ(M 1, M 2). In practice, pivots selected by M 1 and M 2 will be different. To overcome this issue when comparing ranks of missing elements, we limit the computation of τ(M 1, M 2) to the intersection ϕ k (M 1)∩ϕ k (M 2).
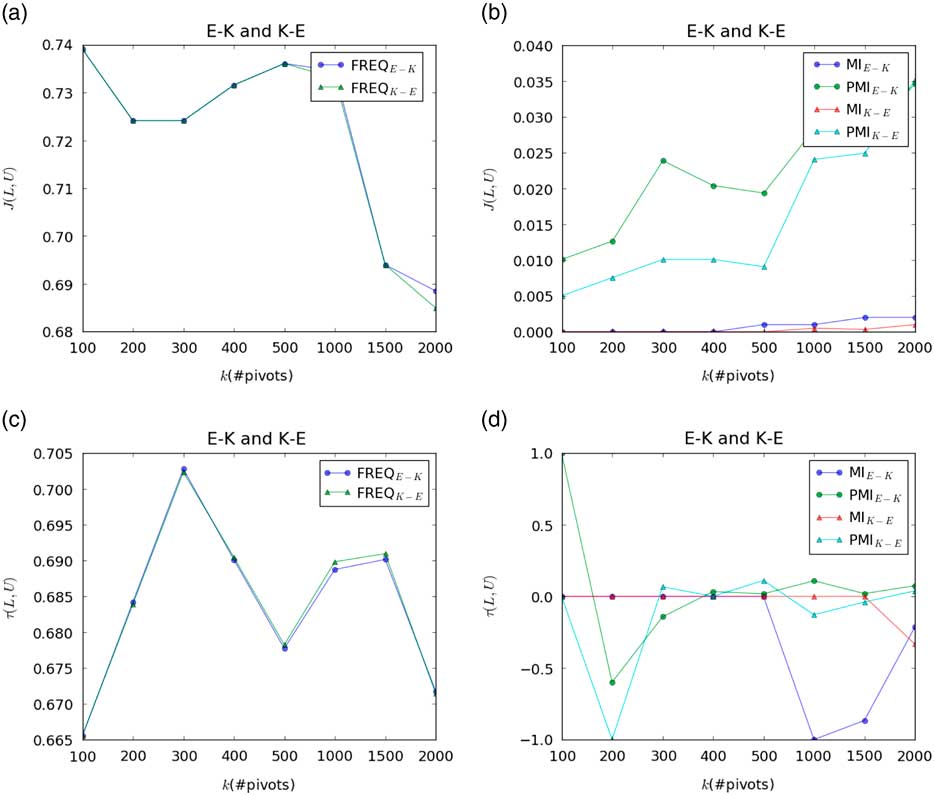
For each pivot selection strategy we compute the overlap between the top-k pivots selected using labelled data and unlabelled data. Figure 2 shows the results for adapting between E and K domains. From Figures 2(a) and 2(b) we see that there is a high overlap between the sets of pivots selected from labelled and unlabelled data using FREQ, compared to that by MI or PMI. This shows that FREQ is relatively insensitive to the label information in the training instances. However, when we increase the number of pivots k selected by a strategy, the overlap gradually drops with FREQ whereas it increases with MI and PMI. This shows that despite the overlap of pivots at top ranks is smaller, it increases when we select more pivots. Because existing UDA methods typically use a smaller (less than 500) set of pivots, the differences between MI and PMI methods will be important.
Jaccard coefficient J(L, U) (a and b) and Kendall coefficient τ(L, U) (c and d) for the E–K and K–E adaptation tasks are shown against k of top-k ranked pivots selected using frequency of a pivot in a domain (FREQ) (left), mutual information (MI) and pointwise mutual information (PMI) (right) strategies. k(#pivots) stands for number of top ranked pivots.

Figures 2(c) and 2(d) show that there is a high correlation between the top ranked pivots, which drops steadily when we select more pivots with a strategy. Because we limit the computation of τ(M 1, M 2) to the common pivots, the Kendall coefficients obtained for smaller overlapping sets (corresponding to smaller Jaccard coefficients) contain a smaller number of pairwise comparisons, hence insignificant.
Similar trends were observed for all 12 domain pairs. This shows that PMI and MI rank very different sets of pivots at the top ranks. This result supports the proposal by (Blitzer et al., Reference Blitzer, Dredze and Pereira2007) to use MI, and (Bollegala et al., Reference Bollegala, Mu and Goulermas2015) to use PMI, instead of FREQ for selecting pivots for discriminative DA tasks such as sentiment classification.
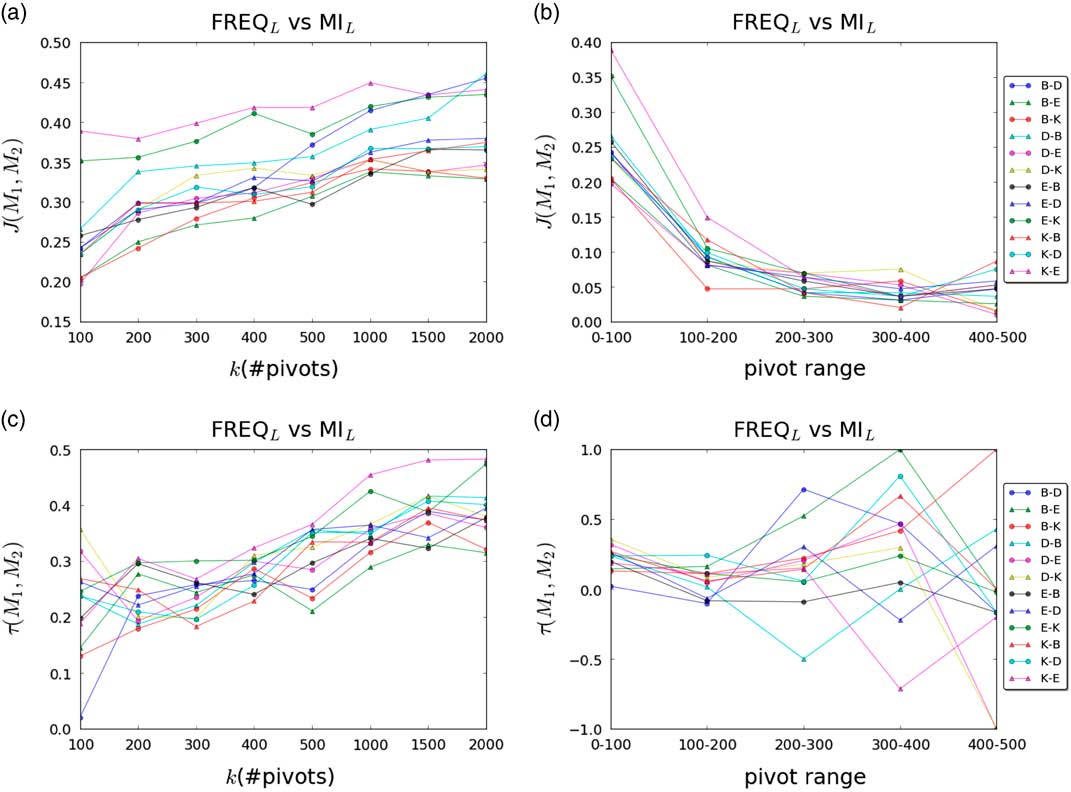
We compare FREQ, MI, and PMI strategies among each other for the same type (labelled or unlabelled) of data. Due to the limited availability of space, we show results for the comparisons between FREQ L and MI L in Figure 3. From Figure 3(a) and 3(c) we see that the overlap and the correlation between the rankings for the sets of pivots selected by those two strategies increase with the number of pivots selected. However, as seen from Figure 3(b), the amount of overlap decreases with the number of pivots selected. The overlap between pivots sets is too small to derive any meaningful comparisons using Kendall coefficient beyond 100–200 range. This result implies that although there is some overlap among the top-ranked pivots selected by FREQ and MI from labelled data, the resemblance decreases when we consider lower ranks. Similar trends could be observed for FREQ U vs. MI U , FREQ L vs. PMI L , and FREQ U vs. PMI U . PMI vs. MI show a high degree of overlap (Jaccard coefficients in the range [0.7, 0.9]) compared to FREQ vs. PMI and FREQ vs. MI, which can be explained by the close relationship between the definitions of PMI and MI.
Cumulative and marginal comparisons of pivots selected by FREQ L and MI L . (a) Cumulative comparison of Jaccard coefficient; (b) marginal comparison of Jaccard coefficient; (c) cumulative comparison of Kendall coefficient; (d) marginal comparison of Kendall coefficient.

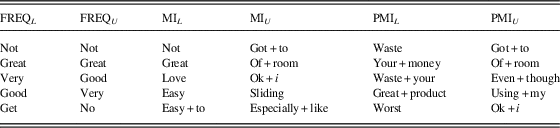
Table 1 shows the top five pivots selected by different strategies for the UDA setting K-E. We see a high overlap between the sets of pivots selected by FREQ L and FREQ U , indicating the insensitivity of FREQ to the label information. Moreover, we see that with MI- and PMI-based strategies retrieve bigrams as pivots, which would not be ranked at the top by FREQ because the frequency of bigrams are typically smaller than that of the constituent unigrams.
Top five pivots selected from the six strategies for K-E

FREQ=frequency of a pivot in a domain; MI=mutual information; PMI=pointwise mutual information.
Bigrams are denoted by ‘+’.
4.2 Cross-domain sentiment classification
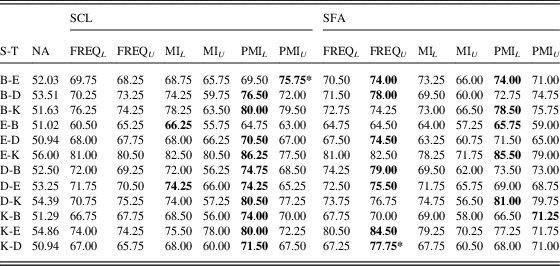
To compare the different pivot selection strategies under a UDA setting, we use the selected pivots in two state-of-the-art cross-domain sentiment classification methods: SCL (Blitzer et al., Reference Blitzer, Dredze and Pereira2007), and SFA (Pan et al., Reference Pan, Ni, Sun, Yang and Chen2010). In both methods, we train a binary logistic regression model as the sentiment classifier using unigram and bigram features extracted from Amazon product reviews. The performance of UDA is measured by the classification accuracy — the percentage of correctly classified target domain test reviews. All parameters in SCL and SFA are tuned using validation data selected from extra domains in the multi-domain sentiment data set. Target domain classification accuracies for all 12 adaptation tasks are shown for SCL and SFA (Table 2). We choose top-500 pivots for every pivot selection strategy, and project to 50 dimensional spaces, as recommended for SCL and SFA (Blitzer et al., Reference Blitzer, Dredze and Pereira2007; Pan et al., Reference Pan, Ni, Sun, Yang and Chen2010). NoAdapt (NA) baseline applies a binary classifier trained on the source domain’s labelled instances directly on the target domain’s test instances without performing any DA. NA baseline shows the level of performance we would obtain if we did not perform DA. The almost random level accuracy of the NA baseline emphasises the difficulty of the task and the importance of performing DA.
Accuracy of structural correspondence learning (SCL) and structural feature alignment (SFA) under different pivot selection strategies

NA=NoAdapt; FREQ=frequency of a pivot in a domain; MI=mutual information; PMI=pointwise mutual information.
For a domain pair, best results are bolded, whereas statistically significant improvements over the second best (according to Clopper–Pearson confidence intervals α=0.05) are indicated by ‘*’.
Overall for both SFA and SCL, we see that for MI and PMI the labelled version performs equally or better than the corresponding unlabelled version. This indicates that source labelled data are important in UDA not only because it is the only source of data that can be used to train a supervised classifier for the target task, but also it enables us to select task specific pivots. For SCL, PMI
L
is the single best (10 out of 12 pairs) pivot selection strategy, whereas for SFA it is FREQ
U
(7 out of 12 pairs). SCL uses pivot predictors as extra features for learning an adaptative classifier. By using PMI
L
, the selected pivots consider both mutual association and overcoming the problem of small values if the feature space is large and sparse (Section 3.3). SFA builds a bi-partite graph between pivots and non-pivots based on a co-occurrence matrix. FREQ
U
selects pivots from a larger set of instances (
 $${\cal S}_{U} {\plus}{\cal T}_{U} \,\gt\,{\cal S}_{L}^{{\plus}} {\plus}{\cal S}_{L}^{{\minus}} $$
) that the effect of unlabelled version is more obvious than the labelled version. Overall MI
U
turns out to be the worst strategy. In addition, FREQ
U
performs better than the labelled version in SFA because it was computed using a larger number of unlabelled instances from both domains.
B-E pair is exceptional in the sense that for SCL it is the only domain-pair where PMI reports better results for the unlabelled strategy than the labelled strategy. This can be explained by the fact that B has the smallest number of unlabelled instances for a single domain, and B-E pair collectively has the smallest number of unlabelled instances for any domain pair. Consequently, the selected pivots occur in the target domain more than in the source domain, making the projection biased towards the target domain’s feature distribution. Considering the fact that such unbalanced unlabelled data sets are likely to exist in real-world UDA settings, we believe that it is important to develop robust UDA methods that take into account such biases.
5 Conclusions
We studied the effect of pivot selection strategies on UDA when computed using the labelled data from the source domain, and the unlabelled data from both the source and the target domains. We measured the overlap and the rank similarity among the top-ranked pivots selected using different strategies. These differences among strategies indicate their different performance in using UDA method doing a NLP task. Using cross-domain sentiment classification as an evaluation task, we empirically evaluated the different pivot selection strategies in conjunction with SCL and SFA. The results from different strategies vary on different domain pairs. Overall for SCL, PMI using labelled data turns out to be the best, for SFA is FREQ using unlabelled data. Our experiments reveal useful insights into the role played by pivots in UDA, the label information helps the performance in most of the cases and there is no single best pivot selection strategy to feature-based UDA methods. We hope these insights will motivate the NLP community to develop better UDA methods as well as better pivot selection strategies.
Acknowledgements
The authors would like to thank all the anonymous reviewers, and the support from editors.