Implications
On one hand, there are currently many experiments carried out in order to assess and improve livestock welfare and, indirectly, give a better brand image of agriculture to consumers. On the other hand, environmental effects of agriculture are more and more considered, especially its impact on global warming. Without forgetting economic profitability, farmers must compromise between all these aspects. The goal of this trial was thus to bring some scientific elements in this debate. We observed an increase of ammonia emissions and a decrease of greenhouse gases (GHG) emissions related to greater space allowance for gestating sows group-housed on deep litter.
Introduction
By 2013, the use of individual gestation accommodations for dry sows will be banned in the European Union (directive 2001/88/CE) and sows will have to be kept in groups at least from 4 weeks after insemination till 1 week before farrowing. This directive fixes also the minimal legal space allowance to 2.25 m2/sow and 1.64 m2/gilt, plus or minus 10% if the pigs number in the group is lower than six animals or upper than 40 animals, respectively. Behavioural impact of an increased space allowance has been quite largely studied with gestating sows, concluding in improved welfare with lower animal density (Salak-Johnson et al., Reference Salak-Johnson, Niekamp, Rodriguez-Zas, Ellis and Curtis2007; Remience et al., Reference Remience, Wavreille, Canart, Meunier-Salaün, Prunier, Bartiaux-Thill, Nicks and Vandenheede2008). However, effects of space allowance on environmental parameters, such as gaseous emissions, have been slightly studied, especially with pigs kept on litter.
Ammonia (NH3) emissions contribute to soil and water acidification and eutrophication and to indirect emissions of nitrous oxide (N2O) (Intergovernmental Panel on Climate Change (IPCC), 2006). Furthermore, NH3 is well known as a toxic gas, irritating the respiratory tract at concentrations exceeding 15 ppm (Banhazi et al., Reference Banhazi, Seedorf, Rutley and Pitchford2008). In Europe, approximately 80% of NH3 production originated from animal production facilities (Reidy et al., Reference Reidy, Webb, Misselbrook, Menzi, Luesink, Hutchings, Eurich-Menden, Doher and Dammgen2009).
The GHG associated with livestock production are N2O, methane (CH4) and carbon dioxide (CO2). These gases take part to the global warming and climate change issues. The global warming potential (GWP) of a specific gas evaluates its contribution on the global warming. It depends on its absorption of infrared radiation, the spectral location of its absorbing wavelengths and on its atmospheric lifetime. Commonly, a time horizon of 100 years is used as regards to average lifetime of GHG. N2O and CH4 are important contributors because their GWP over a 100-year period are 21 and 310 times that of CO2, respectively (IPCC, 2007). N2O also contributes to the destruction of the ozone shield. The case of CO2 is specific because it is usually estimated that CO2 production by livestock is compensated by CO2 consumption by photosynthesis of plants used as feed. Therefore, according to IPCC guidelines (IPCC, 2006), CO2 emissions from livestock are not estimated. However, experiments carried out with weaning and fattening pigs (Philippe et al., Reference Philippe, Laitat, Canart, Vandenheede and Nicks2007a and Reference Philippe, Laitat, Canart, Vandenheede and Nicks2007b; Cabaraux et al., Reference Cabaraux, Philippe, Laitat, Canart, Vandenheede and Nicks2009) showed that CO2-emissions might differ in relation to housing conditions while diet characteristics, feed intakes, animal performances, and climate conditions were similar. The study of CO2 production from livestock buildings is also important because reference emissions factors are needed for ventilation rate estimation by mass balance method that is particularly used for naturally ventilated buildings (Pedersen et al., Reference Pedersen, Blanes-Vidal, Joergensen, Chwalibog, Haeussermann, Heetkamp and Aarnink2008).
Moisture balance can also be used for ventilation rate estimation (Blanes and Pedersen, Reference Blanes and Pedersen2005). Besides, humidity has significant influence on airborne pollutants in piggeries, like respirable particles and endotoxins (Banhazi et al., Reference Banhazi, Seedorf, Rutley and Pitchford2008). Bedded systems are known to release more moisture than conventional systems (International Commission of Agricultural and Biosystems Engineering, CIGR, 2002; Philippe et al., Reference Philippe, Laitat, Canart, Vandenheede and Nicks2007a) with likely excessive indoor relative humidity and poor air quality as consequence, especially during wintertime. Thus, determination of water vapour (H2O) emissions is a key factor in specifying ventilation rates in livestock buildings.
Usually, national inventories of pollutant gases are based on default values obtained by estimation for different animal categories (IPCC, 2006; Reidy et al., Reference Reidy, Webb, Misselbrook, Menzi, Luesink, Hutchings, Eurich-Menden, Doher and Dammgen2009). A part of uncertainty comes from a lack of data for all the animal and housing conditions (Reidy et al., Reference Reidy, Webb, Misselbrook, Menzi, Luesink, Hutchings, Eurich-Menden, Doher and Dammgen2009). Nowadays, there are few data about gaseous emissions from pigs on deep litter and still less with gestating sows in an increased available space. In France, from 10% to 15% of gestating sows are kept on bedded systems (Massabie and Ramonet, Reference Massabie and Ramonet2007). Therefore, the aim of this study was to quantify gaseous emissions (NH3, N2O, CH4, CO2 and H2O) in the raising of gestating sows group-housed on a straw-based deep litter according to the space allowance (2.5 v. 3.0 m2sow).
Materials and methods
The trials were carried out in experimental rooms located at the Faculty of Veterinary Medicine of Liège University (Belgium). The ethical committee of the University of Liège approved the use and treatment of animals in this study.
Experimental rooms
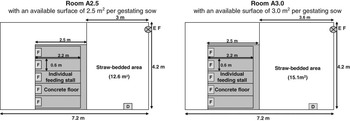
Two experimental rooms, similar in volume (103 m3) and surface (30.2 m2), were arranged and equipped for this experiment. Rooms consisted of a service area and a pen to house a group of five gestating sows. Pens were divided in a straw-bedded area and five individual feeding stalls (Figure 1). The feeding stalls were raised the height of 30 cm and were equipped with front troughs and rear gates preventing the access to the stalls outside of the feeding time. The surface of bedded area was 12.6 m2 (2.5 m2/sow) in room 1 and 15.1 m2 (3.0 m2/sow) in room 2. In each pen, before the arrival of the animals, about 150 kg of whole-wheat straw were used to constitute the initial deep litter of about 25 to 30 cm depth. Thereafter, weighted supplementary amounts of straw were provided regularly depending on the cleanliness of the litter and the sows. Within each batch, the successive straw supplies were similar in weight in the two pens and occurred at the same time with an interval of about 2 weeks. In between each batch, the pens were cleaned. The manures were weighted and sampled, and their dry matter (DM), organic matter and nitrogen contents, analysed by the Kjeldahl method, were determined.
Plan of the experimental rooms.

Each room was ventilated with an exhaust fan (Fancom, Panningen, The Netherlands) and the ventilation rate was adapted automatically to maintain a constant ambient temperature by means of regulator FCTA (Fancom, Panningen, The Netherlands). Fresh air entered through an opening of 0.34 m2, which was connected to the service corridor of the building; the outside air was thereby preheated before entering the experimental rooms. The air temperatures of the experimental rooms, the corridor and the outside were measured automatically every hour. The ventilation rates were measured continuously and the hourly means were recorded with an Exavent apparatus (Fancom, Panningen, The Netherlands) with accuracy of 35 m3/h, that is, 1% of the maximum ventilation rate of the fan.
Animals and feed
Four successive batches of 10 Belgian Landrace gestating sows were used. They were divided into two homogeneous groups of five animals according to the parity, the body weight (BW) and the backfat thickness. Each group was randomly allocated to a treatment: 2.5 m2 (A2.5) or 3.0 m2 (A3.0) available area per sow. Four weeks after service, the sows arrived in the experimental rooms and 15 days before giving birth, they moved to farrowing pens; the stay duration was thus 10 weeks for each batch.
The sows received a commercial conventional gestation diet based on cereals (66% of wheat, wheat bran, barley and corn; 2120 kcal net energy/kg, 13.2% CP, 18% NDF). The amounts of daily feed were restricted and determined per batch as function of parity and backfat thickness. The feed was supplied once a day at 0830 h and the sows were blocked in individual feeding stalls during the feeding time (1 h). There was a drinker with ad libitum access in each pen.
Individually, the sows were weighted and the backfat thickness was measured on P2-site by ultrasonography at the beginning and at the end of the trial period. The feed and water intakes were recorded per group and per batch. Moreover, at birth, the number of piglets born alive and stillborn was also recorded.
Gas emissions measurement
The concentrations of gases in the experimental rooms and in the corridor supplying fresh air were measured by infrared photoacoustic detection with a photoacoustic multi-gas monitor – INNOVA 1312 (LumaSense Technologies A/S, Ballerup, Denmark) equipped and calibrated for simultaneous measurement of NH3, N2O, CH4, CO2 and H2O. The lower levels of detection were 0.2 ppm for NH3, 0.03 ppm for N2O, 0.1 ppm for CH4 and 3.4 ppm for CO2, with an accuracy rate of 95%. The air in the experimental rooms was sampled just upstream of the exhaust fan and that one of the corridor, at 1 m from the air inlet. For each batch, the concentrations were measured during three periods of six consecutive days (weeks 6, 9 and 12 of gestation). The Multi-gas monitor was programmed by conducting a cycle of three measurements every hour, once every 20 min, the air being sampled successively in the two experimental rooms and the corridor.
For each gas, the emissions (Egas) were calculated on an hourly basis and expressed in milligram per hour using the following formula:

with D, the hourly mass flow (kg air/h); Cin and Cout, the concentrations of gas in the air of the experimental room and corridor, respectively (mg/kg air). The mean emissions per day and per sow were calculated for each series of measurements.
For assessment of GHG, they were expressed in CO2 equivalents (CO2eq) taking into account their GWP. As early mentioned, CO2 emissions from livestock were excluded from this estimation. However, indirect emissions of N2O were incorporated in this estimation according to IPCC guidelines (IPCC, 2006). Indirect N2O emissions originate from atmospheric deposition of NH3 on soils and water surfaces and were estimated considering conversion of 1% of NH3-N into N2O-N. Thus, the emissions of CO2eq (ECO2eq; kg/day per sow) were calculated using the following equation:

Nitrogen balance
Nitrogen (N) balance (g N/day per sow) was calculated for each group with inputs corresponding to N-straw and N-feed intakes and outputs corresponding to N-retention by sows, N-content of manure and N from gaseous emissions of NH3, N2O and dinitrogen (N2). Straw protein content was estimated to 38.6 g/kg (Sauvant et al., Reference Sauvant, Perez and Tran2004). N-retention was calculated as a part of N-feed. According to Philippe et al. (Reference Philippe, Remience, Dourmad, Cabaraux, Vandenheede and Nicks2008), N-retention coefficient is similar despite different fibrous content and estimated at 15%. Nitrogen from N2 was calculated by the following equation:

Statistical analyses
For performance data recorded per sow, the differences between groups housed on two different areas (A2.5 v. A3.0) were tested using analysis of variance with two criteria (proc GLM) (Statistical Analysis System, SAS, 2005): area (1 df), batches (3 df) and interaction between area and batches. For intakes data, manure characteristics and N balance, recorded per pen, the differences were tested in the same way but with only area (1 df) as criterion (proc GLM) (SAS, 2005).
For room temperatures, ventilation rates, gas concentrations and gas emissions, the data from each batch were tested in the form of a mixed model for repeated measurements with two criteria (proc MIXED) (SAS, 2005): area (1 df) and week of measurement (2 df), with 144 (24 h × 6 days) successive measurements per week. The combined data from the four batches were tested in the same way but including interaction between area and week of measurement (2 df). Residuals were normally distributed, with a null expectation (proc UNIVARIATE) (SAS, 2005). Correlation between successive measurements was modelled using a type 1 autoregressive structure.
Results
Climatic characteristics of the rooms
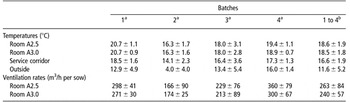
The data about the air temperatures and the ventilation rates are shown in Table 1. The average temperatures of the air were similar in both experimental rooms with about 18.5°C (P > 0.05), 16.6°C in the service corridor and 11.6°C outside. The lower temperatures in experimental rooms during the second batch were due to cooler temperature of the outside and incoming air. Nevertheless, despite large variations of the outside temperatures between batches, the temperatures in the experimental rooms stayed stable with a standard deviation between batches around 2°C. This was due to the automatic adaptation of the ventilation rates to the inside temperatures. The mean ventilation rate was about 250 m3/h per sow, without significant difference between groups (P > 0.05). This quite high flow was explained by the preheating of the air in the service corridor. On hourly basis and per sow, the extreme values of ventilation rates were 157 m3 and 513 m3 for the room A2.5, and 129 m3 and 479 m3 for the room A3.0.The slightly higher ventilation rates in the room A2.5 were explained by the thermal leakage of the walls being lower in room A2.5, linked to the positioning of these rooms in the building.
Air temperatures and ventilation rates of experimental rooms, service corridor and outside

Room A2.5: room with an available area of 2.5 m2 per gestating sow; Room A3.0: room with an available area of 3.0 m2 per gestating sow.
aMean ± s.d. between mean values of the three periods of measurements.
bMean ± s.d. between the four batches.
Animal performance
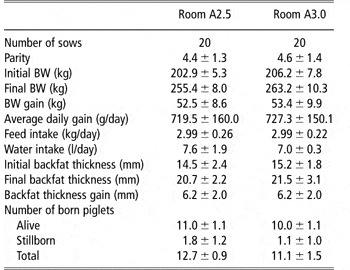
The average staying duration of batches was 70 ± 5 days. The performance is presented in Table 2. There were no significant differences between groups according to the available surface for animal performance. The mean initial and final BWs were 205 and 259 kg, respectively, with an average daily gain of 723 g/day and an average feed intake of 2.99 kg/day. The mean initial and final backfat thicknesses were 14.9 and 21.1 mm, respectively, with a backfat thickness gain of 6.2 mm. On average, each sow gave birth to 11.9 piglets of which 10.5 were alive.
Animal performance as influenced by the available area (2.5 m2 (Room A2.5) or 3.0 m2 (Room A3.0) per sow) in group-housed gestating sows kept on deep litter (mean ± s.d. between the four batches)

Amounts and composition of manure
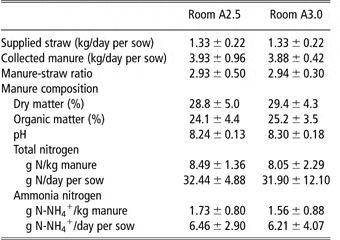
Characteristics of manure did not significantly differ between groups (P > 0.05) (Table 3). The amounts of supplied straw and collected manure were per sow about 1.3 and 3.9 kg/day. The DM and organic matter contents and the pH of the manure were 29%, 25% and 8.27, respectively. Nitrogen and ammonium contents were 8.27 g N and 1.65 g N-NH4+ per kg fresh manure, respectively.
Manure characteristics as influenced by the available area (2.5 m2 (Room A2.5) or 3.0 m2 (Room A3.0) per sow) in group-housed gestating sows kept on deep litter (mean ± s.d. between the four batches)

Gas concentrations and emissions
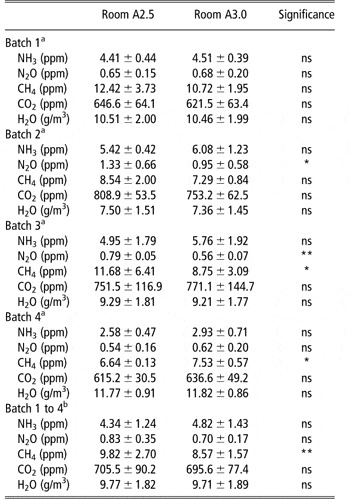
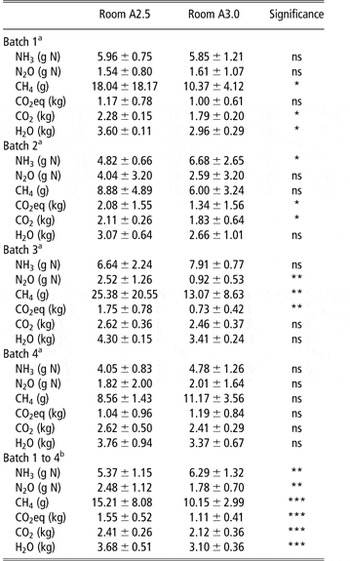
In the service corridor providing fresh air, the mean gas concentrations were 2.68 ± 0.71 ppm for NH3, 0.43 ± 0.05 ppm for N2O, 5.77 ± 1.67 ppm for CH4, 476.4 ± 33.9 ppm for CO2 and 9.13 ± 1.98 g/m3 for H2O (mean ± s.d. between the four batches). Table 4 presents the mean gas concentrations in the two experimental rooms. Increased space allowance from 2.5 to 3.0 m2 raised the concentrations of NH3, but decreased the concentrations of N2O, CH4, CO2 and H2O. The difference were not statistically significant, except for CH4 (P < 0.01). Table 5 presents the mean gas emissions. With the lower animal density, there was an increase of NH3 emissions by 17% (P < 0.01), but a decrease of N2O emissions by 28% (P < 0.01), CH4 emissions by 33% (P < 0.001), CO2eq emissions by 28% (P < 0.001), CO2 emissions by 12% (P < 0.001) and H2O emissions by 16% (P < 0.001).
Gas concentrations for group-housed gestating sows kept on deep litter with an available surface per sow of 2.5 m2 (Room A2.5) or 3.0 m2 (Room A3.0)

aFor each gas and each available surface, means ± s.d. between the three periods of measurement.
bFor each gas and each available surface, means ± s.d. between the four batches.
***P < 0.001; **P < 0.01; *P < 0.05; ns: not significant.
Gas emissions (per sow and per day) from group-housed gestating sows kept on deep litter with an available surface per sow of 2.5 m2 (Room A2.5) or 3.0 m2 (Room A3.0)

aFor each gas and each available surface, means ± s.d. between the three periods of measurement.
bFor each gas and each available surface, means ± s.d. between the four batches.
***P < 0.001; **P < 0.01; *P < 0.05; ns: not significant.
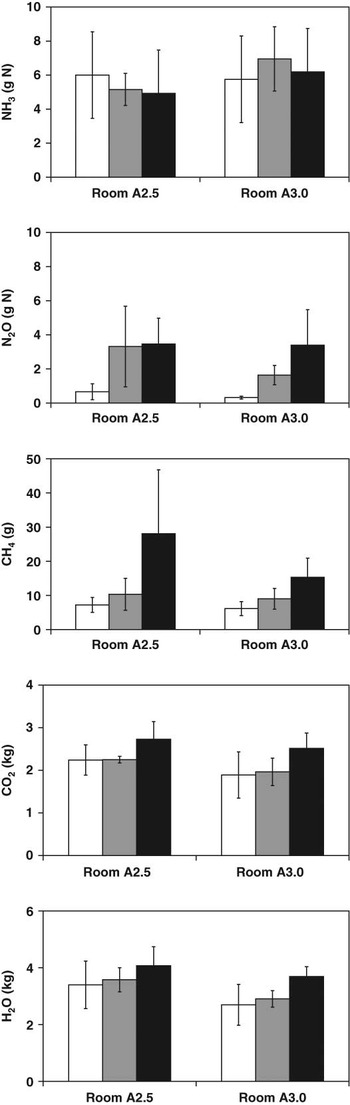
Figure 2 shows the evolution of the gas emissions from the first period of measurement (6th week of gestation) to the last period of measurement (12th week of gestation). Evolution of NH3 emissions showed no particular trends throughout time. N2O-emissions were relatively low at the beginning of the experiment with about 0.50 g N2O-N/day per sow for both groups. With the space area of 2.5 m2, emission level reached about 3.40 g N2O-N/day per sow from the second measurements period and remained quite stable thereafter. With the space area of 3.0 m2, emission levels raised regularly throughout time with an intermediate value of 1.64 g N2O-N/day per sow for the 9th week and an upper value of 3.40 g N2O-N/day per sow for the 12th week of gestation. CH4-emissions increased steadily with the course of time in the two groups. While there was no significant difference between groups for the two first periods of measurement (P > 0.05), the difference became highly significant for the 12th week of gestation with twofold CH4-emissions for the high animal density (28.1 v. 15.3 g CH4/day per sow, P < 0.001). The evolution of CO2- and H2O-emissions was similar for the two groups: the emission levels were stable during the two first periods of measurement and increased at the end of the experiment. However, for these two gases, differences between groups were always significant within each period of measurement (P < 0.05).
Daily gas emissions per sow (mean ± s.d. between the four batch) from deep litter pens with an available surface of 2.5 m2 (Room A2.5) or 3.0 m2 (Room A3.0) per gestating sow according to the gestation week (week 6: white; week 9: grey and week 12: black).

Nitrogen balance
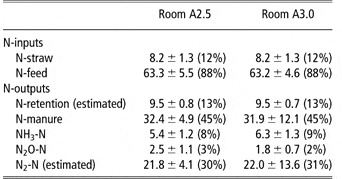
Nitrogen balance (Table 6) was not significantly different between groups (P > 0.05). Feed provided nearby 90% of N-inputs. The main part of outputs was represented by N-manure with about 32 g N/day per sow (45% of outputs). N2-emissions amounted about 22 g N/day per sow for both animal densities, corresponding to almost one third of the total N-outputs.
Nitrogen balance (g N/d per sow) for group-housed gestating sows kept on deep litter with an available surface per sow of 2.5 m2 (Room A2.5) or 3.0 m2 (Room A3.0) (mean ± s.d. between the four batches)

Discussion
NH3 emissions obtained in this experiment meet lower values presented in the literature ranging from 6 to 25 g NH3-N/day per sow for grouped sow kept on litter (Groot Koerkamp et al., Reference Groot Koerkamp, Metz, Uenk, Phillips, Holden, Sneath, Short, White, Hartung, Seedorf, Schroder, Linkert, Pedersen, Takai, Johnsen and Wathes1998; Misselbrook et al., Reference Misselbrook, Van der Weerden, Pain, Jarvis, Chambers, Smith, Phillips and Demmers2000; Dore et al., Reference Dore, Jones, Scholtens, Huis In’t Veld, Burgess and Phillips2004). On slatted floor, cited values range from 5 g to 15 g NH3-N/day per sow (Groot Koerkamp et al., Reference Groot Koerkamp, Metz, Uenk, Phillips, Holden, Sneath, Short, White, Hartung, Seedorf, Schroder, Linkert, Pedersen, Takai, Johnsen and Wathes1998; Groenestein et al., Reference Groenestein, Hendriks and den Hartog2003). Whatever the floor type, numerous factors can influence NH3-emissions, like feeding management, interior climate, season and waste treatment (Harper et al., Reference Harper, Sharpe and Simmons2004; Philippe et al., Reference Philippe, Laitat, Canart, Farnir, Massart, Vandenheede and Nicks2006 and Reference Philippe, Canart, Laitat, Wavreille, Vandenheede, Bartiaux-Thill, Nicks and Cabaraux2009). Furthermore, for litter systems, properties of bedding materials carbon/nitrogen ratio (C/N ratio; carbon availability, pH value and physical structure, among others) affect volatilization (Jeppsson, Reference Jeppsson2002). Few studies evaluated effect of animal density on NH3-emissions from sows on litter. With fattening pigs, Basset-Mens et al. (Reference Basset-Mens, van der Werf, Robin, Morvan, Hassouna, Paillat and Vertes2007) observed twofold emissions while bedded space area is reduced by one-half. The authors explain the results by higher air temperature and ventilation rates associated to higher animal density. In the current study, these two climatic parameters are identical in both groups. With fattening pigs on slatted floor, Guingand (Reference Guingand2007) observed a raise of emissions of 35% while space allowance increase by 43%. These results are accurately in accordance with the current experiment where increased space allowance of 20% is related with a raise of emissions of 17%. The explanation comes from the increase of exchange surface at the emitting area. Thus, increasing space allowance without modification of interior climatic conditions seems to have the same effect on NH3-emissions whether pigs are kept on bedded or slatted floor.
About N2O-emissions from gestating sows, few data are available in the literature. For fattening pigs, emission values reach 6.4 g N2O-N/day with deep litter and are about 1.0 g N2O-N/day with slatted floor (Basset-Mens et al., Reference Basset-Mens, van der Werf, Robin, Morvan, Hassouna, Paillat and Vertes2007; Philippe et al., Reference Philippe, Laitat, Canart, Vandenheede and Nicks2007a). The formation of N2O occurs during incomplete nitrification/denitrification processes that normally convert NH3 into N2. Nitrification requires aerobic conditions whereas denitrification requires anaerobic conditions. During denitrification, N2O is synthesized in case of presence of oxygen or low availability of degradable carbohydrates or both (Poth and Focht, Reference Poth and Focht1985). During nitrification, N2O can be synthesized where there is a lack of oxygen or a nitrite accumulation or both (Veeken et al., Reference Veeken, de Wilde and Hamelers2002). N2O-synthesis needs thus close combination of aerobic and anaerobic areas, heterogeneous conditions met within the litter (Veeken et al., Reference Veeken, de Wilde and Hamelers2002). These particular conditions explain higher emissions usually observed with bedded systems in comparison with slurry systems where the environment is largely anaerobic (Philippe et al., Reference Philippe, Laitat, Canart, Vandenheede and Nicks2007a; Cabaraux et al., Reference Cabaraux, Philippe, Laitat, Canart, Vandenheede and Nicks2009). However, in bedded systems, N2O-formation may be reduced in case of too aerobic litter due to generous straw supply (Kermarrec and Robin, Reference Kermarrec and Robin2002). In the current study, by increasing space allowance, strictly aerated part of manure is also increased and, consequently, N2O-formation could be impaired, as previously observed by Basset-Mens et al. (Reference Basset-Mens, van der Werf, Robin, Morvan, Hassouna, Paillat and Vertes2007). The increasing emissions with the course of time in both groups are also explained by the particular environment inside the litter. Throughout time, dejections are accumulated in the litter with creation of more anaerobic areas close to aerobic areas. Thus, the balance between aerobic and anaerobic areas within the litter is an important criterion influencing N2O-emissions from bedded systems.
In this experiment, increasing available floor space from 2.5 m2 to 3.0 m2 reduced CH4-emissions from 15 to 10 g/day per sow. In literature, large variations were observed between authors with values ranging from 5 to 60 g CH4/day per sow (Groot Koerkamp and Uenk, Reference Groot Koerkamp and Uenk1997; Godbout et al., Reference Godbout, Lague, Lemay, Marquis and Fonstad2003; Dong et al., Reference Dong, Zhu, Shang, Kang, Zhu and Xin2007). Methane originates from anaerobic degradation of organic matter in the digestive tract of animal and in the manure. Methanogenesis is mainly performed by mesophilic bacteria (25°C to 40°C) with an optimal pH of 7.0 to 7.2 (Hellmann et al., Reference Hellmann, Zelles, Palojarvi and Bai1997). Enteric fermentations are enhanced by fibres intake (Philippe et al., Reference Philippe, Remience, Dourmad, Cabaraux, Vandenheede and Nicks2008 and Reference Philippe, Canart, Laitat, Wavreille, Vandenheede, Bartiaux-Thill, Nicks and Cabaraux2009). In manure, CH4-release are promoted by high temperature and high DM content (Haeussermann et al., Reference Haeussermann, Hartung, Gallmann and Jungbluth2006). Straw supply may enhance CH4-emissions by increasing the DM-content and degradable carbohydrates content of the manure. Straw also constitutes a potential source of dietary fibres for the animals. On the other hand, straw may inhibit production because the too great aeration (Yamulki, Reference Yamulki2006). As observed for N2O, more anaerobic conditions could explain the increase of CH4 emissions with the high animal density and with the course of time in both groups.
The emissions of CO2eq calculated in this trial were reduced by about one third with the increase of the available space floor. This was due to the significant and simultaneous decrease of direct N2O and CH4 emissions in the room A3.0. Direct N2O and CH4 represented 78% and 20% of total CO2eq emissions, respectively. Hence, even if the NH3 emissions were greater in the room A3.0, its impact was negligible with about 2%.
The CO2 production from piggeries originates mainly from the animal respiration, but also from the manure releases. CO2-exhalation by pigs is function of energy metabolism and can be derived from the heat production and the respiratory quotient (RQ, the ratio between the CO2 production and O2 consumption during respiration (Pedersen et al., Reference Pedersen, Blanes-Vidal, Joergensen, Chwalibog, Haeussermann, Heetkamp and Aarnink2008). For gestating sows, CO2 production at animal level is estimated at 0.165 m3/h per 1000 W of total heat production, related to a RQ value of about 0.95 (Olesen et al., Reference Olesen, Jorgensen and Danielsen2001; Rijnen et al., Reference Rijnen, Verstegen, Heetkamp, Haaksma and Schrama2001; Theil et al., Reference Theil, Jorgensen and Jakobsen2002). According to the CIGR equations (CIGR, 2002), it corresponds to an exhalation of about 2.6 kg CO2/day for the sows of the current essay. This estimated value is higher than the CO2 emissions measured in this experiment. However, the CIGR equations are elaborated for daily gains around 0.18 kg/day over the entire gestation period and they are probably not adapted to the higher daily gain obtained in this experiment over a shorter period (0.72 kg/day from day 30 to day 100 of gestation). Moreover, important influencing factors like the feed intakes, diet composition and the animal activity may have also affected the CO2-production by sows (Pedersen et al., Reference Pedersen, Blanes-Vidal, Joergensen, Chwalibog, Haeussermann, Heetkamp and Aarnink2008). Nevertheless, the difference in CO2-emissions between the two experimental groups seems to be explained rather by releases from manure than by respiration. CO2-production in manure has two origins: the hydrolysis of urea leading to NH3 and CO2-production, and the anaerobic degradation of organic components which is the most important origin (Ni et al., Reference Ni, Vinckier, Hendriks and Coenegrachts1999). It is generally admitted that emissions are higher from litter than from slurry. With fattening pigs, they range from 0.15 to 0.54 kg CO2/day with slatted floor (Ni et al., Reference Ni, Vinckier, Hendriks and Coenegrachts1999; Philippe et al., Reference Philippe, Laitat, Canart, Vandenheede and Nicks2007a) and from 0.35 to 1.40 kg CO2/day with bedded floor (Jeppsson, Reference Jeppsson2000 and Reference Jeppsson2002; Philippe et al., Reference Philippe, Laitat, Canart, Vandenheede and Nicks2007a). In litter, the production is influenced by temperature, moisture content, C/N ratio, pH level, oxygen level and the physical structure of the organic material (Jeppsson, Reference Jeppsson2000). CO2 synthesis is promoted by high temperature, but reduced by aerobic environment. Litter aeration related to space allowance could explain reduction of emissions measured in the room A3.0. In the same way, accumulation of dejection in the course of time explain higher emissions observed at the end of the experiment because of more anaerobic conditions within the litter. Besides, the present results showed that, although diet characteristics, feed intakes, animal performances and climate conditions are similar for both groups, CO2-emissions may differ because of housing conditions. Former experiments carried out with weaning and fattening pigs reached to the same conclusion (Philippe et al., Reference Philippe, Laitat, Canart, Vandenheede and Nicks2007a and Reference Philippe, Laitat, Canart, Vandenheede and Nicks2007b; Cabaraux et al., Reference Cabaraux, Philippe, Laitat, Canart, Vandenheede and Nicks2009). Therefore, ignore CO2 for the CO2eq calculation and thus for the GWP evaluation of livestock farming systems may be debatable.
Like CH4 and CO2, H2O emissions have two origins: animals and manure. Evaporation by animals is function of BW, heat production and ambient temperature (CIGR, 2002) and evaporation from manure is function of litter temperature related to the level of the fermentations. In the current experiment, the room A2.5 emitted about 0.6 kg H2O more than the room A3.0. As the A2.5 sows drank about 0.6 l water more than the A3.0 sows and as the manure characteristics did not differ between groups, it was thus normal to find greater H2O emissions from room A2.5. However, in room A2.5, the observation of greater amount of water in emissions could probably be also explained by greater litter temperatures (not measured in this trial) due to the reduced area, to the higher litter depth and to the greater amount per square metre of heat supplied by sows during the sleep.
Conclusion
An increase of the available area for group-housed gestating sow kept on straw-based deep litter did not modify manure characteristics and performance at short term. However, despite a good brand image for the consumer and a welfare improvement for the sows, environmental impacts of this system seem to be ambiguous.
Compared with a conventional and legal available area, greater available area favoured NH3 emissions probably due to increased emitting surface. However, about greenhouse gases, it decreased N2O, CH4 and CO2 emissions probably due to reduced anaerobic conditions required for their synthesis and led to a reduction of CO2eq emissions.
Acknowledgements
The research was financially supported by the General Directorate of Agriculture, Natural Resources and Environment of the Wallonia Public Service (Belgium).