Children's ability to regulate their behavior and emotions improves rapidly in the preschool years. Growth in executive function is thought to underlie these improvements in self-regulation. However, children growing up in low-income households tend to demonstrate lower executive function and related abilities (Hughes, Ensor, Wilson, & Graham, Reference Hughes, Ensor, Wilson and Graham2010; Lengua, Moran, et al., Reference Lengua, Moran, Zalewski, Ruberry, Kiff and Thompson2014; Li-Grining, Reference Li-Grining2007; Mezzacappa, Reference Mezzacappa2004; Raver, Blair, & Willoughby, Reference Raver, Blair and Willoughby2013), which has been proposed as a mechanism for their increased risk for later adjustment problems (Blair, Reference Blair2010; Hackman, Gallop, Evans, & Farah, Reference Hackman, Gallop, Evans and Farah2015; Raver et al., Reference Raver, Jones, Li-Grining, Zhai, Bub and Pressler2011, Reference Raver, Blair and Willoughby2013). Studies have not yet clearly elucidated the effects of poverty or low income on the neural processes that support executive function, particularly in younger children. The current study aimed to specify the mechanisms underlying the link between low-income contexts and diminished capacity in a core aspect of executive functioning, executive control, in the preschool period. We examined whether individual differences in the neural processes associated with executive attention and inhibitory control accounted for income differences observed in performance on a neuropsychological battery of tasks assessing executive control.
In this study, executive control was conceptualized and operationalized as an aspect of executive functioning. Executive function is defined as the ability to effortfully direct cognitive and behavioral processes in service of a goal and includes components such as attention focusing and shifting, cognitive inhibition, and behavioral inhibitory control as well as working memory, problem solving, and planning (Diamond, Reference Diamond2013; Hughes, Reference Hughes1998; Hughes et al., Reference Hughes, Ensor, Wilson and Graham2010; Zelazo, Müller, Frye, & Marcovitch, Reference Zelazo, Müller, Frye and Marcovitch2003). In this study, executive control comprised the processes of executive attention, which allows for the purposeful shifting of attention to relevant information and/or away from distracting information, and inhibitory control, which is the ability to inhibit automatic or prepotent cognitive and behavioral responses (Eisenberg et al., Reference Eisenberg, Spinrad, Fabes, Reiser, Cumberland and Shepard2004; Rothbart & Bates, Reference Rothbart, Bates, Damon and Lerner2007). Hence, executive control can be considered a core component of executive function.
Previous research suggests that the anterior cingulate cortex is involved in processes of executive attention and the detection of conflict (Botvinick, Braver, Barch, Carter, & Cohen, Reference Botvinick, Braver, Barch, Carter and Cohen2001; Rothbart, Sheese, & Posner, Reference Rothbart, Sheese and Posner2007) and the prefrontal cortex (PFC) is associated with inhibitory control (Wiersema & Roeyers, Reference Wiersema and Roeyers2008). The experience of growing up in poverty and the stress associated with such environments has been linked to differences in the PFC and associated circuitry, which mediate executive control processes (Farah et al., Reference Farah, Shera, Savage, Betancourt, Giannetta and Brodsky2006; Hackman & Farah, Reference Hackman and Farah2009; Lipina & Posner, Reference Lipina and Posner2012; Noble, Norman, & Farah, Reference Noble, Norman and Farah2005). These neural systems are theorized to be particularly sensitive to environmental influences due to their protracted developmental course (Hackman & Farah, Reference Hackman and Farah2009; Noble et al., Reference Noble, Norman and Farah2005).
Several mechanisms by which low income and its associated stressors might disrupt PFC development leading to executive control deficits have been proposed. Acute and chronic stressors, which are more prevalent for low-income families, have been shown to affect the developing brain and PFC in particular (Blair, Reference Blair2010; Evans & Schamberg, Reference Evans and Schamberg2009; Raver et al., Reference Raver, Blair and Willoughby2013). Another direct mechanism is environmental impoverishment, which may include less stimulation, less exposure to language, poorer nutrition, and decreased access to educational inputs (Evans, Reference Evans2004; Noble et al., Reference Noble, Norman and Farah2005). Stress in the family context also affects children's developing executive control via its effects on parenting (Conger et al., Reference Conger, Wallace, Sun, Simons, McLoyd and Brody2002; Hackman, Farah, & Meaney, Reference Hackman, Farah and Meaney2010; Lengua, Kiff, et al., Reference Lengua, Kiff, Moran, Zalewski, Thompson and Cortes2014). However, the emerging literature has not fully addressed whether differential recruitment or activation of the neural circuitry underlying executive control accounts for the income differences often observed in performance on executive control measures. This study tested whether such neural differences underlie observed income differences in performance on neuropsychological measures of executive control.
To examine the neural correlates of children's executive control, EEG data were collected while children completed two computerized tasks testing executive attention and inhibitory control abilities. From these data, stimulus-locked event-related potentials (ERPs) were calculated. ERP data have excellent temporal resolution and provide information about the temporal sequence of cognitive processes such as executive attention and inhibitory control (Luck, Woodman, & Vogel, Reference Luck, Woodman and Vogel2000).
Several specific ERP components are thought to represent executive attention and inhibitory control processes. One is the N2, a negative deflection typically detected in the frontocentral regions around 200–400 ms after stimulus presentation. The N2 is thought to reflect the recognition of conflict or the inhibition of a prepotent response in children and adults (Botvinick et al., Reference Botvinick, Braver, Barch, Carter and Cohen2001; Buss, Dennis, Brooker, & Sippel, Reference Buss, Dennis, Brooker and Sippel2011; Folstein & Van Petten, Reference Folstein and Van Petten2008; Zordan, Sarlo, & Stablum, Reference Zordan, Sarlo and Stablum2008). In adults, the N2 has been source localized to the medial frontal cingulate cortex; however, developmental studies tend to find more posterior activity (Jonkman, Reference Jonkman2006). Another component reflecting these aspects of executive functioning is the P3, a positive deflection appearing around 300 ms following stimulus presentation. The P3 in adults and children tends to be maximal in parietal regions and is believed to be related to attentional monitoring of stimuli and stimulus evaluation (Coles, Gratton, Bashore, Eriksen, & Donchin, Reference Coles, Gratton, Bashore, Eriksen and Donchin1985; Davis, Bruce, Snyder, & Nelson, Reference Davis, Bruce, Snyder and Nelson2003; Rueda, Posner, Rothbart, & Davis-Stober, Reference Rueda, Posner, Rothbart and Davis-Stober2004). Because our computerized tasks were selected to elicit executive attention and inhibitory control processes, we examined these two components. However, based on previous findings showing a stronger relation between executive control and amplitude of the P3 (Wiersema & Roeyers, Reference Wiersema and Roeyers2008) and emerging evidence that condition-related differences in the N2 component may not be observed in children younger than 6 years old (Buss et al., Reference Buss, Dennis, Brooker and Sippel2011), it was unclear whether a pronounced N2 would be observed in this sample.
Evidence of associations between income and these ERP correlates of executive attention and inhibitory control is somewhat limited, and differences in developmental stage and task specifics (e.g., auditory vs. visual modality) across these studies make it difficult to glean patterns. For example, one study examined socioeconomic status (SES) differences in 7- to 12-year-old children performing a target detection task with infrequent novel stimuli (Kishiyama, Boyce, Jimenez, Perry, & Knight, Reference Kishiyama, Boyce, Jimenez, Perry and Knight2008). There were no income group differences on task performance in this study, which may be attributable to the intentional simplicity of the task. However, income group differences were observed in the N1 and P1 to the standard (nontarget) stimuli, suggesting early attentional differences. There were also differences in the N2 to the novel stimuli, with children from the lower SES group showing an attenuated response compared to those in the higher SES group. Differences were not observed on other ERP components including the P3b. Stevens, Lauinger, and Neville (Reference Stevens, Lauinger and Neville2009) measured the ERP correlates of auditory selective attention in 3- to 8-year-old children of mothers with different levels of education. They found that children whose mothers had lower levels of educational attainment displayed higher amplitude ERP responses to the unattended auditory stimuli despite similar performance on the task. This suggested a deficit in their ability to suppress attention to irrelevant information and may be related to experiences of greater environmental chaos. D'Angiulli, Herdman, Stapells, and Hertzman (Reference D'Angiulli, Herdman, Stapells and Hertzman2008) also found significant income group differences on ERP data collected during an auditory selective attention task in 11- to 15-year-old children in the absence of performance differences. Unlike their higher income peers, lower income children displayed similar patterns of ERP data to irrelevant and relevant stimuli, suggestive of an inefficient neural response of attending equally to these stimuli. In follow-up spectral power analyses, lower income children showed greater theta activity for the irrelevant stimuli compared to the higher income children, supporting the hypothesis that they recruited different neural processes to perform the task equally well. The lack of behavioral differences in each of these studies highlights the importance of directly capturing the differences in neural processes for children growing up in low-income contexts.
The present study aimed to contribute to this limited body of research by examining the associations between the underlying neural correlates of executive attention and inhibitory control measured using ERP and neuropsychological measures of executive control and testing whether these neural correlates account for the relation of income to executive control. We examined these relations in preschool-aged children because of the dramatic increase in executive control observed during this period. As has been described elsewhere (Lengua, Kiff, et al., Reference Lengua, Kiff, Moran, Zalewski, Thompson and Cortes2014; Lengua, Moran, et al., Reference Lengua, Moran, Zalewski, Ruberry, Kiff and Thompson2014), lower income was associated with lower levels of executive control as assessed by a neuropsychological battery of tasks in this sample. Thus, we also tested whether these neural correlates account for the relation between income and executive control. We predicted that ERP correlates of executive attention and inhibitory control measured during separate computerized executive control tasks would relate to observed income differences in children's performance on the broader executive control battery.
Method
Participants
Participants were a subsample of a larger ongoing longitudinal study, which was designed to examine the associations of income, contextual risk, parenting, and child temperament on the development of effortful control during the preschool years. Each family enrolled in the study consisted of a participating child–mother dyad, with equal numbers of male and female children enrolled at Time 1. In this larger study, participants were assessed at four time points beginning when the child was 36–40 months old, with follow-up assessments at 9-month intervals. To ensure equal distribution across income levels and permit examination of effects of impoverished rearing environments, of the 306 families who participated at Time 1, 29% were at or near poverty (at or below 1.5 times the federal poverty threshold for annual income), 27% were classified as lower income (below the local median income of $58,000 annual income), 25% were middle income (greater than the local median and less than the upper income threshold), and 18% fell into the upper income (above $100,000 annual income). The sample was recruited from a region in the Pacific Northwest via the university hospital birth records, schools, community centers, churches, and daycares.
From the larger study, a stratified random sample of 118 families were invited to participate in an additional EEG assessment immediately following the assessment either at Time 3 when children were 54–58 months old (n = 62) or at Time 4 when children were 63–67 months old (n = 56). The subsample was composed of families randomly selected from one of three income categories: at or near poverty, lower income, or middle to upper income (collapsing the two highest income levels). This assessment included two computerized tasks of executive control, conducted while EEG was collected (see below for task descriptions). From the 118 who consented to take part in the EEG assessment, several children were excluded for each task due to insufficient number of artifact-free ERP trials (flanker n = 44; frogs/fish n = 38), child fatigue or noncompliance (flanker n = 10; frogs/fish n = 3), insufficient performance on the task (i.e., fewer than six correct trials per condition; flanker n = 3; frogs/fish n = 4), or technical issues during EEG collection (frogs/fish n = 1). Thus, 61 children were included in analyses using the flanker task, and 72 children were included in analyses with the frogs/fish task. For analyses directly comparing the two tasks, a total of 53 children with usable data for both tasks were included.
For the ERP data, children were required to have at least 8 artifact-free trials for each task condition to be included in analyses. Although this number is lower than typically used in ERP analyses, this minimum was selected to ensure that participants from lower income groups were not being disproportionately excluded, which occurred for the flanker task data when employing a 10-trial minimum, χ2 (2, n = 53) = 6.54, p = .038. When using an 8-trial minimum, the distribution was statistically equal across the three categorical income groups for both the flanker task, χ2 (2, n = 61) = 4.05, p = .132, and the frogs/fish task, χ2 (2, n = 72) = 3.99, p = .136. The mean number of trials averaged for each flanker and frogs/fish ERP was significantly higher than this minimum: it ranged from 18 to 27 trials across trial types and did not differ significantly by income group. Tests of the homogeneity of variance across income groups for all key ERP components (flanker congruent and incongruent N2 and P3, frogs/fish go and no-go N2 and P3) suggested that there were not significant differences in variance related to income grouping. Only flanker P3 congruent peak amplitude showed possible heterogeneity of variance. Finally, substantial differences in the pattern of relations among key variables were not observed using the 8-trial minimum and the more stringent 10-trial minimum, and thus in the interest of maintaining equal representation across the spectrum of income, results are reported below based on data from children who met the 8-trial minimum.
Procedures
Families were assessed in offices on a university campus. Procedures and materials were approved by the university's institutional review board. All parents provided prospective informed consent; children provided verbal assent. The children first completed behavioral measures, including the neuropsychological battery of executive control tasks, and then took a break before continuing with the EEG assessment. The order of the two computerized executive control tasks, flanker and frogs/fish, was counterbalanced across participants to control for fatigue and order effects.
Measures
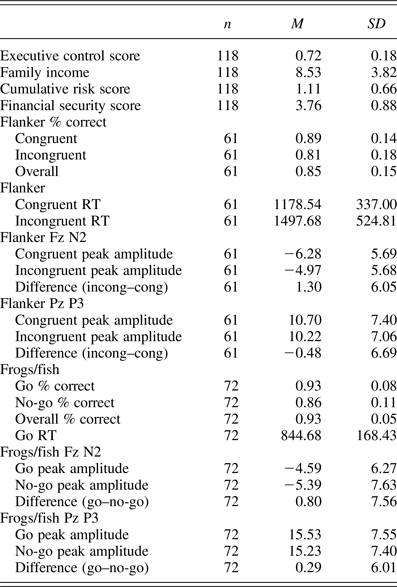
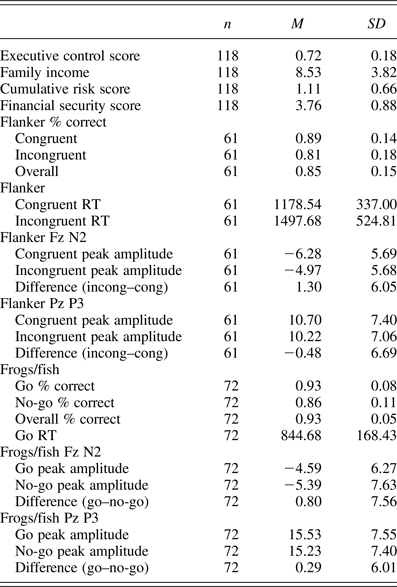
Descriptive statistics for all study variables are presented in Table 1.
Descriptive statistics for main study variables
Income and related stressors
Income
Mothers reported on their current annual household income from all sources on a 14-point Likert scale that provided a fine-grained breakdown of income at the lower levels (e.g., 1 = $14,570 or less, 2 = $14,571–$18,310, 3 = $18,311–$22,050, etc.) to facilitate the identification of families at or near the federal poverty cutoff. The three broad income categories (at or near poverty, lower income, and middle to upper income) were used only for participant recruitment into the EEG assessment, while the continuous 14-point variable representing the full range of income was used for all analyses (M = 8.53, SD = 3.82, range = 1.00–14.00). This continuous measure of income, with equal representation of participants across the full spectrum of income, allowed for a robust test of the effects of income on executive function.
Financial security
Mothers also reported on financial security or strain by rating whether they had enough money to pay for expenses across a variety of domains. Using a Likert scale from 1 to 5, with a rating of 1 indicating strongly disagree and a rating of 5 indicating strongly agree, mothers rated statements “I have enough money for ____” regarding their expenses related to their home, clothes, furniture/household, car, food, medical care, and recreational activities. These ratings were averaged to create a composite score. This variable captures another important aspect of families’ financial experience: specifically, their subjective sense of financial security and ability to cover expenses with their current income.
Cumulative risk
Mothers also provided information about other aspects of environmental risk, which were combined to create a cumulative risk score, including low educational attainment, single-parent status, adolescent-parent status, residential instability, divorce, household density, number of negative life events, and depression. Dichotomous risk factors (e.g., single-parent status) were scored as 0 = not present, 1 = present. Continuous risk factor scores (e.g., household density) were converted into proportions of the total possible score so that they ranged from 0 to 1 and had similar weighting as the dichotomous risk factors.
Neuropsychological battery of executive control
Executive control was assessed using a neuropsychological battery of six tasks. The inhibition and auditory attention subscales of the NEPSY developmental neuropsychological assessment battery (Korkman, Kirk, & Kemp, Reference Korkman, Kirk and Kemp1998) were designed for use with children 5 and older. However, the scales were administered to all of the children in this study to allow the use of identical measures of executive control across time points. The inhibition subtest assesses the ability to inhibit a dominant response to enact a novel response. Specifically, children are shown an array of circles and squares and asked to label each shape in an opposite manner (e.g., say circle when shown a square). Scores were the proportion of correct responses. Auditory attention is a continuous performance test that assesses the ability to be vigilant and to maintain and shift selective set. Children are required to listen to a series of words and respond only when they hear a target word, refraining from responses to other words. Scores were the proportion of correct responses.
Inhibitory control was assessed using Bear–Dragon (Kochanska, Murray, Jacques, Koenig, & Vandegeest, Reference Kochanska, Murray, Jacques, Koenig and Vandegeest1996), which requires the children to perform actions when a directive is given by a bear puppet but not when given by a dragon puppet. Children's actions were scored as performing no movement, wrong movement, partial movement, or complete movement, with scores ranging from 0 to 3. Scores were the proportion of scores across bear and dragon items to the total possible score.
Inhibitory control was also assessed using Day–Night (Gerstadt, Hong, & Diamond, Reference Gerstadt, Hong and Diamond1994), which requires the children to say “day” when shown a picture of moon/stars and “night” when shown a picture of the sun. Children's actions were scored as 1 = correctly providing the nondominant response or 0 = providing the dominant response. Scores were the proportion of correct responses.
The Dimensional Change Card Sort (Zelazo et al., Reference Zelazo, Müller, Frye and Marcovitch2003) assesses inhibitory control, attention focusing, and set shifting. In this task, children are shown two boxes with slots in the top. Target cards, which include a silhouetted figure on a colored background (star on blue background or truck on red background), are attached to the front of each box. Children are instructed to sort cards first according to shape (6 trials) and then according to color (6 trials). The experimenter states sorting rules before each trial and presents a card labeled according to the current dimension (e.g., on a shape trial, “Here's a truck. Where does it go?”). Children then advance to the next level in which the target cards integrate the sorting properties. Target cards consist of a colored figure on a white background (blue star or red truck), and children are again instructed to sort according to shape (6 trials) and then color (6 trials). If they correctly sort more than 75% of the cards, children advance to the next level in which they are instructed to sort by color if the card has a border on it and by shape if the card lacks the border (12 trials). The score was the proportion of correct trials out of the total 36 possible trials.
Head–Toes–Knees–Shoulders integrates attention and inhibitory control (Ponitz et al., Reference Ponitz, McClelland, Jewkes, Connor, Farris and Morrison2008). Children are asked to follow the experimenter's instructions, but to enact the opposite of the direction (e.g., touch toes when asked to touch head). Behaviors were coded as 0 = touched the directed body part, 1 = self-corrected, or 2 = correctly touched the opposite body part. Scores were the proportion of scores across items to the total possible score.
Twenty percent of all tasks were independently recoded to assess interrater reliability (intraclass correlations = 0.72–0.98). An executive control battery score was computed at each time point as the mean of the proportion scores of the individual tasks and was considered missing if over 50% of the individual scores were missing (α = 0.67, intraclass correlation = 0.83).
Computerized executive control tasks
Frogs/fish task
A novel go/no-go paradigm was administered using Presentation software (Neurobehavioral System, Inc.). The task was designed to elicit inhibitory control and two elements of executive attention: sustained and selective attention. The children were instructed to watch the screen and press a button when a group of target stimuli turned blue. At the start of each trial, a white fixation cross was presented in the middle of the screen for 300–500 ms. Then the stimuli, which consisted of frogs and fish randomly arranged on the screen, were presented for 1200 ms. To increase task difficulty, the frogs and fish flickered while on the screen at 3 and 5 Hz, respectively.
Practice trials were administered before test trials to ensure comprehension of task instructions. Children completed practice trial blocks identical to the test trial blocks until they demonstrated task comprehension, with the majority of children requiring only one practice trial block. In each block, children were instructed to press a button with their index finger when the target stimuli for that block (alternately the frogs or the fish) turned from their original color (red or green) to blue. During each block of 12 trials, 25% were go trials in which the target stimuli turned blue (where the correct response was to press the button), 25% of trials were no-go trials in which the distractor stimuli turned blue (where the correct response was to not press the button and the children had to inhibit their response to the blue nontarget stimuli), and the remaining 50% of trials were “standard” trials in which neither stimuli turned blue (where the correct response was to not press the button). No feedback about performance was given during test trials. There were a total of 240 trials divided across 20 blocks of 12 trials. Data from children who completed a minimum of 120 trials (i.e., 50% of the task) were included in subsequent processing steps. Four behavioral scores were calculated: proportion of correct trials out of the total number of go, no-go, and standard trials separately and proportion of correct trials overall, collapsing across trial type.
Flanker task
The child-friendly modified visual flanker task was used to assess detection of conflict and inhibitory control (Rueda et al., Reference Rueda, Posner, Rothbart and Davis-Stober2004). Each trial began with a white fixation cross, presented in the middle of the screen for 300–500 ms. After this, a row of five, blue cartoon fish were presented against a dark blue background. In 50% of the trials (congruent condition), the flanker fish faced the same direction as the center target fish. For the other 50% of trials (incongruent condition), the flanker fish faced the opposite direction of the center target fish. The direction of the center target fish and type of trial were pseudorandomly counterbalanced within trial blocks. The row of fish remained on the screen for up to 5000 ms or until the child made a response. Practice trials were administered before test trials to ensure comprehension of task instructions. Practice trials were identical to test trials, except the participants were given unlimited time to respond and verbal feedback from the experimenter was provided. During test trials, no feedback about performance was given after a response.
Participants were instructed to focus on the center fish and to press the button on a control pad that matched the direction of the center fish. The buttons were covered with pictures of the fish facing in either direction. Participants were instructed to place their left and right index fingers over these buttons, so that they would not need to look down after stimulus presentation. Participants completed 100 trials separated into 10 blocks; data from children who completed a minimum of 50 trials (i.e., 50% of the task) were included in subsequent processing steps. Three scores were calculated: proportion of correct trials out of the total number of congruent and incongruent trials separately and proportion of correct trials overall.
EEG collection and processing
EEG activity was recorded using the Active Two system (Biosemi, Amsterdam, Netherlands). A Lycra cap was placed on the child's head, and 32 Ag/Ag-Cl electrodes were attached according to the 10/20 international labeling system (American Encephalographic Society, 1994). A small amount of electrolyte solution (Signa Gel; Bio-Medical Instruments, Inc., Warren, MI) was applied at each electrode site. The child's scalp was lightly abraded with the tip of a plastic syringe to reduce impedances, and impedances were maintained below 25 μV. Data were sampled at a rate of 256 Hz. According to the Biosemi design, the ground electrode during data acquisition was formed by the driven right leg passive electrode and the common mode sense active electrode.
All data were processed offline using the EEGLab and ERPLab programs (Delorme & Makeig, Reference Delorme and Makeig2004; Lopez-Calderon & Luck, Reference Lopez-Calderon and Luck2010) created for Matlab (MathWorks Inc., Natick, MA, 2000). Data from correct trials only were referenced to the vertex electrode Cz and were bandpass filtered from 0.01 to 30 Hz. Epochs were segmented from –200 to 1500 ms around each stimulus onset. The baseline correction period was –200 to 0 ms relative to the stimulus onset. Epochs containing eye blinks or movement artifacts were excluded based on visual inspection. In addition, epochs were excluded if the voltage difference between sensors exceeded 100 μV in six or more sensors or if an artifact occurred in a channel of interest (P3, P4, Pz, F3, F4, Fz).
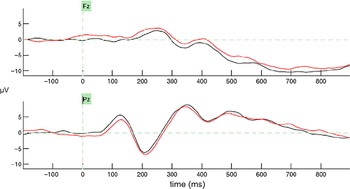
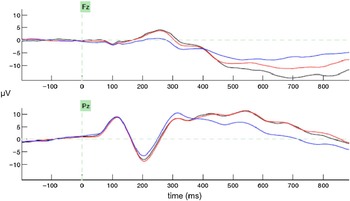
Based on visual inspection of participants’ waveforms, the N2 component for each task condition was identified at frontal sites (F3, F4, Fz) as the maximum negative amplitude between 250 and 450 ms poststimulus for the flanker task and between 250 and 400 ms for the frogs/fish task. The P3 component was quantified at parietal sites (P3, P4, Pz) as the maximum positive amplitude between 400 and 700 ms poststimulus for both tasks. Because we took an individual differences approach to examine the relations between the children's ERP data and their performance on the executive control tasks, we were interested in the individual variability in the ERP data across conditions. However, the group-averaged ERP waveforms are presented in Figures 1 and 2.
(Color online) Group-averaged waveforms for the stimulus-locked event-related potential (ERP) components for 61 children on the flanker task. ERP waveforms for the incongruent trials are in red (online only) and congruent trials are in black.

(Color online) Group-averaged waveforms for the stimulus-locked event-related potential (ERP) components for 72 children on the frogs/fish task. ERP waveforms for the go trials are in black, no-go trials are in red (online only), and standard trials are in blue (online only).

Results
Analytic plan
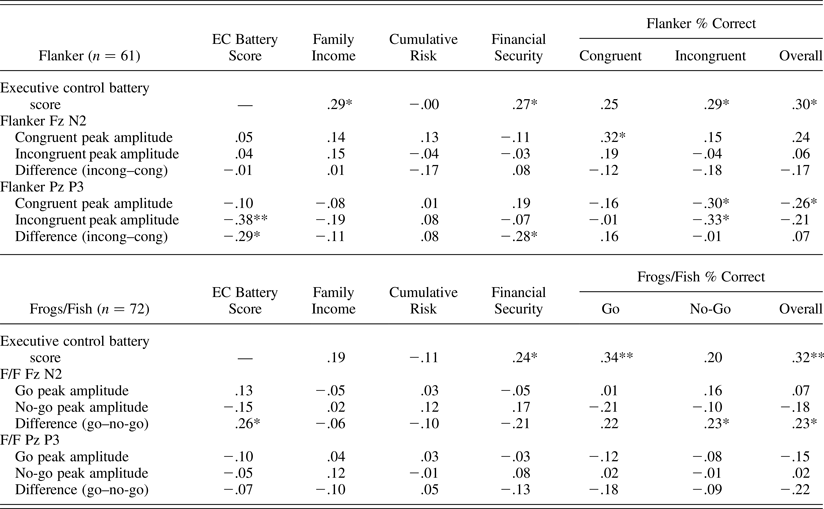
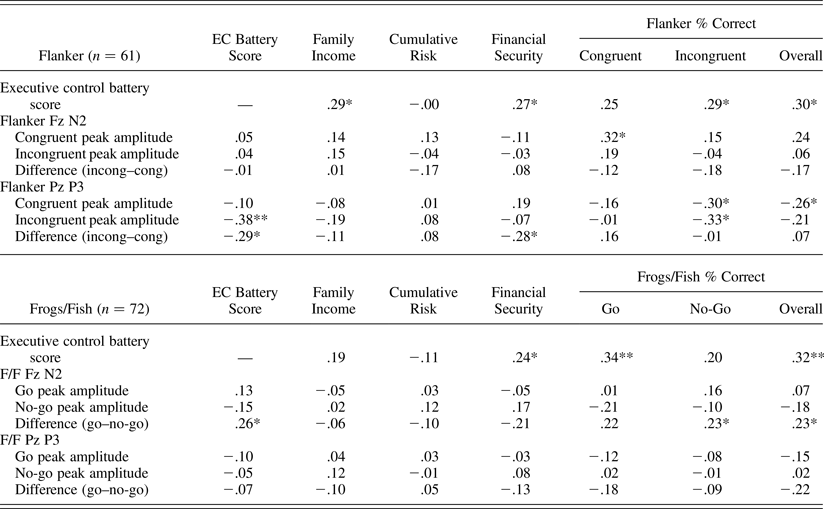
A series of correlational and regression analyses were conducted to examine the relations among income and related stressors, the ERP components, performance on the computerized executive control tasks, and performance on the broader executive control battery (see Table 2). The limited existing literature made it difficult to predict the pattern and direction of the hypothesized relations; therefore, we considered these analyses exploratory and did not correct for multiple comparisons. Initial correlations revealed that amplitudes of the ERP components for each condition for each task were correlated across left, right, and central sites within their respective regions (rs = .51–.81, all ps < .001). When further probed within the three broad income categories (at or near poverty, lower, and middle to upper income), the magnitude of these correlations remained roughly equivalent, suggesting that there were not more diffuse or localized patterns of activity based on income. Thus, only amplitude of the ERP components at the midline sites was included in subsequent analyses. We then examined whether the ERP components were related to performance on the flanker and frogs/fish tasks, to performance on the executive control battery, and to family income, testing our hypothesis that the relation of income to executive control battery performance would be accounted for by amplitude of the ERP components.
Correlations among flanker task, frogs/fish task, and other study variables
*p < .05. **p < .01.
Relations among income and related stressors
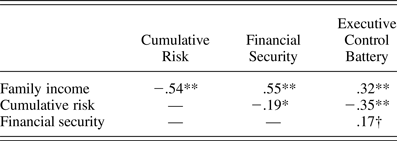
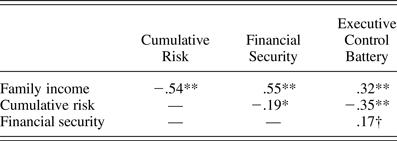
Annual income values across the four time points were strongly correlated (rs = .77–.91). Cumulative risk scores were correlated moderately to strongly across the four time points (rs = .62–.77). There was also a moderate negative relation between the two indices across time (rs = –.53 to –.62). Thus, in subsequent analyses, the annual income value and cumulative risk scores from the time point concurrent with the EEG assessment were used. As expected, financial security from the concurrent time point was positively related to income and negatively related to cumulative risk (see Table 3), such that less financial security was associated with lower incomes and higher ratings of cumulative stressors.
Correlations among executive control, income, and related stressor variables for full sample (N = 118)
†p < .08. *p < .05. **p < .001.
Relations among executive control, income, and related stressors
Income was directly related to performance on the executive control battery (r = .32 p = .001), such that higher income was related to better performance. Income was also related to overall accuracy on the frogs/fish task (r = .19, p = .042) and associated at a trend level with overall accuracy on the flanker (r = .17, p = .076). Contrary to our hypothesis, however, income was not related to amplitude of the N2 or P3 on either task, suggesting that, at least for this sample, under these task conditions, income was not related to differences in the basic neural processes assessed that are believed to underlie executive control performance.
Cumulative risk and financial security showed a similar pattern of association with the measures of executive control. Both were also significantly related to performance on the executive control battery (see Table 3). Like income, neither was related to the ERP measures. Although income, cumulative risk, and financial security are each likely to capture some shared and some unique variance in the risks posed to families living in poverty or lower income, these three indicators of risk were moderately to highly correlated with each other and were stable over time. The nonsignificant associations of income, cumulative risk, and financial security with the ERP suggest that the associations of income and related risk factors with performance on the executive control battery are not accounted for by the neural processes captured by the N2 or P3. Nonetheless, it was useful to examine the associations of the ERPs with performance on the executive control tasks to clarify the pattern of associations.
Behavioral performance: Computerized executive control tasks
Behavioral performance for the computerized executive control tasks is reported in Table 1. Behavioral data are presented only for children whose ERP data were included in analyses because the relations among the ERP components, income, and behavioral performance were the main questions of interest.
Main effects of task condition on behavioral performance were observed for both tasks. As expected, accuracy was significantly higher for congruent (M = 0.89, SD = 0.14) than incongruent (M = 0.81, SD = 0.18) flanker trials, t (60) = 4.76, p < .001. Reaction times were significantly faster for the congruent trials compared to the incongruent trials, consistent with a slowing of response due to the additional executive control processes required on incongruent trials, t (60) = –8.20, p < .001) For the frogs/fish task, accuracy was significantly higher for the go trials than for the no-go trials, t (71) = 4.88, p < .001.
Overall, accuracy was lower on the flanker task than on the frogs/fish task, t (52) = 4.72, p < .001, suggesting that it was more difficult for the children. For the flanker task, the percent correct on incongruent trials and percent correct overall were significantly correlated with performance on the executive control battery (see Table 2). For the frogs/fish task, the percent correct on go trials and percent correct overall were correlated with executive control battery performance (see Table 2).
Differences between children assessed at Time 3 versus Time 4 (i.e., age differences) were observed on all performance variables for both tasks, indicating that performance was better for older children. Thus, time point was included as a covariate in regression analyses.
ERP relations to executive control tasks
Main effects of task condition (flanker: congruent, incongruent and frogs/fish: go, no-go) for the N2 and P3 components were not observed at the group level for either task, which supported the use of an individual differences approach to analyzing the relations between distinct patterns of neural processes to our other variables of interest. For the flanker task, peak amplitude for each condition for each component was examined, as was a difference score subtracting peak amplitude for congruent trials from peak amplitude for incongruent trials (Buss et al., Reference Buss, Dennis, Brooker and Sippel2011; Rueda et al., Reference Rueda, Posner, Rothbart and Davis-Stober2004). Despite a nonsignificant overall effect of condition, 44.3% of children (n = 27) demonstrated an expected positive difference for the incongruent peak minus congruent peak score for the P3. The peak amplitude of the N2 for congruent trials was related to accuracy on congruent trials and overall performance (see Table 2), such that a less negative N2 amplitude during congruent trials was linked to better performance on the congruent trials. Such an association was not found for incongruent trials. The P3 difference score for incongruent minus congruent trials and peak amplitude for incongruent trials were negatively related to accuracy on the incongruent trials, suggesting that smaller difference between congruent and incongruent trials and a less positive P3 amplitude for incongruent trials were related to better performance.
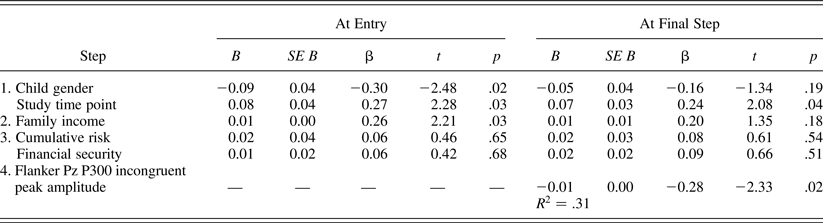
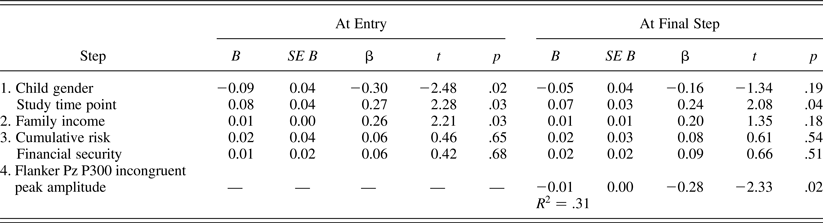
Linear regression was used to test whether the P3 for incongruent trials would predict performance on the executive control battery above the effects of child gender, time point in the study (i.e., child age), and family income. Initially, we aimed to test whether differences in the ERP components would account for the effects of income on executive control battery performance, but given the lack of association between income and the ERP components, we instead tested whether the ERPs were associated with the executive control battery performance above the effects of income, cumulative risk, and financial security. The amplitude of the P3 for incongruent trials significantly predicted the executive control battery score (β = –0.28, p = .02) when entered in the final step of a regression model that included gender, study time point, family income, cumulative risk, and financial security, R 2 = .31, F (6, 54) = 3.96, p = .002 (see Table 4). A lower P3 amplitude on the incongruent trials was independently related to better performance on the executive control battery. P3 amplitude remained significantly related to the executive control battery score when one or all three income-related risk variables were included in regression models.
Summary of regression analyses for flanker variables predicting executive control battery score (n = 61)
For the frogs/fish task, a difference score of the amplitudes from the go condition minus the no-go condition and the peak amplitudes from each condition for the N2 and P3 were examined. Only the difference score for the N2 was related to performance on that task (see Table 2). Despite a nonsignificant overall effect of condition, 34.7% of children demonstrated a positive go minus no-go difference and a negative N2 amplitude (n = 25).
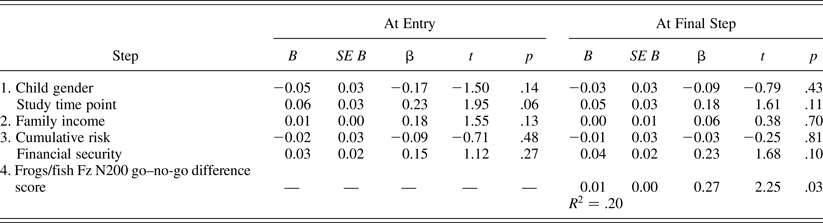
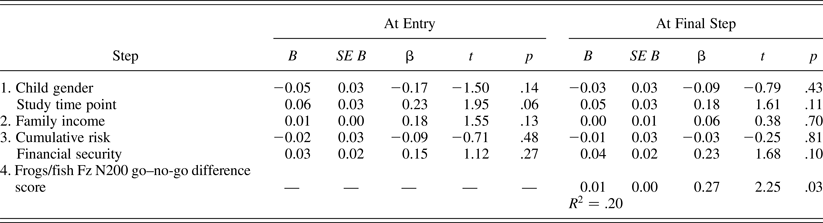
The frogs/fish go minus no-go difference score also predicted the executive control battery score (β = 0.27, p = .03) when entered in the last step of a regression that included child gender, study time point, and the three income-related risk variables, R 2 = .20, F (6, 65) = 2.71, p = .02 (see Table 5). This suggested that the children who showed greater differences in their N2 responses between go and no-go trials performed better on the executive control battery. This effect may reflect the detection of the conflict or inhibition required on the no-go trials. The same pattern of results was obtained when entering the income-related risk variables (cumulative risk and financial security) individually or jointly to the regression model, again suggesting that the neural processes measured by the ERP are not mediating the relation of income or its related stressors to executive control.
Summary of regression analyses for frogs/fish variables predicting executive control battery score (n = 72)
Discussion
This study tested the hypothesis that income differences observed in children's executive control are accounted for by differences in the underlying neural processes. This study adds to the small number of studies examining this question during the less often studied preschool period, when executive control is known to be developing rapidly. The results showed that ERP components that are thought to reflect the neural processes subserving executive control, that is, executive attention and inhibitory control, not only predicted performance on the computerized executive control tasks themselves, but also predicted executive control as assessed by performance on a neuropsychological battery. As has been reported elsewhere for this sample, income was positively related to performance on this neuropsychological battery measuring executive control (Lengua, Moran, et al., Reference Lengua, Moran, Zalewski, Ruberry, Kiff and Thompson2014). However, while income was related to behavioral performance, it unexpectedly was not related to the neural responses measured by ERP during the computerized executive control tasks. Below we discuss some possible reasons for this lack of association in the current study and suggest future research directions that could help to clarify the relations among income, executive control as indexed by behavioral measures, and the neural processes underlying such behaviors.
Amplitude of the ERP components was related to performance on both the computerized executive control tasks and the broader executive control battery, providing indirect evidence for similar neural processes supporting performance on each set of tasks. Specifically, the N2 difference score for go versus no-go trials was related to performance on the frogs/fish task as well as the broader executive control battery, consistent with the suggestion that the N2 may represent detection of conflict. This conflict monitoring is a fundamental first step in successfully responding to the task demands, because a subject must first differentiate between trials in which the correct response corresponds with the prepotent response (go) from trials in which the correct response conflicts with the prepotent response (no-go). Successful conflict detection necessarily precedes inhibitory control in the processing stream. The P3 amplitude during incongruent trials was related to performance on the flanker task and the broader executive control battery, consistent with a role for that component in stimulus evaluation. Here again, stimulus evaluation is a necessary early step in processing to detect the target, inhibit attention to the distracting incongruent flankers, and respond accurately on incongruent trials. This is one of only a handful of studies that have shown specific, conceptually selected ERP components to be related to executive function performance in young children.
Given this pattern of associations among the amplitude of the ERP components, performance on the computerized executive control tasks, and performance on the executive control battery, it was surprising that income did not predict the amplitude of the ERP components during the computerized executive control tasks, contrary to our hypothesis. The frogs/fish and flanker tasks were selected specifically to test core executive control abilities, executive attention and inhibitory control, respectively, and to elicit the N2 and P3 ERP components. Flanker and related attention-network tasks have been widely used in developmental studies of executive control (Buss et al., Reference Buss, Dennis, Brooker and Sippel2011; Fan, McCandliss, Sommer, Raz, & Posner, Reference Fan, McCandliss, Sommer, Raz and Posner2002; Rueda et al., Reference Rueda, Posner, Rothbart and Davis-Stober2004). We developed the frogs/fish task to assess selective attention (i.e., attention focusing and shifting) in the visual modality, because many available tasks utilize auditory stimuli. This allowed for consistency across the two tasks and eliminated potential for confounds related to using different perceptual modalities. The frogs/fish task also requires the use of inhibitory control and is thus similar to go/no-go tasks, which are widely used to assess developmental changes in executive control (Durston et al., Reference Durston, Thomas, Yang, Uluğ, Zimmerman and Casey2002; Jonkman, Reference Jonkman2006; Tamm, Menon, & Reiss, Reference Tamm, Menon and Reiss2002). While caution must be exercised in interpreting null findings, we explore some possible factors below that may have constrained our ability to detect the predicted associations between income and our ERP components of interest.
One factor to consider is the range in the level of difficulty in the computerized tasks as compared to that of the executive control battery. The aggregation of multiple tasks in the executive control battery might result in a more reliable measure of individual differences in executive control, hence providing more power to detect an association with income. Performance on the computerized executive control tasks was near ceiling for some of the children. The tasks were intentionally selected to not be overly demanding so that the electrophysiological responses to stimulus qualities could be assessed for most children. However, one unintended effect may be that income differences were not observed. Future studies should replicate or expand on these findings by including a wider variety of tasks or ages to capture a wider range of performance variability. In addition, detecting income-related neural differences may require the examination of earlier, more purely attentional components (e.g., N1 or P1) or utilization of executive control tasks with slightly different task demands (e.g., using a different ratio of go to no-go trials or a Stroop-like task). The components we selected may still be developing for some of the children in this preschool sample, because their executive control abilities are actively emerging during this developmental stage. It is also possible that the effects of income have their influence further downstream, for example, on higher level processes during which initial detection of conflict is integrated with motor response. Nonetheless, performance on both of the computerized tasks was related to the executive control battery performance and to income, so low reliability is not likely to fully account for the lack of association between the ERP components and income.
Our sample included a range of income levels with overinclusion of lower income families. This is critical for the generalizability of the findings to other children and families across the socioeconomic strata. Moreover, inclusion of lower-income families was critical specifically to the hypotheses being tested, because the children who typically participate in developmental research studies tend to be from families with more resources, and thus may have a higher level of executive control than children who are living in impoverished environmental settings. Including families across a broad range of income levels allows us to better understand these phenomena across the spectrum in which they occur. However, it is possible that even among the lowest income families in our sample, there may not be as high a prevalence of income-related stressors as exists in the broader population. We did see moderate associations between income and risk factors as expected, but it is possible that a potentially truncated range of cumulative risk or financial strain in this sample limited our ability to detect associations between the neural processes underlying executive control and the mediating risk factors related to the low income environment. Future research should continue to carefully measure these related, but separable, constructs to delineate the specific neural and behavioral effects that particular risks (e.g., parenting, nutrition, and stress) may have on the developing child's executive control abilities.
Finally, as is common in studies conducted with preschool-aged children, a number of cases were excluded due to excessive artifact in the EEG data, which resulted in a smaller number of included participants for some analyses and likely limited statistical power to detect an effect of income. These artifacts were likely related in large part to movement and could have perhaps been reduced by conducting the EEG assessment on a separate day rather than at the end of a long behavioral assessment. Because income was the central variable of interest, it was critical to not exclude cases inequitably across income levels; however, with a higher threshold for the minimum number of artifact-free ERP trials, lower income children were more likely to be excluded. Thus, we selected an 8-trial minimum for inclusion in analyses. It is important to note that there were not substantial differences observed in the pattern of relations between executive control and the ERP data when data were analyzed using a 10-trial minimum. The fundamental difference between those thresholds was in the disproportionate exclusion of children from lower income families.
Training in executive control, including improving inhibitory control and executive attention through computer games and other fun activities, has been shown to be effective, which may translate to better self-regulation in day-to-day contexts (Dowsett & Livesey, Reference Dowsett and Livesey2000; Kerns, Eso, & Thomson, Reference Kerns, Eso and Thomson1999). This has major implications for improving school readiness and adjustment, especially in at-risk populations (Eisenberg et al., Reference Eisenberg, Spinrad, Fabes, Reiser, Cumberland and Shepard2004; Lengua, Bush, Long, Kovacs, & Trancik, Reference Lengua, Bush, Long, Kovacs and Trancik2008; Shoda, Mischel, & Peake, Reference Shoda, Mischel and Peake1990). The observed relations between the ERP correlates of executive control and performance on the broader executive control battery provide further support that training basic executive control processes could have far-reaching effects on children's self-regulatory abilities across the many daily situations that demand it. To mediate some of the disadvantage conferred upon children who grow up in low-income families, it is critical that future research efforts continue to examine at what levels (e.g., neural, cognitive, behavioral, and emotional) family income influences the development of executive control, and by what mechanisms.