Implications
Increasing the amount of milk replacer (MR) and concentrate offered to dairy bull calves does not result in a significant growth response. A greater intake of MR reduces concentrate intake and may prevent early weaning. Blood metabolite concentrations indicate that Holstein-Friesian (F) calves have reduced protein digestion on a high plane of nutrition; indicated by markers of protein digestion in the blood. Within the context of the current study, the performance, solid feed intake and feeding behaviour as well as blood metabolite concentrations indicate that a moderate plane of nutrition results in optimum performance of pre-weaned and Jersey (J) bull calves.
Introduction
The genetic composition of the F and J breeds has changed over the last 40 years with breeding programmes for both breeds focussing on intensive selection for milk-related traits (Haskell et al., Reference Haskell, Simm and Turner2014). This genetic selection has resulted in nutrients being partitioned towards the mammary gland at the expense of muscle growth, and as a result of selection for milk production in the female, dairy-bred males are regarded as low-value animals, due to their limited potential for muscle growth. In addition, pre-weaning feeding regimes have not been tailored to match the changes in genetics, despite the two breeds having different birth weights, average daily gains (ADG) and mature BWs (McNamee et al., Reference McNamee, Keane, Kenny, Moloney, Buckley and O’ Riordan2015).
The volume of MR offered to calves during pre-weaning has been demonstrated to have a significant effect on performance and health (Ballou et al., Reference Ballou, Cobb, Earleywine and Obeidat2013). In F heifer calves, a meta-analyses by Soberon and Van Amburgh (Reference Soberon, Raffrenato, Everett and Van Amburgh2013) found that every kilogram increase in pre-weaning ADG results in a 1550 kg increase in milk yield during first lactation. It has also been shown that pre-weaning nutrient intake accounts for 22% of the variation in milk yield during first lactation (Soberon et al., Reference Soberon and Van Amburgh2012). The amount of MR offered to F calves up until 56 days, shows that calves offered 50 v. 25 kg MR are 25 kg heavier when slaughtered as steers at 25 months of age resulting in an 11 kg heavier carcass (Fallon and Harte, Reference Fallon and Harte1986). A meta-analysis from our own group suggests that up to 40% of the variation in carcass weight of F bulls, when slaughtered at 16 months of age, can be explained by performance up to 12 weeks of age (Kenny and Kelly, 2016, unpublished). The quantity of MR offered has been shown to affect the transition from milk to solid feed during weaning and rumen development and thus overall feed efficiency potential (Bach et al., Reference Bach, Terre and Pinto2013). A greater intake of MR, in the pre-weaning period, results in improved immunity, milk yield during first lactation and a reduction in age at first calving (Khan et al., Reference Khan, Bach, Weary and von Keyserlingk2011a); however, increased MR intake reduces pre-weaning concentrate intake. The importance of degradable carbohydrate supply from concentrate intake for rumen development has been recently reviewed (Khan et al., Reference Khan, Weary and von Keyserlingk2016) highlighting the need to design pre-weaning regimes to optimise solid feed intake, particularly where greater quantities of MR are offered.
Improvements in technology have led to the advent of automatic calf-feeding systems, which can greatly reduce the labour associated with bucket feeding on farms. In addition, the health of the calf can be monitored as the systems can highlight changes in feeding behaviour associated with illness (Svensson and Jensen, Reference Svensson and Jensen2007). Offering elevated quantities of MR promotes efficiency of these systems by reducing the number of unrewarded visits to the feeder and thus minimising queuing for feed (Jensen, Reference Jensen2006). In addition, where calves are offered a low daily allocation of milk they are likely to engage in non-nutritive suckling, which has been shown to have negative effects on health and performance (Lidfors and Isberg, Reference Lidfors and Isberg2003). Calves fed an enhanced allowance of MR (5 v. 9 l) in the pre-weaning period perform more locomotor play, associated with improved animal welfare (Jensen et al., Reference Jensen, Duve and Weary2015).
There is a deficit in the literature of information regarding best practice for rearing dairy-bred bull calves which have been sourced off-farm. The changes in animal genetic merit in recent years and the expected increased output of male calves as a by-product of dairy industry expansion, particularly in Europe with the abolition of milk quotas in 2015 (Ashfield et al., Reference Ashfield, Crosson and Wallace2013) merit a re-examination of pre-weaning protocols used to rear male calves from the dairy herd. We hypothesised that an increased plane of nutrition would increase the early-life growth characteristics of pre-weaned male dairy calves of two contrasting breeds. The aim of this study was to characterise the growth, feeding behaviour and metabolic responses in purebred male calves of two dairy breeds, offered one of three pre-weaning milk feeding regimes.
Material and methods
All animal procedures performed in this study were conducted under experimental licence from the Irish Department of Health and Children (licence number B100/4516). Protocols were in accordance with the Cruelty to Animals Act (Ireland 1876, as amended by European Communities regulations 2002 and 2005) and the European Community Directive 86/609/EC.
Animal management
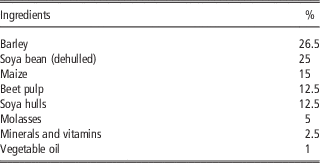
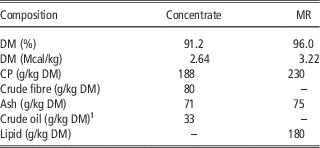
Holstein-Friesian (n=42) and J (n=25) bull calves were sourced from commercial dairy farms and assembled at Teagasc, Grange Beef Research Centre at a mean±SD age (14±4.7 v. 27±7.2 days) and BW (47±5.5 v. 33±4.7 kg). The J calves started treatments later as it took longer, on average, to assemble the required number of these calves, because of lower availability of calves from this breed in Ireland. Calves were group-housed indoors on sawdust-floored pens (balanced for breed and plane of nutrition) with a space allowance of 1.6 m2/calf as per EU regulations (S.I. No. 311 of 2010). After 5 days of acclimatisation, calves were blocked by breed, age, weight, sire and farm of origin and randomly assigned to a high, medium or low plane of nutrition. Calves were offered MR (Tables 1 and 2; Blossom Easymix; Volac, Co. Cavan, Ireland) and concentrate (Table 1) in pelleted form using an electronic feeding system (Vario; Foster-Tecknik, Engen, Germany), which recorded all feed-related events including intake of both MR and concentrate, drinking speed, as well as number of rewarded (when calves receive milk) and unrewarded (no milk dispensed) visits to the machine. Holstein-Friesian calves on the high, medium and low planes of nutrition were offered 8 l containing 1200 g MR, 6 l containing 800 g MR and 4 l containing 500 g MR daily, respectively. Jersey calves on high, medium and low planes of nutrition were offered 6 l (800 g), 4 l (500 g) and 3.5 l (350 g) of MR daily, respectively. Concentrates were offered either ad libitum, to a maximum of 1.5 kg or to a maximum of 1 kg daily to high, medium and low calves, respectively. Diet design was based on National Research Council (2001) guidelines. The amount of MR offered resulted in F calves being offered 1.9%, 1.3% and 0.8% of their BW for high, medium and low respectively; J calves were offered 1.5%, 1.2% and 0.7% of their BW for high, medium and low, respectively. The amount of concentrate offered resulted in F calves being offered 0.4%, 2.4% and 1.6% of their BW for high, medium and low, respectively; J calves were offered 0.5%, 2.9% and 1.9% of their BW for high, medium and low, respectively. The predicted intake of ad libitum concentrate in calves on a high plane of nutrition was based on the results of Ballou et al. (Reference Ballou, Cobb, Earleywine and Obeidat2013). Calves offered a high and medium plane of nutrition were allowed to consume up to 2 l of MR per visit and calves in the low group were allowed to consume up to 1.5 l per visit; rewarded visits were spaced at a minimum of 2 h apart. Calves were offered these diets for a minimum of 56 days and were weaned once consuming 1 kg of concentrate/day for 3 consecutive days; achieved using gradual weaning over 14 days. The metabolisable energy values of MR and concentrate fed were calculated using energy (Mcal/kg) values of ingredients as stated in National Research Council (2001).
Composition of concentrate fed to calves

Chemical composition of concentrate and milk replacer (MR)

DM=dry matter.
1 Concentrate using ether extraction, MR using acid hydrolysis.
The health status, immunological profiles and overall health management of the animals used in this experiment has been previously characterised (Johnston et al., Reference Johnston, Kenny, Kelly, McCabe, McGee, Waters and Earley2015).
Measurements
Calves were weighed weekly and blood samples were collected via jugular venipuncture on weeks 1, 4 and 7 relative to the start of the trial period. On each occasion, blood was collected into a 9 ml evacuated tube containing lithium heparin as an anticoagulant (Greiner Vacuette; Cruinn Diagnostics, Dublin, Ireland). Concentrations of albumin, urea, total protein, β-hydroxybutyrate (BHB), glucose, non-esterified fatty acid (NEFA), triglycerides and creatinine were determined as described by Lawrence et al. (Reference Lawrence, Kenny, Earley, Crews and McGee2011). All metabolite concentrations were measured on an automatic analyser (AU 400; Olympus, Tokyo, Japan). The inter-assay CVs were determined by replicating a low, normal and elevated reference samples at the beginning, middle and end of each assay. The inter-assay CVs for low, normal and elevated were 2.32%, 1.15% and 0.84%, respectively. The sensitivity of each assay was defined as the lowest concentration detectable, as determined by a standard curve. The sensitivities were as follows: glucose 0.02 mmol/l, urea 0.9 mmol/l, BHB 0.1 mmol/l, NEFA 0.072 mmol/l, triglycerides 0.004 mmol/l, total protein 0.8 g/l, albumin 0.1 g/l, creatinine 2.3 µmol/l. Globulin concentration was calculated as the difference between total protein and albumin concentrations.
Statistical analysis
All data were analysed, within breed, using Statistical Analysis Software (SAS v9.3). Data were tested for normality (UNIVARIATE procedure) and, where appropriate, transformed to the power of lambda (TRANSREG procedure). Data were subsequently analysed using ANOVA (MIXED procedure). For analysis of ADG, feed conversion ratio (FCR) and weaning weight, block and plane of nutrition were included in the model. For metabolite analysis, block, plane of nutrition and sampling time were included in the model. For all variables, the covariance matrix was determined by examining the Bayesian information criteria (smaller is better) value. Animal was the experimental unit. Sampling time was included in the statistical models as a repeated measure for blood metabolites. Day was the repeated term for feeding behaviour and intake analysis. Statistical significance of the MR v. concentrate intake, when offered the high plane of nutrition only, was modelled using regression (REG procedure). All results are presented as mean±SEM, unless stated otherwise.
Results
Feed intake and feeding behaviour
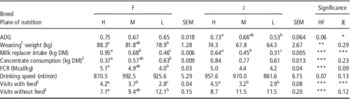
Milk consumption reflected the experimental design with calves on a high plane of nutrition consuming more than their counterparts on a medium or low plane of nutrition, within the F and J breeds (P<0.001; Table 3). Holstein-Friesian calves on a high plane of nutrition consumed less concentrate than F calves on a low plane (P<0.001; Supplementary Figure S1), with that of calves on a medium plane being intermediate (P=0.17). There was no difference in concentrate consumption among J calves offered different planes of nutrition (P=0.23). Holstein-Friesian calves offered a high plane of nutrition tended to drink slower than calves on a medium plane (P=0.06; Table 3); F calves on a low plane of nutrition did not differ in drinking speed compared with those on a high or medium plane (P=0.48). Plane of nutrition had no effect on drinking speed in J calves (P=0.13). Both F and J calves offered a high plane of nutrition had a greater number of rewarded visits than calves offered a medium or low plane of nutrition (P<0.01; Table 3). Within F calves, a medium v. a low plane of nutrition resulted in a greater number of rewarded visits (P<0.05). The number of rewarded visits was similar for J calves on a medium and low plane of nutrition (P=0.52). The number of unrewarded visits did not differ between J calves offered different planes of nutrition (P=0.12; Table 3). Holstein-Friesian calves offered a high plane of nutrition had fewer unrewarded visits than calves offered a low (P<0.001) but not a medium (P=0.14) plane of nutrition.
Effect of plane of nutrition on performance and feeding behaviour in the pre-weaning period of Holstein-Friesian (F) and Jersey (J) bull calves offered a high (H), medium (M) or low (L) plane of nutrition

ADG=average daily gain; FCR=feed conversion ratio; DM=dry matter.
a,b,cValues with differing superscript letters within a row differ significantly.
1 Gradual weaning over 14 days, calves weaned when consuming 1 kg of concentrate for 3 consecutive days.
2 Average daily.
*P<0.05, **P<0.01, ***P<0.001.
Animal performance and feed efficiency
The mean age (±SD) at weaning was 83(±10.5) days. Average daily gain of F calves on a high plane tended to be greater than those on a low plane of nutrition (P=0.07; Table 3); ADG of F calves on a medium plane of nutrition was intermediate (P=0.54). The tendency for greater ADG in high F calves resulted in these calves being heavier at weaning than those on a low plane of nutrition (P<0.01; Table 3) and tending to be heavier than those on a medium plane (P=0.07). Weaning weight of F calves on a medium plane of nutrition was not different to F calves on low (P=0.61). Jersey calves offered a high plane of nutrition had a greater ADG than those on a low plane (P<0.01), with those on a medium plane having an intermediate growth rate (P=0.42). Notwithstanding the above, offering J calves different planes of nutrition did not result in differences in weaning weight (P=0.29). Feed to gain ratio (FCR) was greater (poorer efficiency) for F calves (P<0.001) on a high compared with a low plane of nutrition, whereas calves on a medium plane were intermediate (P=0.83). Feed to gain ratio in J calves was unaffected by plane of nutrition (P=0.19), with the exception of a tendency for reduced efficiency when J calves were offered a high v. a low plane of nutrition (P=0.08).
Blood metabolites
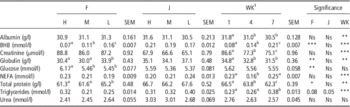
Albumin concentrations were unaffected by plane of nutrition, irrespective of breed (P>0.10; Table 4). Albumin was greater on week 1 than either weeks 4 or 7 (P<0.01). In F calves, BHB concentrations decreased with increasing plane of nutrition (P<0.001; Table 4). In contrast, there was no effect of plane of nutrition on BHB concentration in J calves (P=0.69). Concentrations of BHB increased in all groups of calves in a linear fashion between weeks 1 and 7 (P<0.001). Creatinine concentrations were unaffected by plane of nutrition irrespective of breed (P>0.10; Table 4). In all groups of calves, concentrations of creatinine decreased between weeks 1 and 7 of the study (P<0.001).
Effect of plane of nutrition and week (WK) on plasma metabolites in pre-weaned bull calves of Holstein-Friesian (F) and Jersey (J) calves fed a high (H), medium (M) or low (L) plane of nutrition

BHB=β-hydroxybutrate, NEFA=non-esterified fatty acid.
a,b,cValues with different superscript letters within a row are different (P<0.05); Ns= non-significant (P>0.10).
1 Refers to WK of trial period, that is 1=WK 1, 2=WK 4, 3=WK 7.
*P<0.05, **P<0.01, ***P<0.001.
Holstein-Friesian calves on high and medium planes of nutrition had lower globulin concentrations than those on a low plane of nutrition (P<0.01; Table 4). Globulin concentrations in J calves were unaffected by plane of nutrition (P=0.11). Globulin concentrations decreased, in both breeds between weeks 1 and 4 (P<0.05) and remained at this concentration, to week 7 of the study. Concentrations of glucose were greater in F calves offered a high compared with a medium or low plane of nutrition (P<0.01; Table 4). Plane of nutrition had no effect on glucose concentrations in J calves (P=0.50). Glucose concentrations remained at similar concentrations between weeks 1 and 7 of the study (P=0.59). Concentrations of NEFA were unaffected by plane of nutrition, irrespective of breed (P>0.10; Table 4). There was a quadratic effect of week on NEFA concentration (P<0.001); NEFA concentrations were the same at weeks 1 and 7, but exhibited a dramatic decrease at week 4.
Total protein concentrations were similar in F calves offered a high or medium plane of nutrition and both were lower than in calves on a low plane of nutrition (P<0.05; Table 4). Plane of nutrition offered to J calves, had no effect on total protein concentrations (P=0.60). Total protein decreased in a linear fashion between weeks 1 and 7 of the study (P<0.001). Holstein-Friesian calves offered a high plane of nutrition tended to have greater triglyceride concentrations than those offered a medium plane of nutrition (P=0.07; Table 4). On a low plane of nutrition, F calves had similar triglyceride concentrations to those offered a high or medium plane of nutrition (P=0.52). Jersey calves on a high plane of nutrition tended to have lower triglyceride concentrations (P=0.08) than those on a low plane; in turn J calves on a low plane of nutrition tended to have greater triglyceride concentrations than J calves on medium (P=0.08). Triglyceride concentrations were similar at weeks 1 and 4, followed by an increase at week 7 (P<0.001). Plane of nutrition had no effect on urea concentrations in either F or J calves (P>0.10; Table 4). Urea concentrations did not change over time (P>0.10).
Discussion
This study highlights breed-specific feeding behaviour, systemic metabolite and animal performance responses to divergent planes of nutrition. The main findings of the study were as follows: (i) differences in concentrate intake, which were influenced by the amount of MR offered, highlighted the potential for nutritional problems during the transition from milk to solid feeding; (ii) feeding behaviour was affected by plane of nutrition, with the number of unrewarded feeding events being greater in calves offered less MR; and (iii) systemic metabolites were affected by plane of nutrition, particularly in F calves, and also by the stage of the pre-weaning period.
Feeding behaviour
Calves on the high plane of nutrition had the most rewarded and fewest unrewarded visits to the feeder, consistent with their greater feed allowance and intake and indicating that they were not as hungry as calves on the medium or low planes of nutrition. Increased incidence of unrewarded visits suggest that calves have not reached satiety. A greater number of daily unrewarded visits has been linked with a greater level of non-nutritive sucking, that is calves sucking a teat or other inanimate objects leading to the swallowing of air, bloating of the rumen and abomasum (Hofman, Reference Hofman1992). The results of our study indicate a lower incidence of non-nutritive sucking (of the teat) behaviour when F calves are offered a high plane of nutrition. Although not statistically significant, J calves on a medium or low plane of nutrition had three extra unrewarded visits per day, compared with those on a high plane of nutrition, indicating a lack of satiety.
Although drinking speed is indicative of the eagerness of a calf to drink and thereby may aid the diagnosis of illness, there is contradictory evidence in the literature regarding the utility of drinking speed as a reliable indicator of health. Reduced drinking speed has been associated with disease in veal calves; however, the authors noted high levels of false-positive results (i.e. calves may have had a reduced drinking speed without any symptoms of illness) and therefore deemed drinking rate alone, an unreliable health indicator (Maatje et al., Reference Maatje, Verhoeff, Kremer, Cruijsen and van den Ingh1993). A later study found no significant correlation between drinking speed and incidence of disease in calves (Svensson and Jensen, Reference Svensson and Jensen2007). However, that study was conducted across two farms, using two different types of milk feeder, making the results difficult to interpret. Consistent with our own findings in F bull calves, in heifer calves offered four different planes of nutrition (500, 750, 1000 or 1250 g MR/day), those receiving a medium plane of nutrition (750 g MR/day) tended to have the greatest drinking speed (Morrison et al., Reference Morrison, Wicks, Carson, Fallon, Twigge, Kilpatrick and Watson2012). With an automated feeding system for calves, drinking speed is a readily available parameter and therefore further work is required to assess the usefulness of drinking speed as an indicator of calf well-being.
Animal performance and efficiency
In F calves offered the same plane of nutrition as the high group in the current study, ADG is reported as between 0.700 and 0.950 kg/day (Eckert et al., Reference Eckert, Brown, Leslie, DeVries and Steele2015) putting the calves in the current study within the range. Holstein-Friesian calves on a low plane of nutrition tended to grow slower than their counterparts on a high plane of nutrition leading to lower weights at weaning. A reduction in ADG has been reported in F calves when offered divergent planes of nutrition similar to those employed in this study (Ballou et al., Reference Ballou, Cobb, Earleywine and Obeidat2013). Such differences in weaning weights would be expected to impact on the age and weight at slaughter. A recent study by Ballou et al. (Reference Ballou, Hanson, Cobb, Obeidat, Sellers, Pepper-Yowell, Carroll, Earleywine and Lawhon2015) examined different feeding regimes in J bull calves where the high treatment were offered 610 g of MR/day in 5 l and only achieved an ADG of 0.450 kg/day. Although not reaching statistical significance, J calves offered a high plane of nutrition were, on average 10 kg heavier at weaning compared with their contemporaries on the low plane of nutrition, reflecting a greater ADG. Although lighter animals may undergo a limited degree of compensatory growth if plane of nutrition is increased post-weaning, this can result in surplus nutrients being partitioned towards greater fat deposition, particularly in dairy-bred animals with limited potential for muscle accretion (Hornick et al., Reference Hornick, Van Eenaeme, Gérard, Dufrasne and Istasse2000). In terms of minimum age at which appreciable compensation can take place, it has been suggested that restricting intake in cattle from birth to 3 months of age may have permanent negative effects on growth (Ryan, Reference Ryan1990) and further work by Berge et al. (Reference Berge, Geay and Micol1991) has indicated that the potential for compensation in animals <6 months of age is limited.
As energy intake increased, FCR decreased, with F calves on the low plane of nutrition being most efficient and a tendency for J calves to be more efficient on a low compared with a high plane of nutrition. Our findings are in contrast to those of Ballou et al. (Reference Ballou, Cobb, Earleywine and Obeidat2013), who reported that both F and J calves, offered a high plane of nutrition were more efficient. It has also been shown that offering calves MR with different CP content can affect their FCR. For example, Bartlett et al. (Reference Bartlett, McKeith, VandeHaar, Dahl and Drackley2006) showed that offering MR with 22%, 14%, 18% or 26% CP results in most efficient use of nutrients in calves at 22% CP. In contrast to our findings, this increased feed efficiency was detected at a greater (6 l MR) compared with a lower (4 l MR) plane of nutrition, showing that calves required less feed per unit of gain when offered 6 l of MR. However, it is important to note that concentrate was not offered when comparing different CP content. It is possible that differences in FCR observed in the current study are linked to the inverse relationship observed between milk and concentrate consumption, observed within breed (Supplementary Figure S1). A similar relationship was observed when F calves offered 500 g MR/day consumed more concentrate at a younger age than their contemporaries offered 1080 g MR/day (Terré et al., Reference Terré, Devant and Bach2007). In that study, the lower concentrate and greater milk consumption led to poorer nutrient absorption, determined by measuring whole tract digestibility.
Plasma metabolites
Systemic concentrations of glucose generally reflected dietary feed intake in F calves. In contrast, glucose was unaffected by plane of nutrition in J calves, which was unexpected given the dietary design and is in contrast to the findings of others (Ballou et al., Reference Ballou, Hanson, Cobb, Obeidat, Sellers, Pepper-Yowell, Carroll, Earleywine and Lawhon2015). Given that increased levels of glucose have been associated with decreased insulin sensitivity in calves (Cheng et al., Reference Cheng, Cai, Jiang and Wu1997); the greater glucose observed in F calves on a high plane of nutrition, in the current study, also indicates decreased insulin sensitivity. A reduced sensitivity to insulin has also been reported in calves offered 1.25% v. 1.5% of BW; a greater amount of MR resulted in lower insulin receptor expression in skeletal muscle (Wang et al., Reference Wang, Drackley, Stamey-Lanier, Keisler and Loor2014).
Irrespective of breed, BHB concentration increased 2.6-fold from the beginning to the end of the trial period. A similar increase has been reported for lambs and calves where BHB concentrations rose as the amount of concentrate consumed increased (Baldwin and Jesse, Reference Baldwin and Jesse1992). Holstein-Friesian calves offered a low plane of nutrition, had greater BHB concentrations than their J counterparts. β-hydroxybutyrate has been shown to indicate a shift in source of nutrients, that is from liquid feed to solids (Coverdale et al., Reference Coverdale, Tyler, Quigley and Brumm2004) and has also been used as an indicator of rumen development in dairy calves (Khan et al., Reference Khan, Lee, Lee, Kim, Ki, Hur, Suh, Kang and Choi2011b). Taking the differences between planes of nutrition in F calves, the lack of differences between J calves and the increase in BHB over time, our findings show that BHB concentrations do reflect increased concentrate intake which may lead to an increase in rumen development.
The lack of difference in NEFA concentration between planes of nutrition within both breeds was indicative that both breeds, across all treatments remained in an anabolic state. In the study of Smith et al. (Reference Smith, Van Amburgh, Diaz, Lucy and Bauman2002), F bull calves were offered three different planes of nutrition (550, 900 or 1080 g MR/day) leading to three divergent growth rates though no clear differences in systemic NEFA concentrations could be detected between the treatment groups. In the current study, NEFA concentrations fluctuated over time, in agreement with Stanley et al. (Reference Stanley, Williams, Jenny, Fernandez, Bateman, Nipper, Lovejoy, Gantt and Goodier2002) when F and J calves were compared on a once or twice per day feeding regime.
Concentrations of albumin, total protein and globulin were greatest on week 1 and then began to decrease, in agreement with other studies (Mohri et al., Reference Mohri, Sharifi and Eidi2007). The decrease in creatinine, total protein and globulin with age, is consistent with previous findings; however, the aim of the aforementioned study was to profile temporal changes in calf metabolites and the specific nutritional management of the calves was not reported. Holstein-Friesian calves on a low plane of nutrition had the greatest concentrations of globulin and total protein. Similar results were found when calves were compared on limited or unlimited milk (Hammon et al., Reference Hammon, Schiessler, Nussbaum and Blum2002). One could have expected systemic concentrations of these metabolites to increase with plane of nutrition in the current study; however, a greater passage rate reduces time for digestion and therefore offering calves a high plane of nutrition may lead to a reduction in protein digestion (Kennedy and Murphy, Reference Kennedy and Murphy1988) leading to lower concentrations of total protein found in plasma. Concentrations of creatinine were unaffected by plane of nutrition in both F and J calves, in contrast to the findings of Williams et al. (Reference Williams, Pagliani, Innes, Pennie, Harris and Garthwaite1987) where creatinine concentrations were greater in heavier calves with a larger total muscle mass.
The lack of a dietary effect on urea concentrations was unexpected as a recent study with calves (Berends et al., Reference Berends, van den Borne, Rojen, van Baal and Gerrits2014) showed that increased starter intake led to greater nitrogen retention. In the current study, calves on a low plane of nutrition, irrespective of breed, had increased concentrate intake so it could be expected that they should have had a greater urea concentration. The trend towards lower concentrations of urea with advancing age observed here is unusual as concentrate consumption of the calves increased as they approached weaning (Supplementary Figure S1). It is also likely, however, that due to the restriction imposed on the concentrate intake of both low and medium plane of nutrition calves, this limited their overall feed intake potential and consequently systemic urea concentrations, certainly in the immediate pre-weaning phase.
The effect of plane of nutrition on systemic concentrations of triglyceride is not well documented for calves. In contrast to the findings of the current study, Khan et al. (Reference Khan, Weary and von Keyserlingk2007) found no relationship between age and concentrations of triglycerides in calves. Given that triglycerides are typically mobilised in response to negative energy balance derived lipolysis (Van Soest, Reference Van Soest1982), the result of the current study was unusual as J calves on a medium plane of nutrition tended to have greater triglyceride concentrations than calves on a low plane, whereas J calves tended to have greater triglycerides on a high v. a low plane of nutrition. In addition, F calves offered a high plane of nutrition tended to have greater triglycerides than calves offered a low plane of nutrition; however, concentrations observed were within the normal published range, such that treatment differences are unlikely to be of biological significance.
Conclusion
In conclusion, there was no evidence of a significant improvement in pre-weaning performance of either breed when offered a high compared with a moderate amount of MR. Although total net energy intake was increased, calves on a high plane of nutrition consumed less concentrate and had lower overall feed efficiency. Based on the concentrate intake and performance of calves across the two breeds and three planes of nutrition employed here, a moderate plane of nutrition would be recommended for both breeds to ensure optimum calf performance up to weaning and a smooth transition between milk and solid feed intake.
Acknowledgement
The authors gratefully acknowledge support from the Department of Agriculture, Food and the Marine under the Research Stimulus Fund (Project 11/S/116).
Supplementary materials
To view supplementary material for this article, please visit https:/doi.org/10.1017/S1751731117000350