Introduction
Early embryonic development in most vertebrate and invertebrate species is characterized by a period of transcriptional silence. In mouse, gene transcription resumes during the latter part of the 1-cell stage (Ram & Schultz, Reference Ram and Schultz1993; Bouniol et al., Reference Bouniol, Nguyen and Debey1995; Aoki et al., Reference Aoki, Worrad and Schultz1997; Schultz, Reference Schultz2002). The transition from a transcriptionally silent state to an active state is marked by zygotic genome activation (ZGA). Molecular mechanisms responsible for embryonic transcriptional silence and for ZGA are currently unknown. It has been proposed that the presence of transcription inhibitors causes transcriptional silence in the cell (Newport & Kirschner, Reference Newport and Kirschner1982a, Reference Newport and Kirschnerb), although there is evidence that suggests additional mechanisms are also present.
It has been observed in Xenopus laevis that TATA box binding protein (TBP) was barely detectable in both oocytes and early cleavage embryos during the time when transcription of the genome was also undetectable. The relative abundance of nuclear TBP increases robustly by the middle blastula transition before ZGA (Veenstra et al., Reference Veenstra, Destree and Wolffe1999). In mouse, the nuclear content of TBP diminishes to the lowest detectable level in both parental nuclei shortly after fertilization, and recovers to a relatively high level before ZGA (Aoki et al., Reference Aoki, Worrad and Schultz1997). These observations have led to the hypothesis that deficiency in general transcription factors at the outset of development may also be a factor contributing to embryonic transcriptional silence (Worrad et al., Reference Worrad, Ram and Schultz1994).
Protein-coding genes are transcribed by RNA polymerase II. Promoters of polymerase II genes are categorized as either TATA-box-containing or TATA-less. For TATA-box-containing promoters, TBP binds to a TATA box and nucleates the formation of a pre-initiation complex. For TATA-less promoters, some TBP-associated factors (TAFIIs) function to recruit transcription factor IID (TFIID) to promoters and participate in the promoter recognition surface of TFIID complex (Hampsey, Reference Hampsey1998; Apone & Green, Reference Apone and Green1997; Bell & Tora, Reference Bell and Tora1999).
TBP associated factor 1 (TAF1) (Tora, Reference Tora2002) is the largest subunit of the general transcription factor TFIID (Burley & Roeder, Reference Burley and Roeder1996). It is a multi-functional protein that contributes to gene regulation through mediating promoter recognition and by catalysing modifications of the chromatin and other transcription factors. TAF1 directly contacts core promoter initiator elements, binds activators to recruit TFIID to particular promoters, regulates binding of TBP to DNA, and has four distinct enzymatic activities that modify histones and general transcription factors. TAF1 is likely to contribute to the initial steps of RNA polymerase II transcription for a large set of genes (Wassarman & Sauer, Reference Wassarman and Sauer2001).
In this study we examined expression of TAF1 in 1-cell mouse embryos and found that temporal expression of TAF1 is strictly regulated at the outset of development. With an immunofluorescence assay, TAF1 was not detected after fertilization at a time when transcriptional activity was also undetectable. Expression appeared in pronuclei and reached a significantly high level before ZGA. The dynamic expression pattern of TAF1 was similar to that of TBP. These results indicate that besides TBP, some critical member of the TAF family is also missing or at extremely low level in pronuclei, lending support to the hypothesis that deficiency in transcription machinery may be a feature limiting transcription at the beginning of development, and that recovery of these general transcription factors in the pronuclei may also contribute to ZGA.
Materials and methods
Fertilization in vitro
Mice of the Kunming white strain were obtained from the Center for Experimental Animals (Chinese Academy of Sciences, Shanghai) and were used throughout the study. Sperm was collected from 14- to 24-week-old male mice. Metaphase II-arrested eggs were collected from superovulated female mice 13–14 h after injection of hCG. In vitro fertilization was performed as previously described (http://www.jax.org/cryo/ivf.html).
Classification of 1-cell embryos
In this study, 1-cell mouse embryos were staged using both the function of post-fertilization (P.F.) time and the pronuclear nomenclature that classifies embryos by the size, shape and positioning of their pronuclei (PNs) (Adenot et al., Reference Adenot, Mercier, Renard and Thompson1997; Santos et al., Reference Santos, Hendrich, Reik and Dean2002). Embryos at pronuclear stage 3 (PN3) and 4 (PN4) were collected at multiple time points and labelled accordingly (see Results).
Detection of TAF1 protein
TAF1 protein was detected by an anti-TAF1 specific polyclonal antibody (Santa Cruz Biotechnology, CA) using a modified protocol previously described (Jordan et al., Reference Jordan, Mannervik, Tora and Carmo-Fonseca1996). Embryos were collected, and washed in physiological buffer (PB) that consisted of 100 mM KAC, 30 mM KCl, 1 mM MgCl2, 10 mM Na2HPO4, and 1 mM ATP supplemented with 1 mM dithiothreitol. Cells were permeabilized in 0.2% Triton X-100 in PB for 10 min on ice, fixed for 1 h with 3.7% paraformaldehyde in PB at room temperature, and washed five times with PBS containing 4 mg/ml bovine serum albumin (PBS/BSA). Embryos were then incubated with 0.4 mg/ml anti-TAF1 antibody in BSA/PBS overnight at 4 °C, washed in four drops of PBS/BSA over 15 min and incubated with 0.5 mg/ml anti-goat IgG antibody conjugated with Cy3 (Jackson ImmunoResearch, West Grove, PA) for 60 min at room temperature. The samples were again washed with PBS/BSA, counterstained for 20 min with YOYO-I (Molecular Probes) and mounted on glass slides in DABCO mounting solution (Sigma).
Fluorescence was detected using a laser-scanning confocal microscope (Fluoview 500, Olympus) and the signal was quantified as previously described (Worrad et al., Reference Worrad, Ram and Schultz1994). Briefly, the pixel value per unit area was measured from five different regions of the nucleus and five different regions of the cytoplasm, and the average cytoplasmic fluorescence value was subtracted from the average nucleoplasm value. This value was then multiplied by the pronuclear volume to yield the total amount of fluorescence. In each experiment, the fluorescence value of PN5 embryos was set at 100% and values obtained at other pronuclear stages were expressed as percentages relative to this value.
BrUTP incorporation
In vitro transcriptional activity assay was conducted as described by Aoki et al. (Reference Aoki, Worrad and Schultz1997). All treatments were performed at room temperature unless otherwise specified. Embryos were washed in a drop of PB supplemented with 1 mM dithiothreitol, 0.2 mM phenylmethylsulfonyl fluoride and 50 units/ml of RNase inhibitor (Promega, Madison, WI). The plasma membrane was permeabilized by treating embryos in 0.05% Triton X-100 in PB for 1 min. Embryos were washed three times in PB, and incubated at 33 °C for 30 min in a solution containing 100 mM potassium acetate, 1 mM MnCl2, 50 mM (NH4)2 PO4, 30 mM KCl, 10 mM Na2HPO4, 2 mM ATP, 0.4 mM GTP, 0.4 mM CTP, 0.4 mM BrUTP and 1 mM MgCl2. The nuclear membrane of the embryos was permeabilized by 0.2% Triton X-100 in PB for 3 min. Embryos were again washed in PB, and fixed for 1 h in 3.7% paraformaldehyde in PB. The incorporated BrUTP was then detected by indirect immunostaining with a mouse anti-BrdU antibody and a goat anti-mouse IgG conjugated with Cy3 as follows: embryos were washed five times in PBS/BSA for 15 min, incubated for 60 min in PBS containing 2 mg/ml anti-BrdU monoclonal antibody (Boehringer Mannheim, Indianapolis, IN), washed four times in PBS/BSA for 15 min, incubated for 60 min in PBS/BSA containing 0.5 mg/ml goat anti-mouse IgG conjugated with Cy3 (Jackson Immuno Research, West Grove, PA), washed again in PBS/BSA, stained for 20 min with YOYO-I (Molecular Probes) and mounted on glass slides in DABCO mounting solution (Sigma).
Detection of TBP
TBP was detected by a rabbit anti-TBP polyclonal antibody (Santa Cruz Biotechnology, CA) which recognizes the amino-terminal domain of TBP. Embryos were collected and fixed for 1 h in 3.7% paraformaldehyde, washed three times in PBS/BSA, permeabilized in 0.5% Triton-X/PBS for 10 min, washed briefly in PBS and incubated in 0.4 mg/ml rabbit anti-TBP antibody in PBS for 2 h at room temperature. Embryos were again washed in PBS/BSA for 15 min, and incubated with 0.5 mg/ml goat anti-rabbit IgG conjugated with Cy3 (Jackson ImmunoResearch, West Grove, PA) in PBS for 60 min at room temperature. Embryos were then stained for 20 min with YOYO-I (Molecular Probes) and mounted on glass slides in DABCO mounting solution (Sigma) (Kim et al., Reference Kim, Ogura, Nagata and Aoki2002).
Results
TAF1 first appeared in 1-cell embryos 6 h post-fertilization
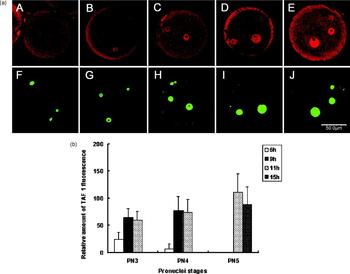
TAF1 in 1-cell embryos was detected by a polyclonal antibody. With a fluorescence-coupled secondary antibody, developmental changes in the amount of TAF1 in 1-cell embryos were quantified using a previously established method (see Materials and Methods). While no signal was observed in embryos of PN1 or PN2 stages at 4 h P.F., TAF1-specific signals were detected in a proportion of PN3 (16/81) and PN4 (1/15) embryos 6 h P.F. At 9 h P.F. the majority of PN3 (79/87) and PN4 (13/14) embryos were positive for TAF1. At 11 h P.F. TAF1 was detected in almost all embryos at PN3 (16/17), PN4 (71/71) and PN5 (4/4) stages (Fig. 1a). These results indicate that at the outset of development TAF1, if present in the nuclei at all, is at a level below detection by the conventional immunofluorescence assay used. The expression of TAF1 becomes readily detectable in pronuclei at 6 h P.F. after embryos have entered the PN3 stage. Quantitative analysis showed that the amount of TAF1 in pronuclei increased between 6 and 9 h P.F., reaching a significantly high level before zygotic transcriptional activation (Fig. 1b). Since zygotic transcription does not begin before 9 h P. F. (see below), TAF1 protein detected in the early stages of 1-cell embryos must come from translation of maternal mRNA.
TAF1 expression in 1-cell mouse embryos. (a) Laser-scanning confocal micrographs of TAF1 expression in embryos at various post-fertilization times. Upper panels: immunofluorescent staining (red) with a TAF1-specific antibody. Lower panels: YOYO-1 staining (green) showing pronuclei and polar bodies. Embryos collected at 4 h (PN2: A, F), 6 h (PN3: B, G), 9 h (PN3: C, H), 11 h (PN4: D, I) and 15 h (PN5: E, J) post-fertilization were processed for antibody and YOYO-1 staining. The position of pronuclei may be changed by the staining procedure, especially for these embryos at later pronuclear stages. Therefore, the distance between the male and female pronuclei shown in the figure may not represent the distance seen under the light microscope before immunostaining. Scale bar represents 50 μm. (b) Quantitative analysis of TAF1 expression in 1-cell embryos. TAF1-specific signals in pronuclei were collected using a laser scanning microscope. Signals from PN5 embryos were assigned a value of 100% to calculate the relative amount of TAF1 in embryos at earlier stages. Each column represents the mean ± SEM of value from three independent experiments. At each pronuclear stage 10–18 embryos were examined. The time when the group of embryos was collected is indicated by the colour code shown in the upper right-hand corner of the figure.

TBP first appeared in 1-cell embryos approximately 2 h before TAF1
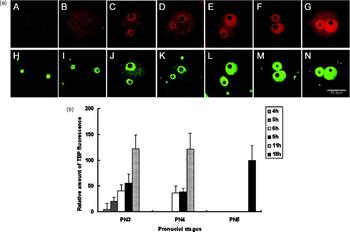
The expression pattern of TAF1 was compared with that of TBP in parallel experiments. TBP was not detected in PN1 embryos. The expression of TBP was first seen at 4 h P.F. in a small proportion of PN2 (4/68) and PN3 (3/7) embryos. However, 1 h later, TBP became readily detected in all embryos at the PN3 stage (18/18), and maintained positive expression in all embryos from PN3 to PN5 stages collected at 6, 9, 11 and 15 h P.F. (n = 316) (Fig. 2a). Quantitative analysis revealed that the amount of TBP in pronuclei increased steadily from 4 h P.F. throughout all time points studied and reached a plateau at 11 h P.F. (Fig. 2b).
TBP expression in 1-cell mouse embryos. (a) Laser-scanning micrographs TBP expression in 1-cell mouse embryos. Upper panels: immunofluorescent staining (red) with a TBP-specific antibody. Lower panels: YOYO-1 staining (green) showing pronuclei and polar bodies. Embryos collected at 4 h (PN1: A, H; PN2: B, I), 5 h (PN3: C, J), 6 h (PN3: D, K), 9 h (PN3: E, L), 11 h (PN4: F, M) and 15 h (PN5: G, N) post-fertilization were processed for antibody staining (see Materials and Methods). Scale bar represents 50 μm. (b) Quantitative analysis of TBP expression. TBP-specific signals in pronuclei of 1-cell embryos were collected as described in previous figures and analysed using signals from PN5 embryos at a value of 100% to calculate the relative amount of TBP in embryos at earlier stages. Each column represents the mean ± SEM of value from three independent experiments. At each pronuclear stage 7–18 embryos were examined. The time when the group of embryos was collected is indicated by the colour code.

Zygotic transcription begins at approximately 9–11 h post-fertilization
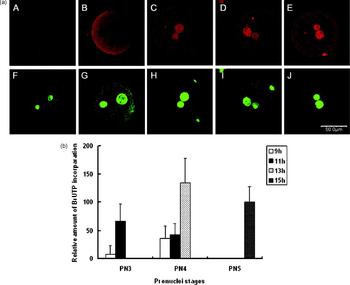
It was previously determined using a BrUTP incorporation assay that initiation of zygotic transcription starts by mid-S phase in in vivo fertilized embryos, approximately by 10 h post-insemination (Aoki et al., Reference Aoki, Worrad and Schultz1997). In order to analyse relationships between transcription activation and pronuclear content of TAF1 and TBP, we performed the same assay in in vitro fertilized embryos. A total of 349 embryos in seven experiments were examined for transcriptional activity in nuclei. In groups collected at 4 h P.F., which contain mostly PN1 and PN2 embryos, we detected no signal of BrUTP incorporation (0/10). In PN3 embryos collected 6 h P.F., BrUTP incorporation remained negative (0/35). BrUTP signal was first detected in the pronuclei of a small proportion of PN3 (7/76) and PN4 (4/17) embryos collected 9 h P.F. A majority of the embryos collected 11 h P.F. showed readily detectable signal (106/123) (Fig. 3a, b). Thus, our results indicate that the time of ZGA varies among 1-cell embryos and occurs in most embryos between 9 and 11 h P.F. These data are consistent with results from in vivo fertilization experiments (Aoki et al., Reference Aoki, Worrad and Schultz1997).
Transcription activity in 1-cell mouse embryos. (a) BrUTP incorporation by 1-cell mouse embryos of at various post-fertilization times. Upper panels: BrUTP incorporation highlighted by an anti-BrUTP specific antibody coupled to fluorescence (red). Lower panels: YOYO-1 staining (green) showing pronuclei and polar bodies. Embryos collected at 6 h (PN3: A, F), 9 h (PN3: B, G), 11 h (PN4: C, H), 13 h (PN4: D, I) and 15 h (PN5: E, J) post-fertilization were processed for BrUTP assay (see Materials and Methods). Scale bar represents 50 μm. (b) Quantitative analysis of BrUTP incorporation. The signal of BrUTP incorporation in the 1-cell embryo was collected using a laser scanning microscope. The extent of incorporation by PN5 embryos was set as 100%. Each column represents the summary of three independent experiments (mean ± SEM). At each pronuclear stage 6–29 embryos were examined.

Expression of TAF1 and TBP, as well as transcription, begins earlier in the male than in the female pronucleus
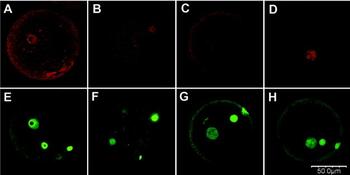
In a substantial population of PN3 embryos at 6 h and 9 h P.F., TAF1 was seen in the male pronucleus but not in the female pronucleus (male PN+: both PN+ = 12:70, Fig. 4A, E). In embryos positive for the factor, TAF1 was never seen to be expressed in the female pronucleus only. In the PN4 stage was TAF1 expressed in both pronuclei. Similar to TAF1, embryos with TBP expressed only in the male pronucleus were seen in the PN2 stage (Fig. 4B, F) but not in the PN3 stage. These results implied that both TAF1 and TBP were expressed in the male pronuclei earlier than the female nuclei.
Expression of TAF1 and TBP, as well as ZGA, begins earlier in the male pronucleus. Upper panels: immunofluorescent staining (red) with antibodies to TAF1 (A), TBP (B) and BrUTP (C, D). Lower panels: YOYO-1 staining (green) showing pronuclei and polar bodies. Embryos collected at 4 h (PN2: B, F), 9 h (PN3: A, E), and 11 h (PN3 and PN4: C, D, G, H) post-fertilization were processed for antibody staining (see Materials and Methods). Scale bar represents 50 μm.

In parallel to transcription factors, it was also observed that at the initial stage of transcription activation, approximately 9 to 11 h P.F., signals of BrUTP were seen only in the male pronucleus and not in the female pronucleus in a proportion of embryos (Fig. 4) (male PN+: both PN+ = 13:34 for the PN3 embryos and 12:45 for the PN4 embryos), suggesting an earlier transcription activation in the male pronucleus.
Discussion
When the data from these experiments were analysed collectively, several points emerged. At the very beginning of development, some general transcription factors such as TBP (Aoki et al., Reference Aoki, Worrad and Schultz1997; Veenstra et al., Reference Veenstra, Destree and Wolffe1999) and TAF1, if present, are at extremely low levels. Deficiency of these transcription factors in pronuclei is temporally correlated with embryonic transcriptional silence. TBP and TAF1 first appear in 1-cell embryos at 4 h and 6 h P.F., respectively, and their amount increases steadily to reach significant levels before ZGA.
Transcription activity began in 1-cell embryos at around 9 h P.F., reached peak at 13 h P.F. and plateaued at 15 h P.F. ZGA occurs in the male pronucleus earlier than in the female pronucleus. In parallel to ZGA, TAF1 and TBP were expressed in the male pronucleus earlier than in the female pronucleus The earlier expression of TAF1 and TBP in male pronuclei may be correlated to the earlier ZGA in the male pronucleus.
In PN5 embryos collected 15 h P.F. ZGA had already occurred, implying that at this time the amount of general transcription factors had reached levels sufficient to support genome-wide transcription. Quantitative analysis using values of PN5 embryos as 100%, we saw that at 11 h the nuclear content of TAF1 reached 59.66% in PN3, 74.29% in PN4 and 111.27% in PN5 embryos (Fig. 1b), and TBP reached 122.17% in PN3 and 121.60% in PN4 embryos (Fig. 2b), respectively. These data show that the nuclear contents of TAF1 and TBP reached peaks 2 h before the peak of transcription activity (Figs. 1b, 2b). At 2 h before ZGA, nuclear contents of TAF1 and TBP had already reached levels either more than 50% of or comparable to that in the post-ZGA stage (15 h P.F.; Figs. 1b, 2b). Taken together, our results show that general transcription factors, such as TAF1 and TBP, are deficient in the early stages of 1-cell embryos. The increase in nuclear content of these transcription factors is positively correlated with the transcription activity in 1-cell embryos.
Both TBP and TAF1 play critical roles in transcription. TBP is essential for transcription by RNA polymerase I and III (Wassarman & Sauer, Reference Wassarman and Sauer2001) and for transcription from TATA-box-containing promoters by RNA polymerase II (Wassarman & Sauer, Reference Wassarman and Sauer2001). A recent study in yeast indicates that the recruitment of TBP to promoters is of universal importance in determining gene expression level, regardless the nature of the core promoter (Kim & Iyer, Reference Kim and Iyer2004). Data from Caenorhabditis elegans show that TAF1 is also required for transcription of a large set of genes. RNA interference with TAF1 caused a broad zygotic transcriptional defect leading to arrest in embryonic development and differentiation (Walker et al., Reference Walker, Shi and Blackwell2004). Combined deficiency in critical members of the general transcriptional machinery such as TBP and TAF1 could potentially count for embryonic transcriptional silence, although more evidence is needed to show that this deficiency is directly responsible for transcriptional silence.
Acknowledgement
We thank Zhi Qiang Wang for excellent technical assistance. We also thank Tian Long Gao for his support in confocal microscopic analysis, Ailian Liu for her assistance in editing and figure processing, Yong Lu and Qian Wang for literature collection, and Feng Ying Li for her assistance in maintaining the mouse colony. This work was supported by grants from the Projects of Development Plan of the State Key Fundamental Research of China (2001CB509903), the National High Technology Research and Development Project of China (2001AA216121), and Science and Technology Commission of Shanghai Municipality (01DJ14003), Chinese Academy of Sciences (No: KSCX-2-3-08), and Shanghai Municipal Education Commission.