INTRODUCTION
Cumacean crustaceans may play a key role in the trophic chain of benthic ecosystems. Their swimming capacity and their daily rhythmic migratory activity led them to be either close to the bottom or burrow into the sediment (Zimmer, Reference Zimmer1933; Hale, Reference Hale1943) during the day, and more widespread in the water column during the night (Anger & Valentin, Reference Anger and Valentin1976; Macquart-Moulin, Reference Macquart-Moulin1991). They have been reported as a relevant component of the diets of many fish (Mazzola et al., Reference Mazzola, Lopiano, Rosa and Sara1999; Olaso et al., Reference Olaso, Rauschert and De Broyer2000), crustaceans (Cartes, Reference Cartes1993) and even birds (Sutherland et al., Reference Sutherland, Shepherd and Elner2000). However, very few studies dealt specifically with their local ecology (e.g. Barnard & Given, Reference Barnard and Given1960; Corey, Reference Corey1970), in some cases including the list of environmental parameters but without trying to analyse the relationships with the cumacean distribution pattern (e.g. Gladfelter, Reference Gladfelter1975). Their role as biondicators in shallow waters (Corbera & Cardell, Reference Corbera and Cardell1995; Alfonso et al., Reference Alfonso, Bandera, López-González and García-Gómez1998), the relationships with seagrass meadows (Connolly, Reference Connolly1997) or their structure and function in continental shelf (Dos Santos & Pires-Vanin, Reference Dos Santos and Pires-Vanin1999) or deep (Cartes et al., Reference Cartes, Jaume and Madurell2003) waters are the most relevant topics reported to date, often as a part of major functional or faunistic groups (e.g. small, motile invertebrates or peracarid crustaceans).
Only one recent paper (Corbera et al., Reference Corbera, Tirado and Martin2005) deals specifically with the taxonomy of Persian Gulf cumaceans. Besides, the cumacean fauna from regions nearest to the Persian Gulf has also been seldom studied (Kurian, Reference Kurian1951, Reference Kurian1954; Bacescu & Muradian, Reference Bacescu and Muradian1975; Radhadevi & Kurian, Reference Radhadevi and Kurian1989; Mühlenhardt-Siegel, Reference Mühlenhardt-Siegel1996, Reference Mühlenhardt-Siegel2000). Moreover, the new species described in Corbera et al. (Reference Corbera, Tirado and Martin2005) are, up to now, only known from the type location. Therefore, our present data are pioneering in trying to explain the relationships between cumaceans and their surrounding sedimentary environment, particularly in shallow water tropical areas.
MATERIALS AND METHODS
Study site
The Persian Gulf is a shallow (36 m mean depth) semi-enclosed sea with a low water exchange rate (up to 5 years) (Sheppard, Reference Sheppard1993). Evaporation is much higher than freshwater inputs (i.e. precipitation and river inflow) and surface waters increase their density, sink to the bottom and move out of the Gulf through the deeper portion of the Strait of Hormuz. This generates a reverse estuary circulation, similar to the Mediterranean Sea (Reynolds, Reference Reynolds1993). The environmental conditions are often considered as extreme (Price et al., Reference Price, Sheppard and Roberts1993), with surface temperatures ranging from <15°C (winter, north coast) to 30°C (summer, Strait of Hormuz) and reaching more than 35°C at 30 m deep on the Iranian coasts. Salinity is always high, ranging from ≈37‰ (near the Strait of Hormuz) to ≈40‰ (due to evaporation when drifting along the Iranian coast), but reaching ≈50‰ or even ≈70‰ off the south and west coasts of the Gulf.
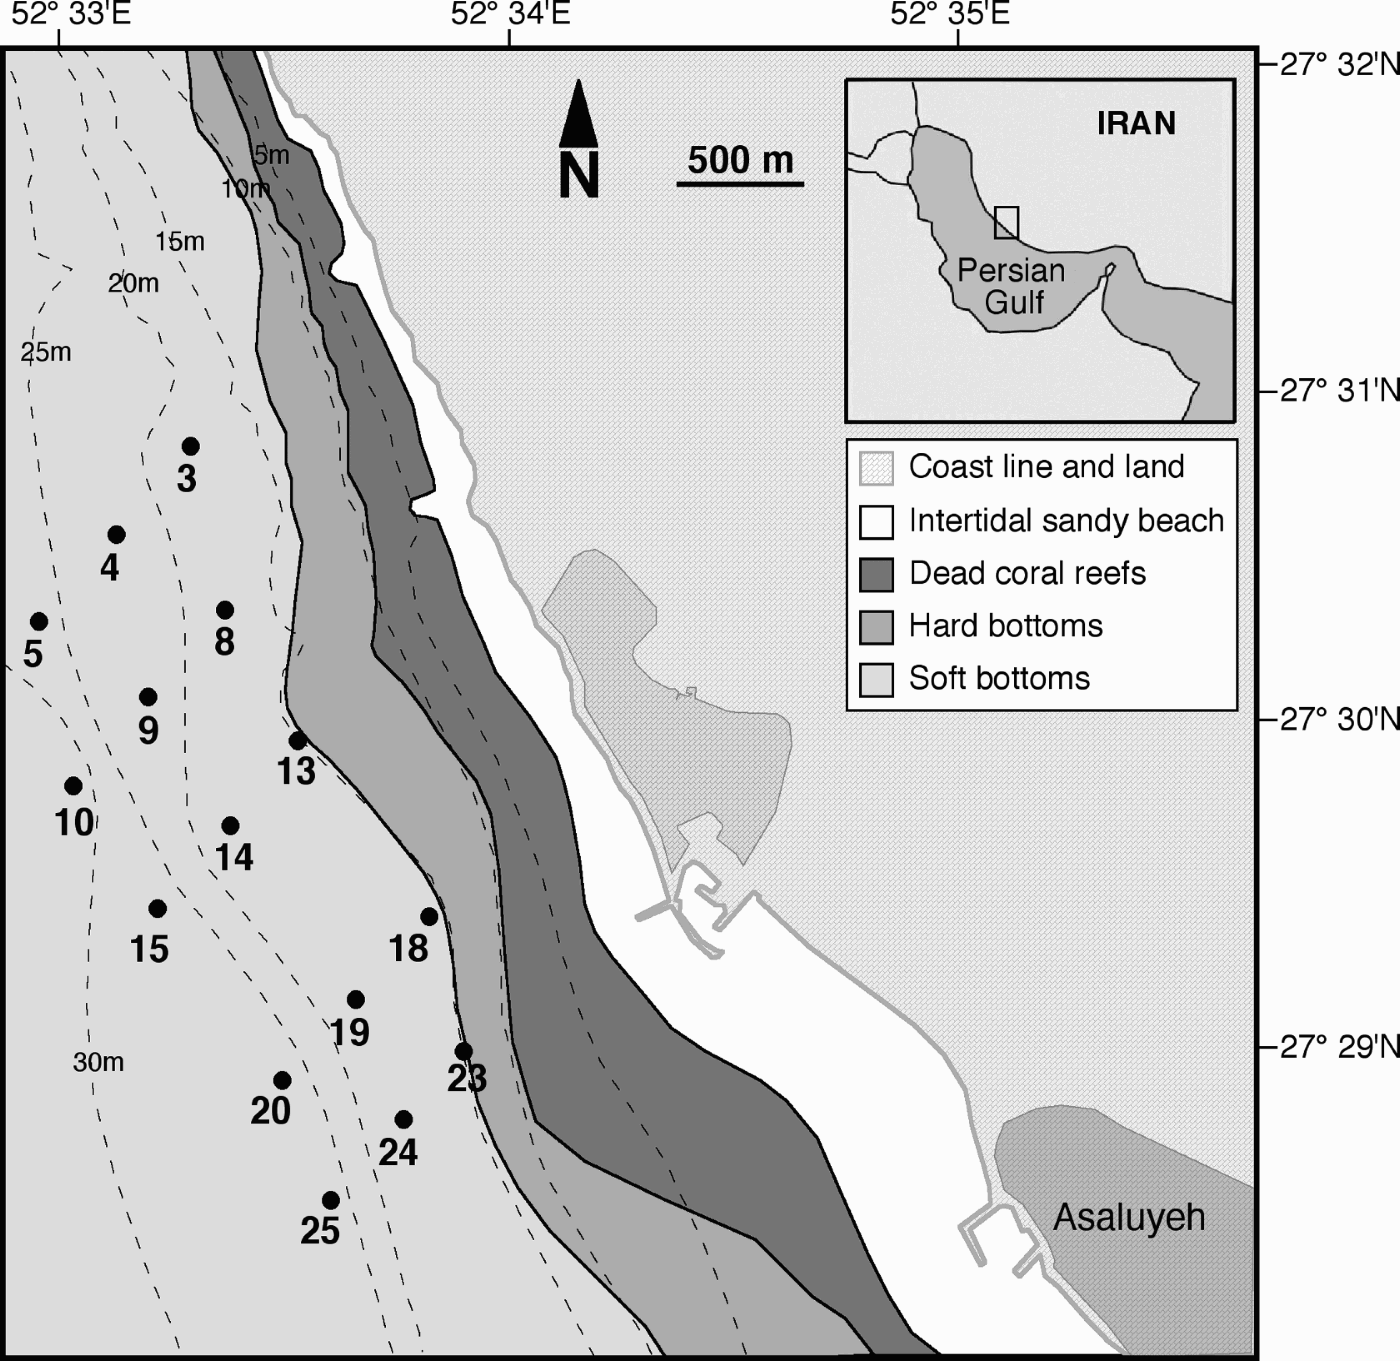
Samples were collected along the Iranian shoreline, at the east coast of the Persian Gulf near Assaluyeh (north Nay Band Bay, 250 km south of Bandar Bousher, 27°30′S 52°35′E). The seawater temperature and salinity near the bottom ranged from 35.5°C (1998) to 32.5°C (2002) and from 39.4‰ (1998) to 37.3‰ (2002), respectively. Suspended solids (in the water column) ranged from 2.5 mg l−1 at surface to 6.5 mg l−1 at the bottom in summer, when waters have also a very low oxygen concentration (Eric Dutrieux, personal observation). Continental waters run occasionally toward the north and the south from an outlet channel (opening between Stations 13 and 18), always tending to remain close to the shore so that they do not affect the area inhabited by the cumaceans.
Sampling design and statistical analyses
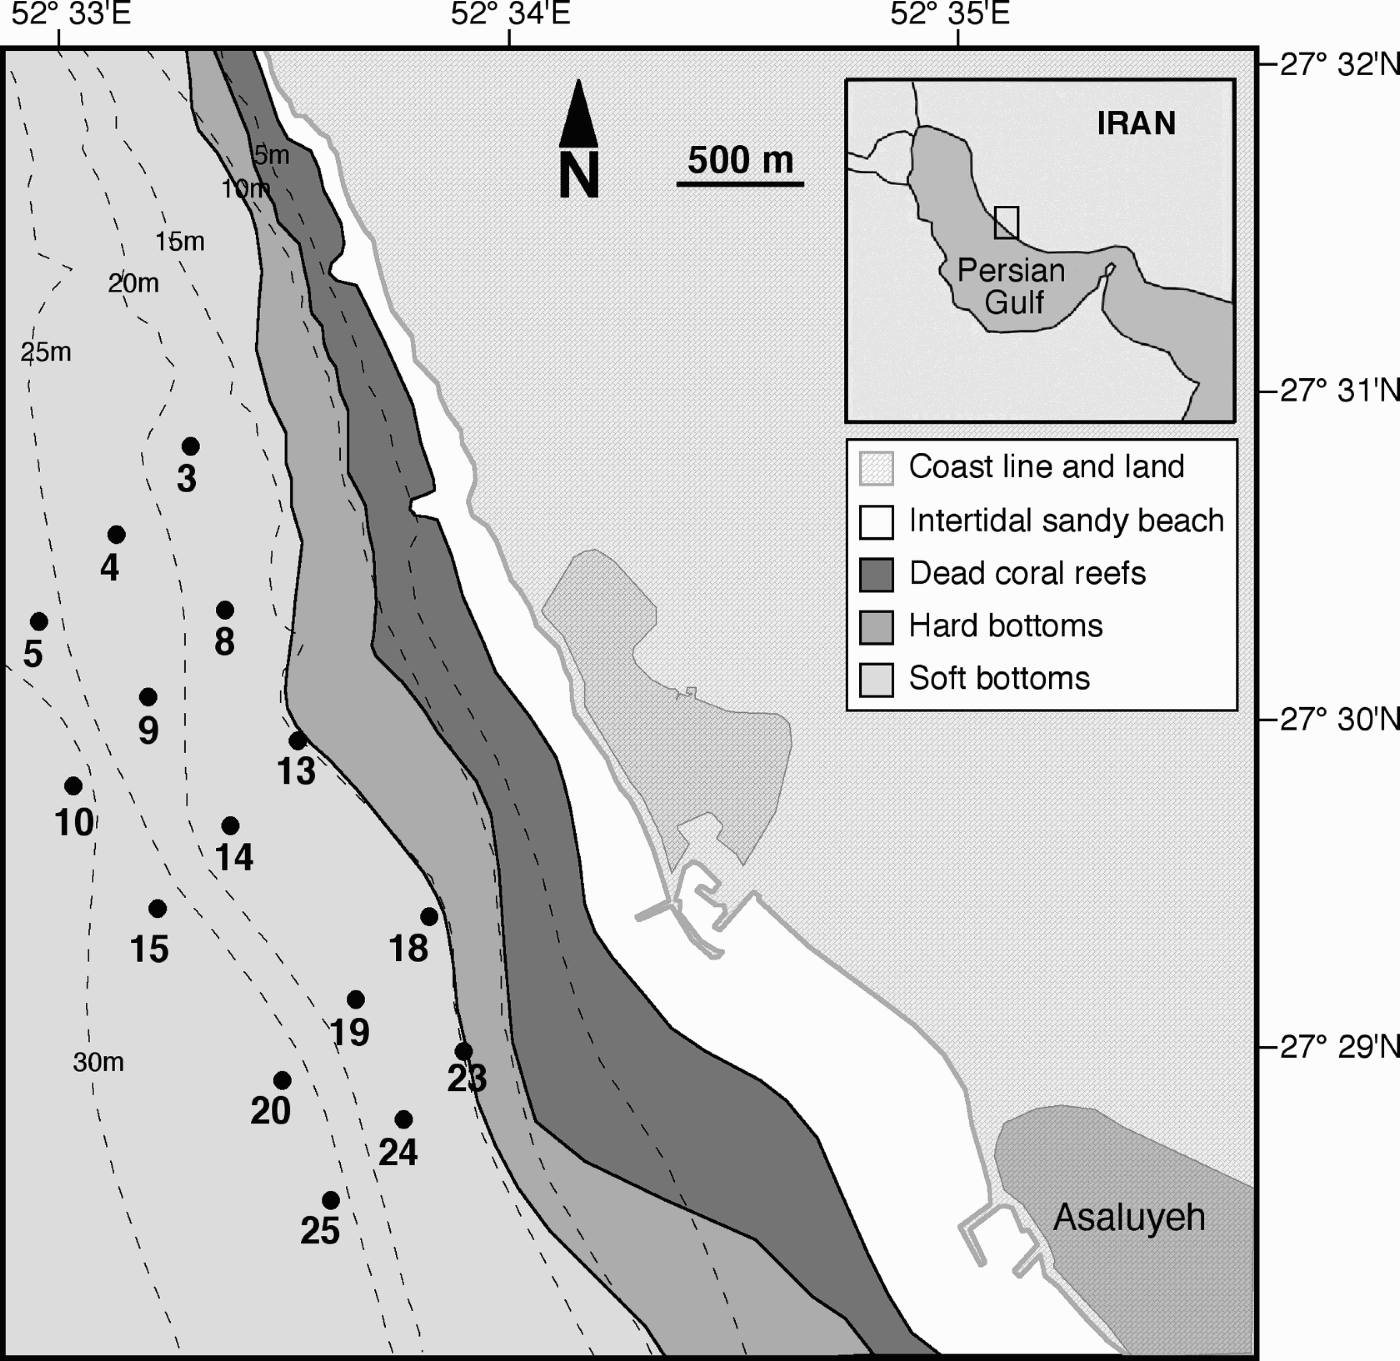
Five transects of 3 km long were positioned perpendicular to the coast from north–south along the shoreline (Figure 1). On each transect, 3 stations were distributed from the deepest margin of the coral reef belt to about 30 m in depth. Samples were collected in August 1998 and November 2002 using a Van Veen grab (35 × 42 × 90 cm, about 0.1 m2 per grab). At each station, 1l of sediment from one grab was used for physico-chemical analyses. Laser granulometry (% volume) was performed on dry sediment after sifting through a 0.8 mm mesh sieve using a Malvern Mastersizer S laser granulometer. Sediments were characterized by the percentage of silt and clay (diameter < 63 µm) and sand (0.2 mm < diameter < 2 mm) and the median grain diameter. Sediment water content (%) was measured according to the European experimental AFNOR standard X31–102. Concentration of total organic matter (% dry weight) was calculated by steam-drying at 105°C, according to the AFNOR standard NF U 44–160. Estimates of organic carbon have been made according to the European experimental standard NF ISO 14235 (oxidation method, 0.1% m/m).
Location of the study site and sampling design.
The density of cumaceans was estimated on the basis of a total sampling area of 0.3 m2 (i.e. three grabs). Grab contents were gently mixed in a container and then sieved out on board by pouring the contents through a 1 mm mesh sieve. The retained sediment was transferred to a plastic bag, fixed with a 4% formaldehyde/seawater solution, stained with rose Bengal and stored until sorted. After sorting, all specimens were preserved in 70% ethanol. Cumacean densities were expressed as number of individuals per m2.
The species per sample data matrix was analysed by MDS and ANOSIM routines (based on an standardized, square-root transformed data and an Euclidean distance similarity matrix) to assess the pattern of distribution using the PRIMER 6.1.6 (© Primer-E Ltd., 2006) software (Clarke & Gorley, Reference Clarke and Gorley2006).
The differences in the environmental variables and assemblage descriptors both between sampling periods and within the groups defined in the MDS were assessed by one-way analyses of variance (ANOVA). When required, the factors responsible for the significant effects were assessed by the Tukey honestly significant difference test (Tukey HSD). The relationships between environmental parameters and assemblage descriptors were assessed by Pearson correlation analysis. When required, data were transformed (log-transformed for the density and the organic matter, gravel and silt contents; rank transformed for the evenness, depth and organic carbon content) in order to meet the assumptions of normality and homoscedasticity (Zar, Reference Zar1984), as tested by the Kolmogorov–Smirnov and Bartlett tests, respectively. The analyses were performed by means of the XLSTAT software, version 2008.6.01 (© Addinsoft 1995–2008).
RESULTS
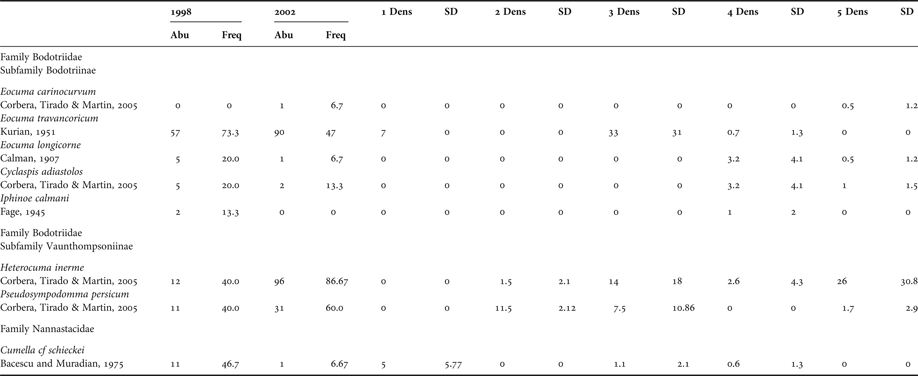
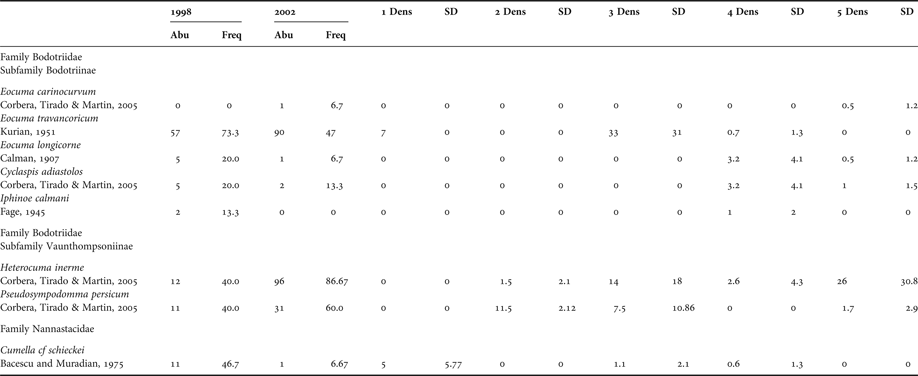
A total of 322 cumaceans belonging to 8 species were collected in Assaluyeh. The most abundant and frequent species were Eocuma travancoricum and Heterocuma inerme in 1998 and 2002, respectively (Table 1).
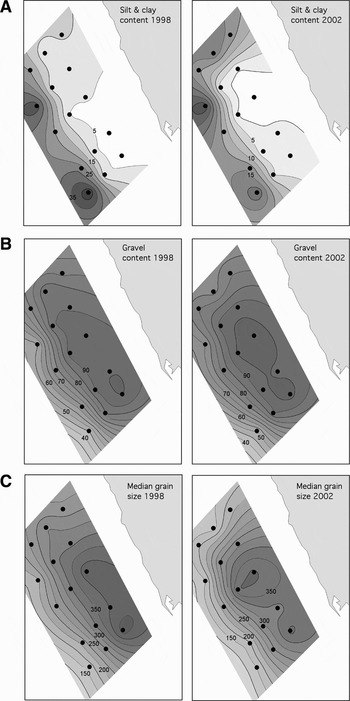
Sediment characteristics off Assaluyeh in 1998 and 2002. (A) Silt content (%); (B) gravel content (%); (C) median grain size (µm).

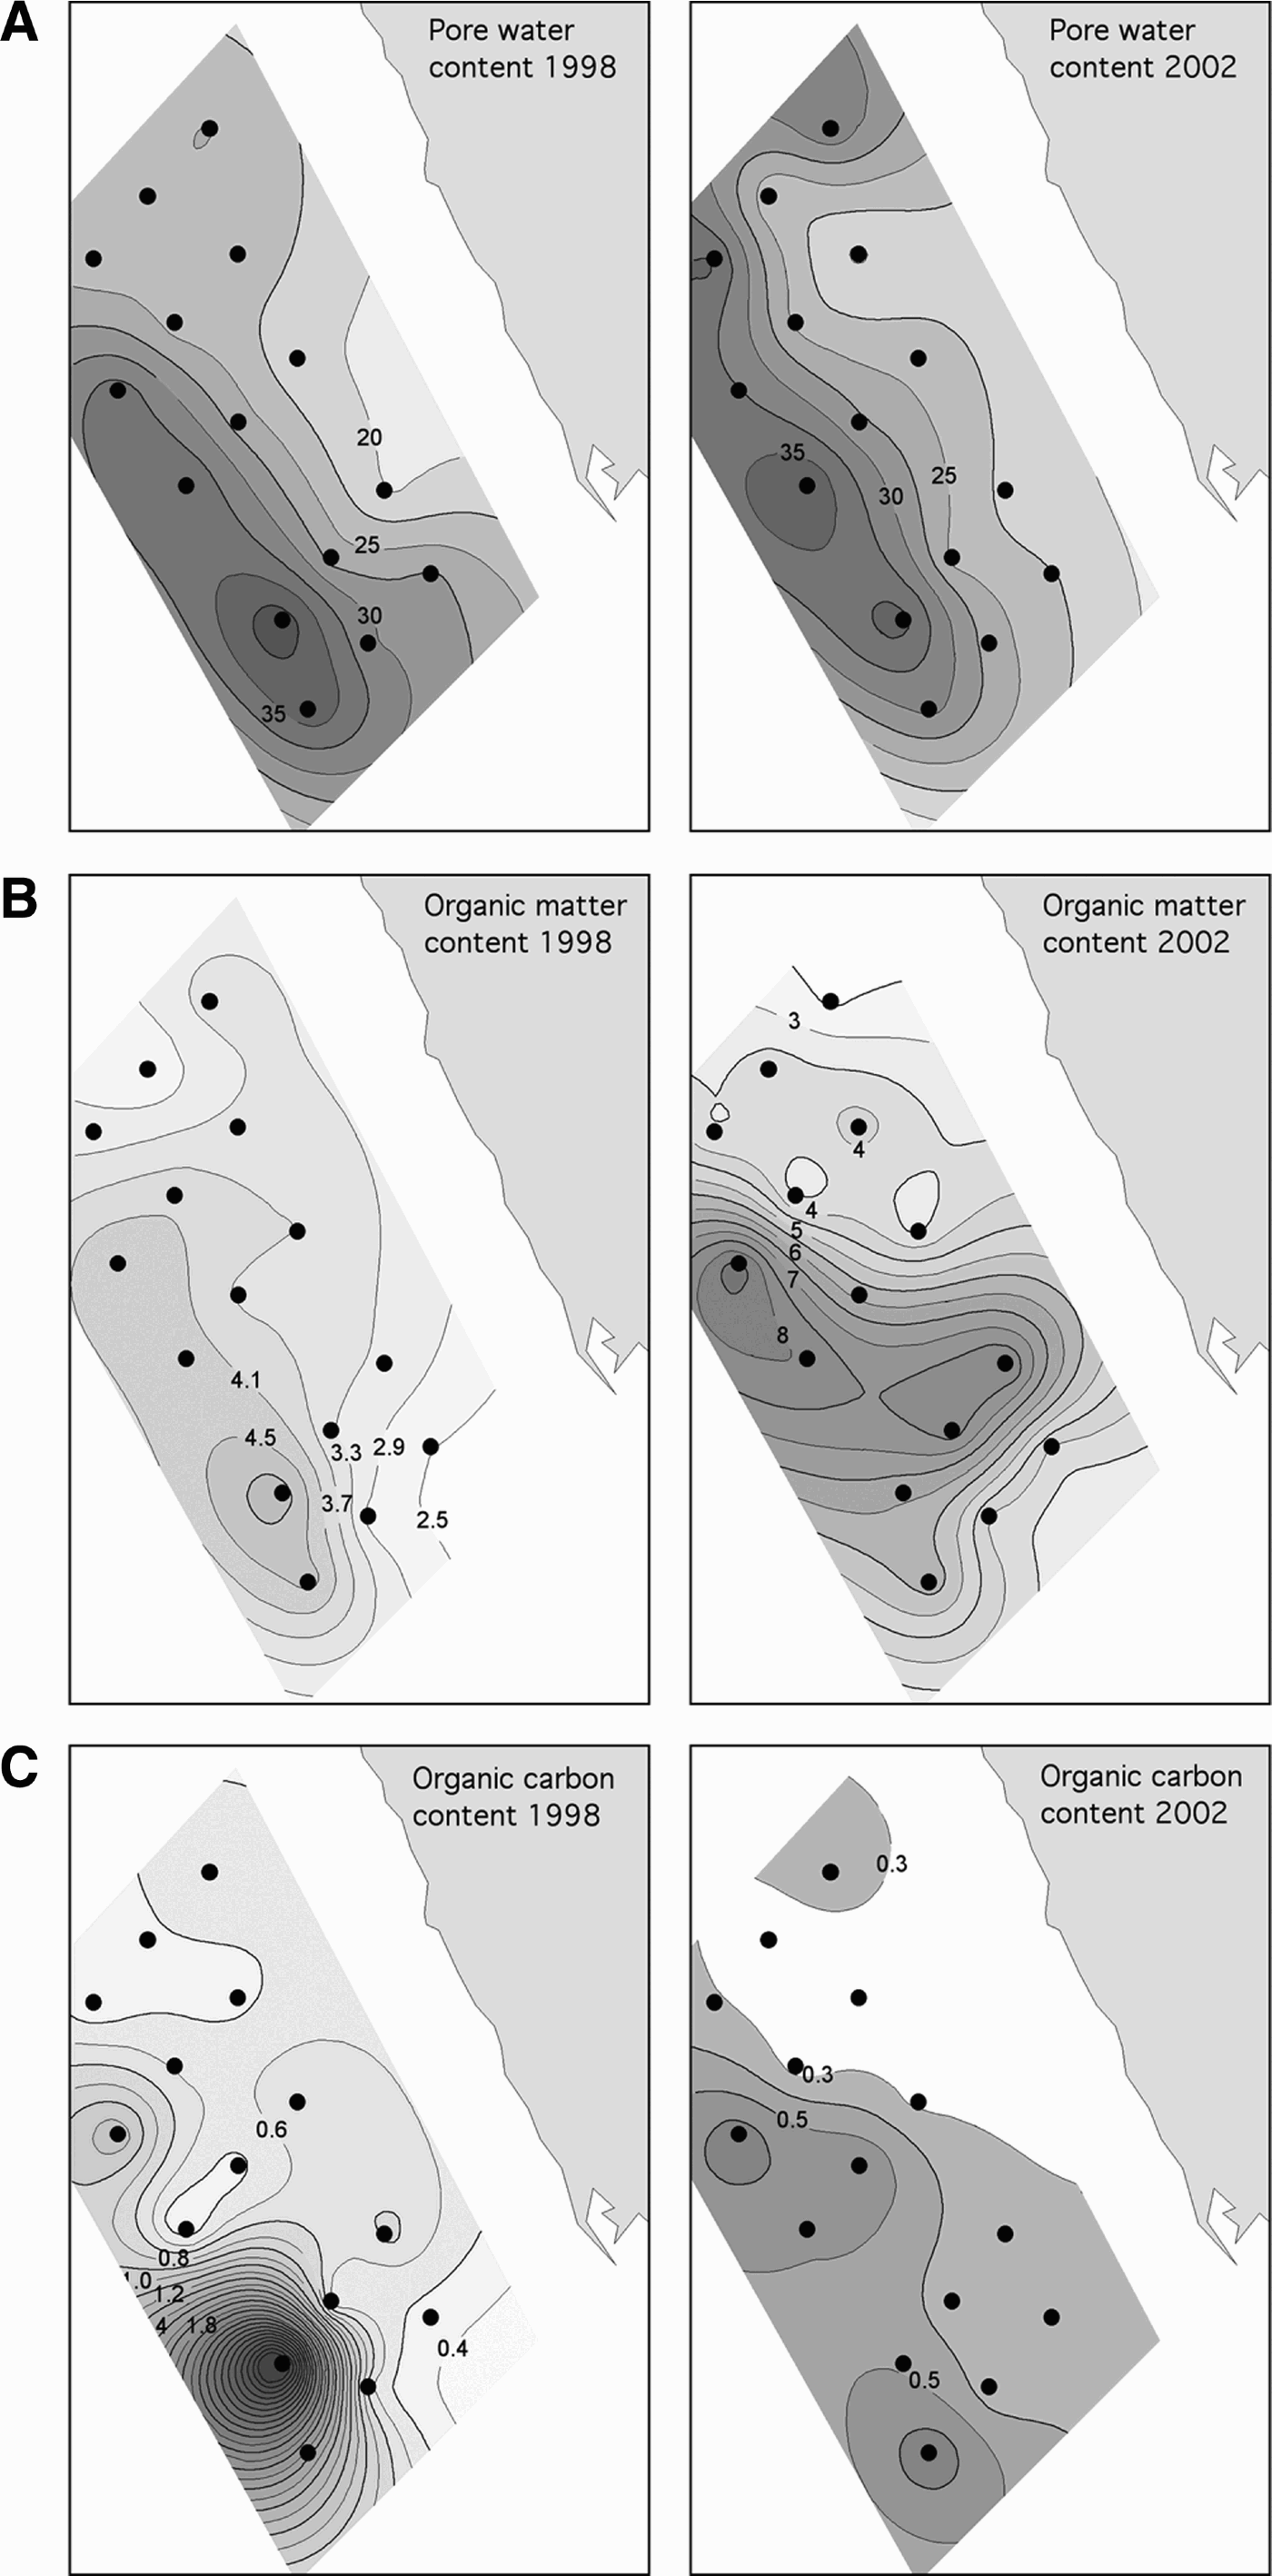
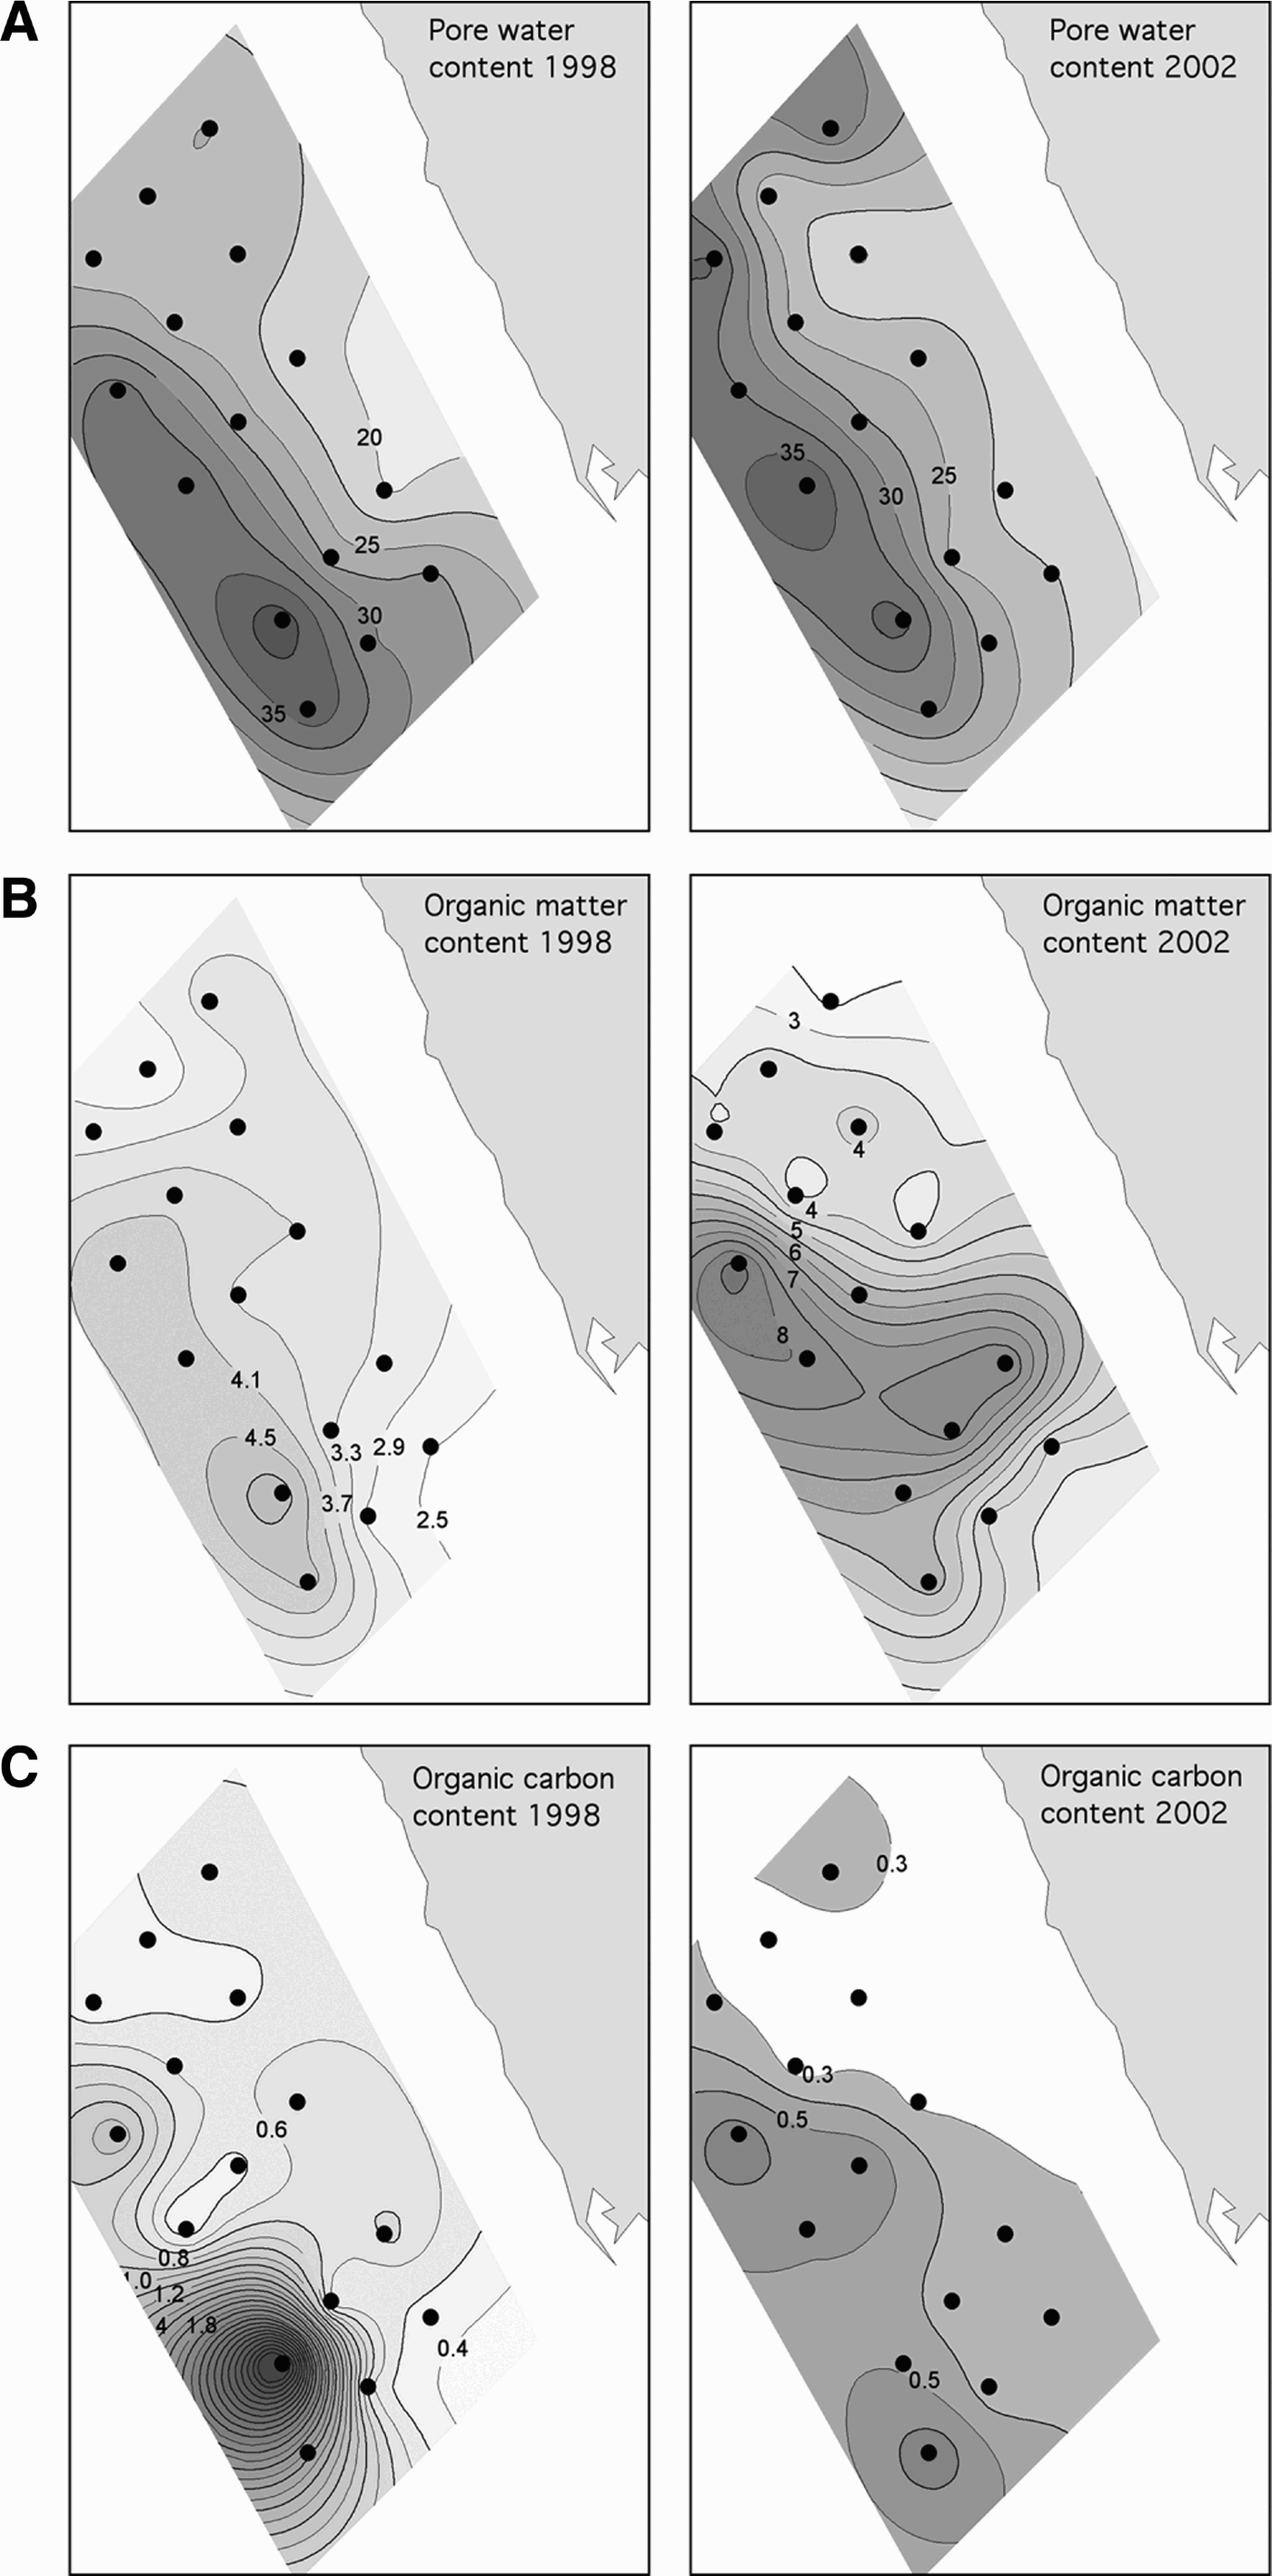
Sediment characteristics off Assaluyeh in 1998 and 2002. (A) Pore water content (%); (B) organic matter content (%); (C) organic carbon content (%).
Distribution patterns of the biological descriptors of the cumacean assemblages.

List of cumacean species found in Assaluyeh. 1998 and 2002: total averages; 1–5: groups obtained in the MDS (see Figure 6); Abu, total number of individuals; Freq, percentage of occurrence among samples; Dens, mean number of individuals per m−2; Avg, average; SD, standard deviation.
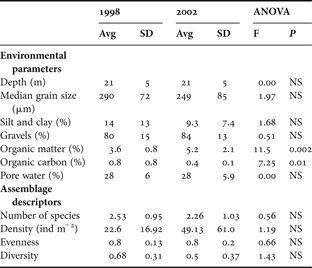
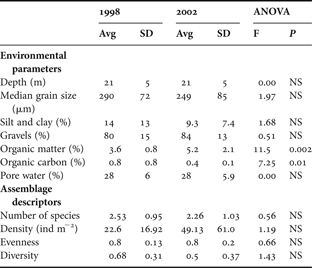
The environmental conditions were very similar during the two sampling periods (Figures 2, 3). The only significant differences consisted of the organic matter content being lower in 1998 than in 2002, and the organic carbon content being higher in 1998 than in 2002 (Table 2). Although there were almost twice more cumaceans in 2002 than in 1998, this difference was non-significant, as well as those between the number of species, evenness and diversity of the assemblages (Figure 4; Table 2).
Averages (Avg) and standard deviation (SD) of the environmental parameters and the descriptors of the cumacean assemblages in 1998 and 2002, including the results of the ANOVAs with the sampling year as a factor. NS, non significant.
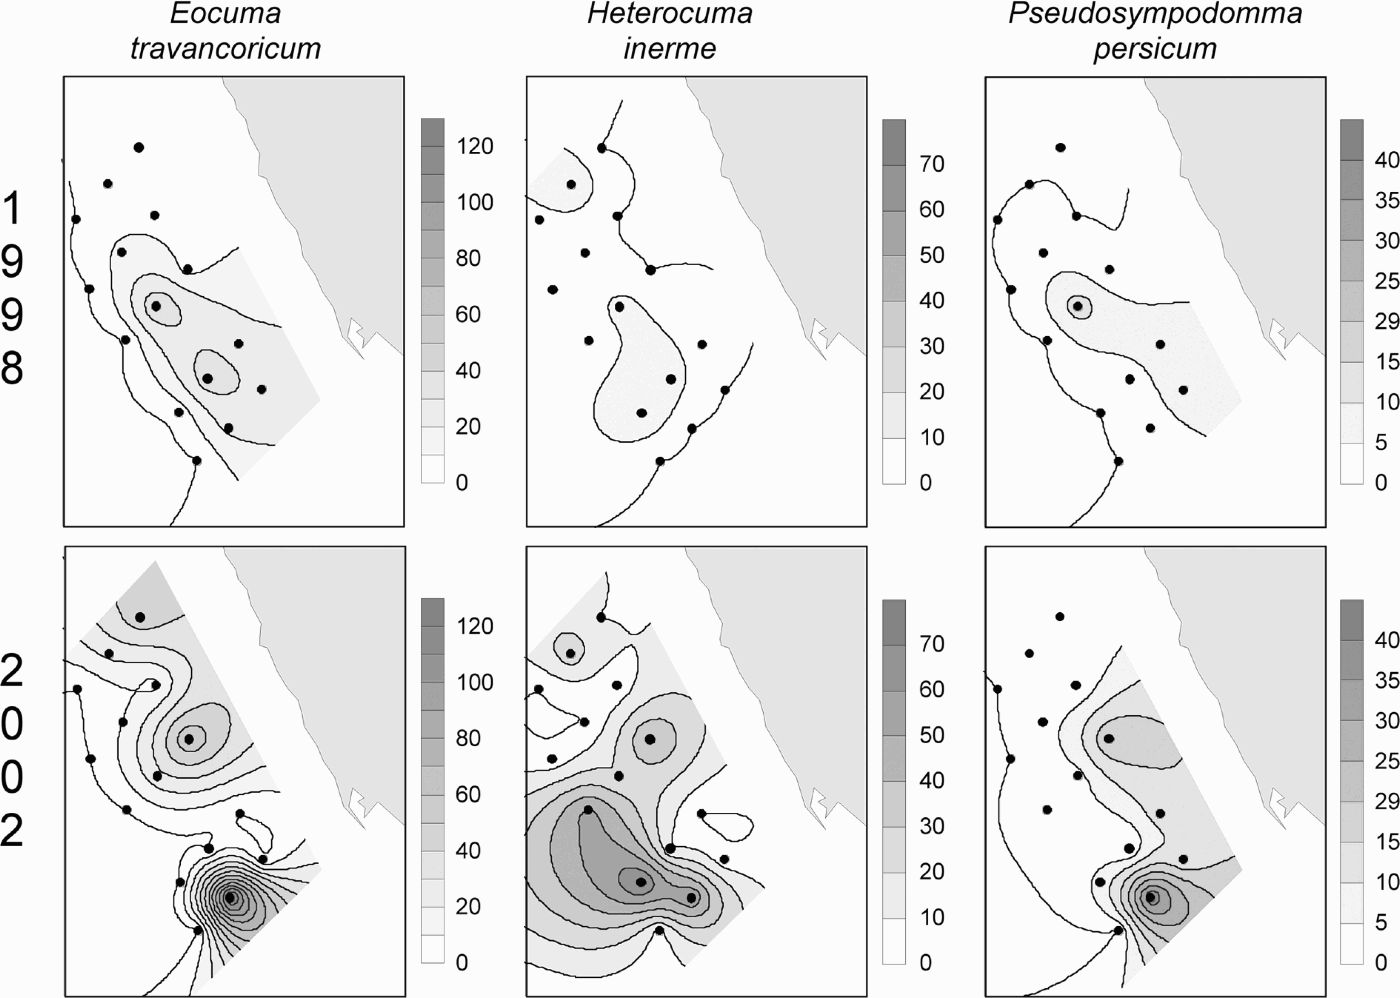
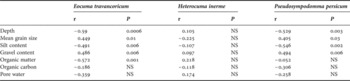
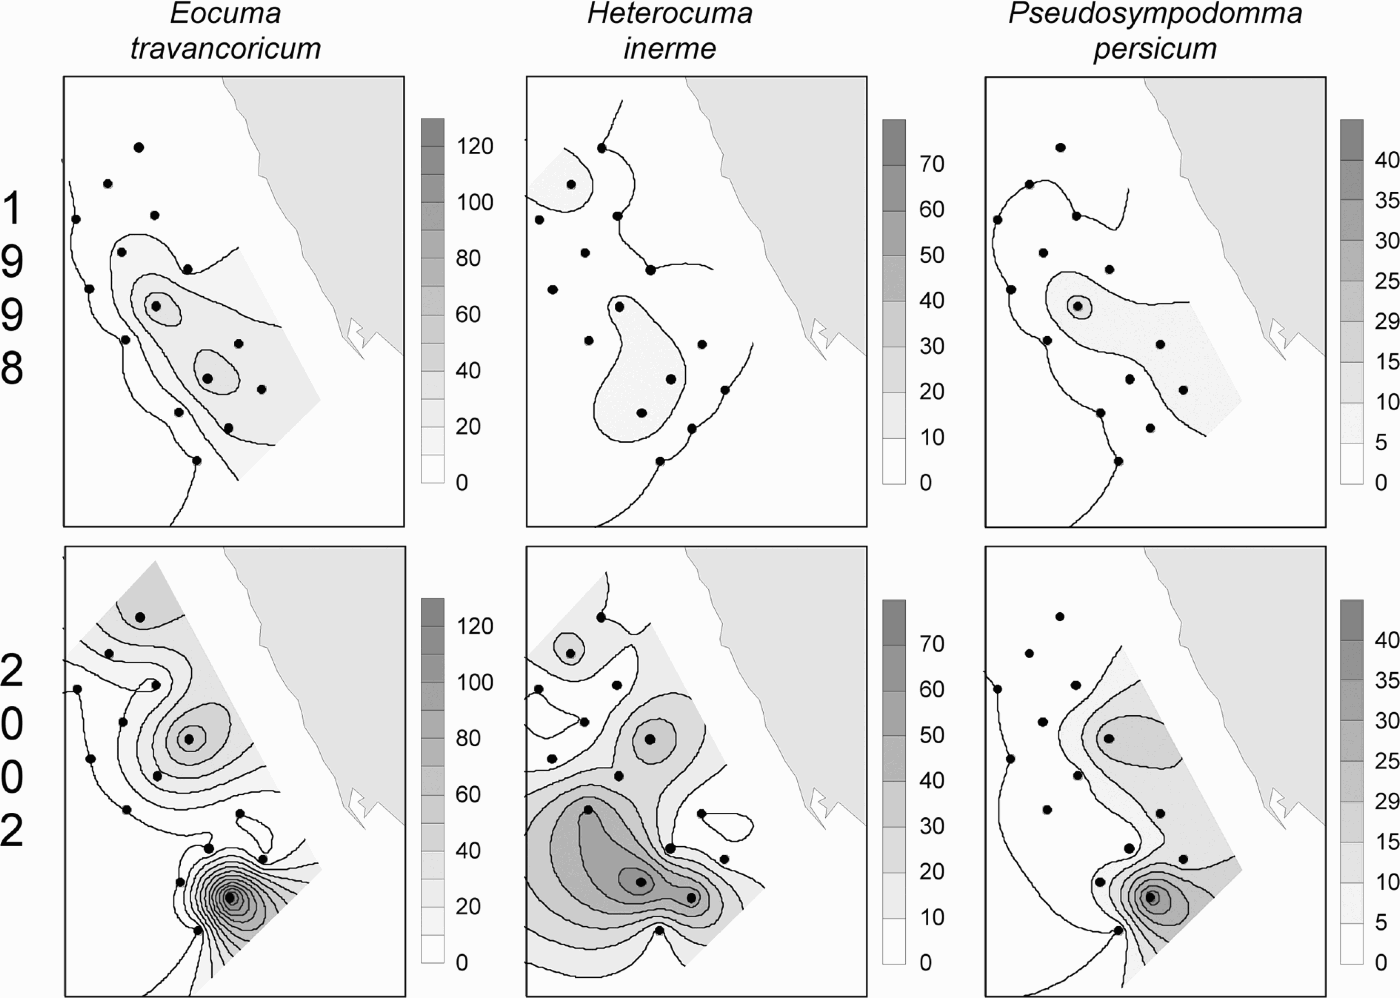
However, the environment influenced the cumacean assemblages significantly, as revealed by the increasing densities with the increasing gravel contents (Pearson correlation, r = 0.420, P < 0.02), and the decreasing densities together with the increasing silt content (Pearson correlation, r = –0.365, P < 0.05). Analysing separately the distribution of the three most abundance species (Figure 5), Heterocuma inerme did not show any significant relationship, while Eocuma travancoricum and Pseudosympodomma persicum matched the pattern of the whole assemblage, being also positively correlated with the mean grain size and negatively with depth. In addition, the distribution of E. travancoricum is negatively correlated with the organic matter content (Table 3).
Density (as ind. m−2) distribution patterns of the three most abundant cumacean species: Eocuma travancoricum, Heterocuma inerme and Pseudosympodomma persicum.
Results of the Pearson correlation analyses between the environmental descriptors and the density of the three numerically dominant cumacean species in Assaluyeh. NS, non significant.

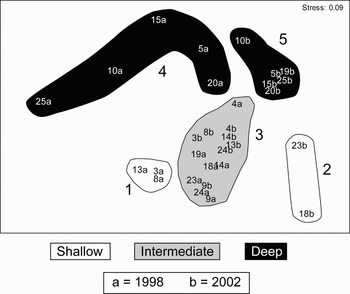
There was also a significant pattern of cumacean assemblage distribution (MDS; Figure 6), with groups 1 and 2 including the 1998 and 2002 shallow samples, respectively; group 3 including shallow to medium depth samples from both years; and groups 4 and 5 including all deepest 1998 and 2002 samples, respectively (ANOSIM, Global R = 0.414, P < 0.001). The densities of all species clearly differed among the MDS groups (Table 1). Heterocuma inerme occurred in all groups except group 1, while the highest densities were found in 2002 at the deepest stations (group 5). The most abundant species in shallow to medium depths were Pseudosympodomma persicum (group 2) and Eocuma travancoricum (groups 1 and 3), which were virtually absent from the deepest stations (groups 4 and 5). Conversely, Eocuma longicorne, Cyclaspis adiastolos and Iphinoe calmani, were present only at the deepest stations, particularly in 1998 (group 4).
Results of the MDS based on the cumacean assemblages of Assaluyeh. The obtained groups are explained as a combination of depth (low, medium and deep) and sampling period (1998 and 2002).

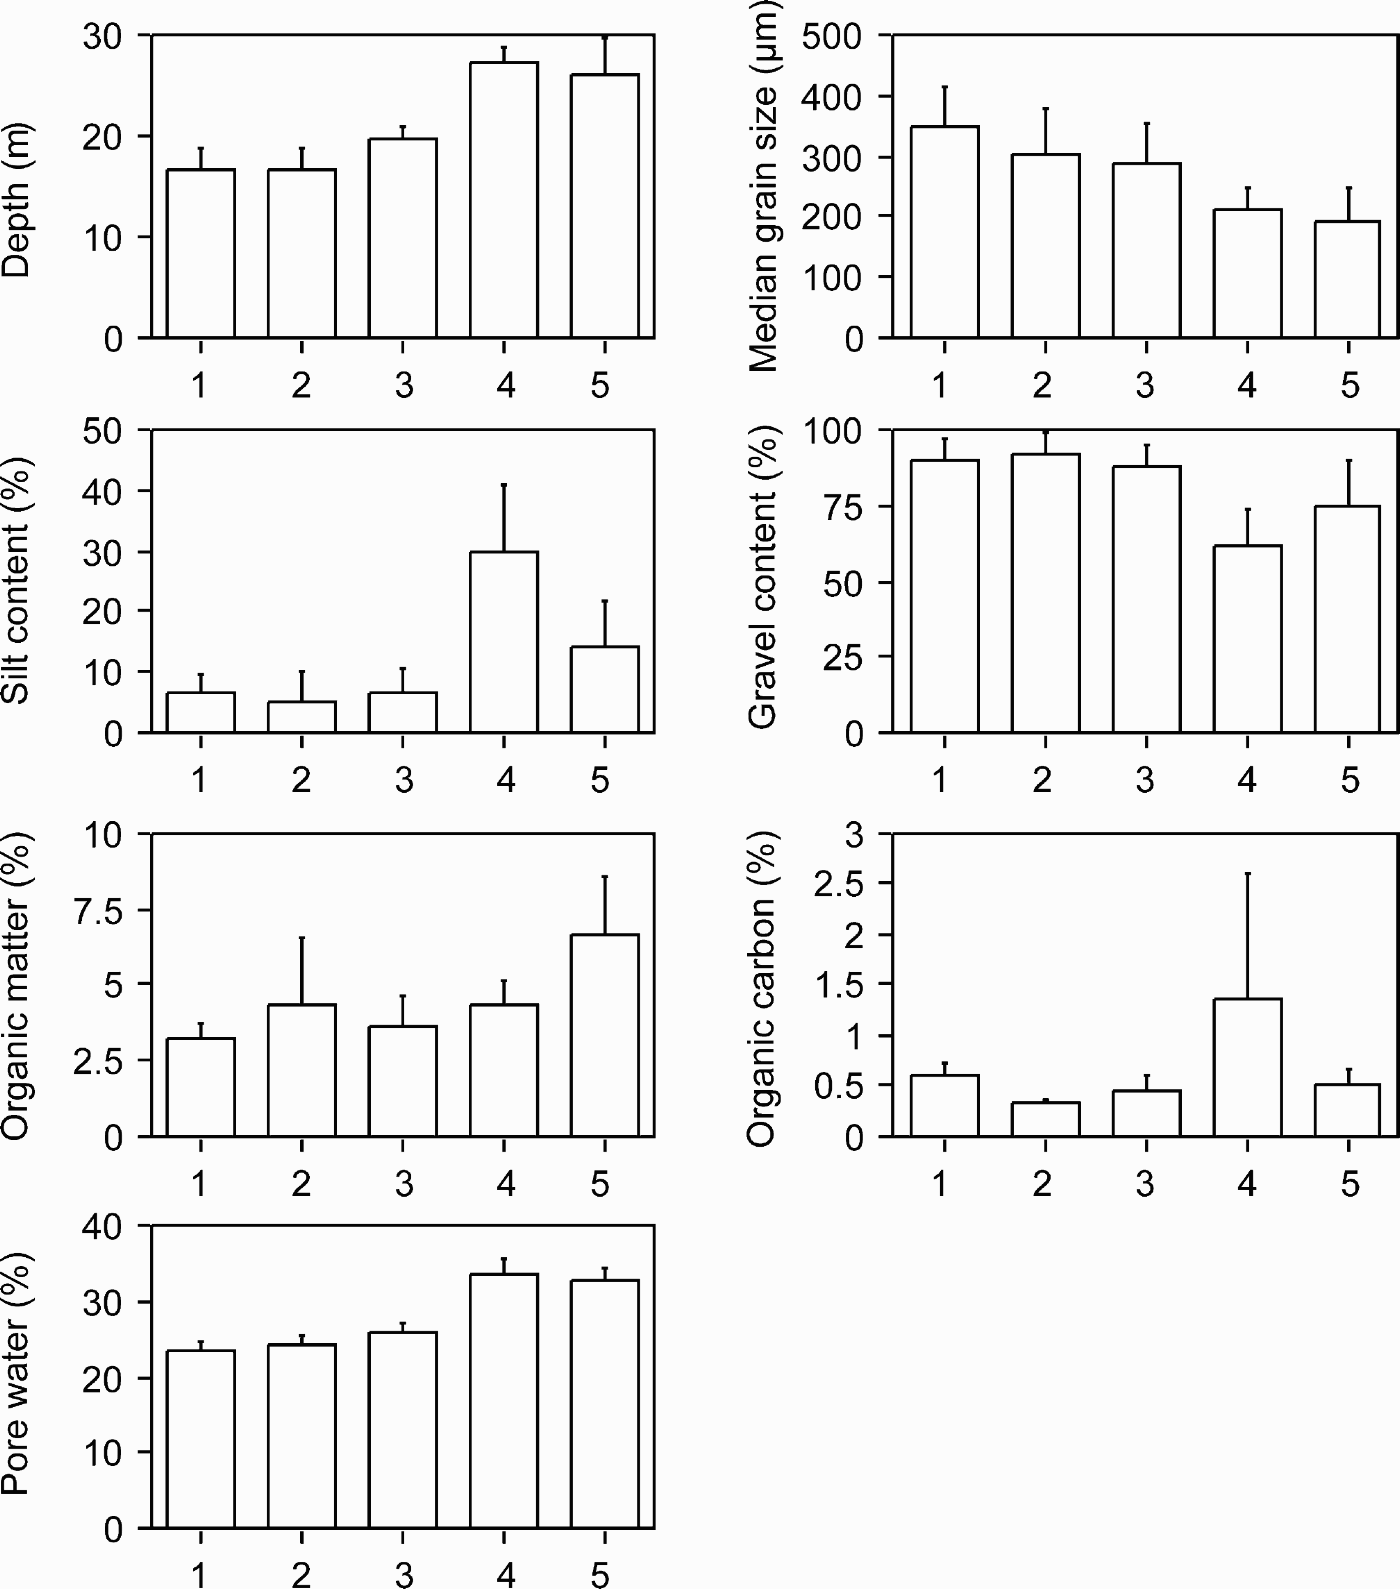
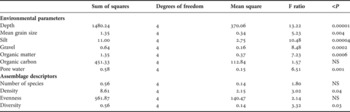
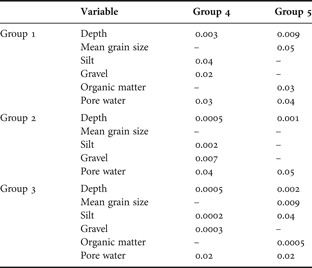
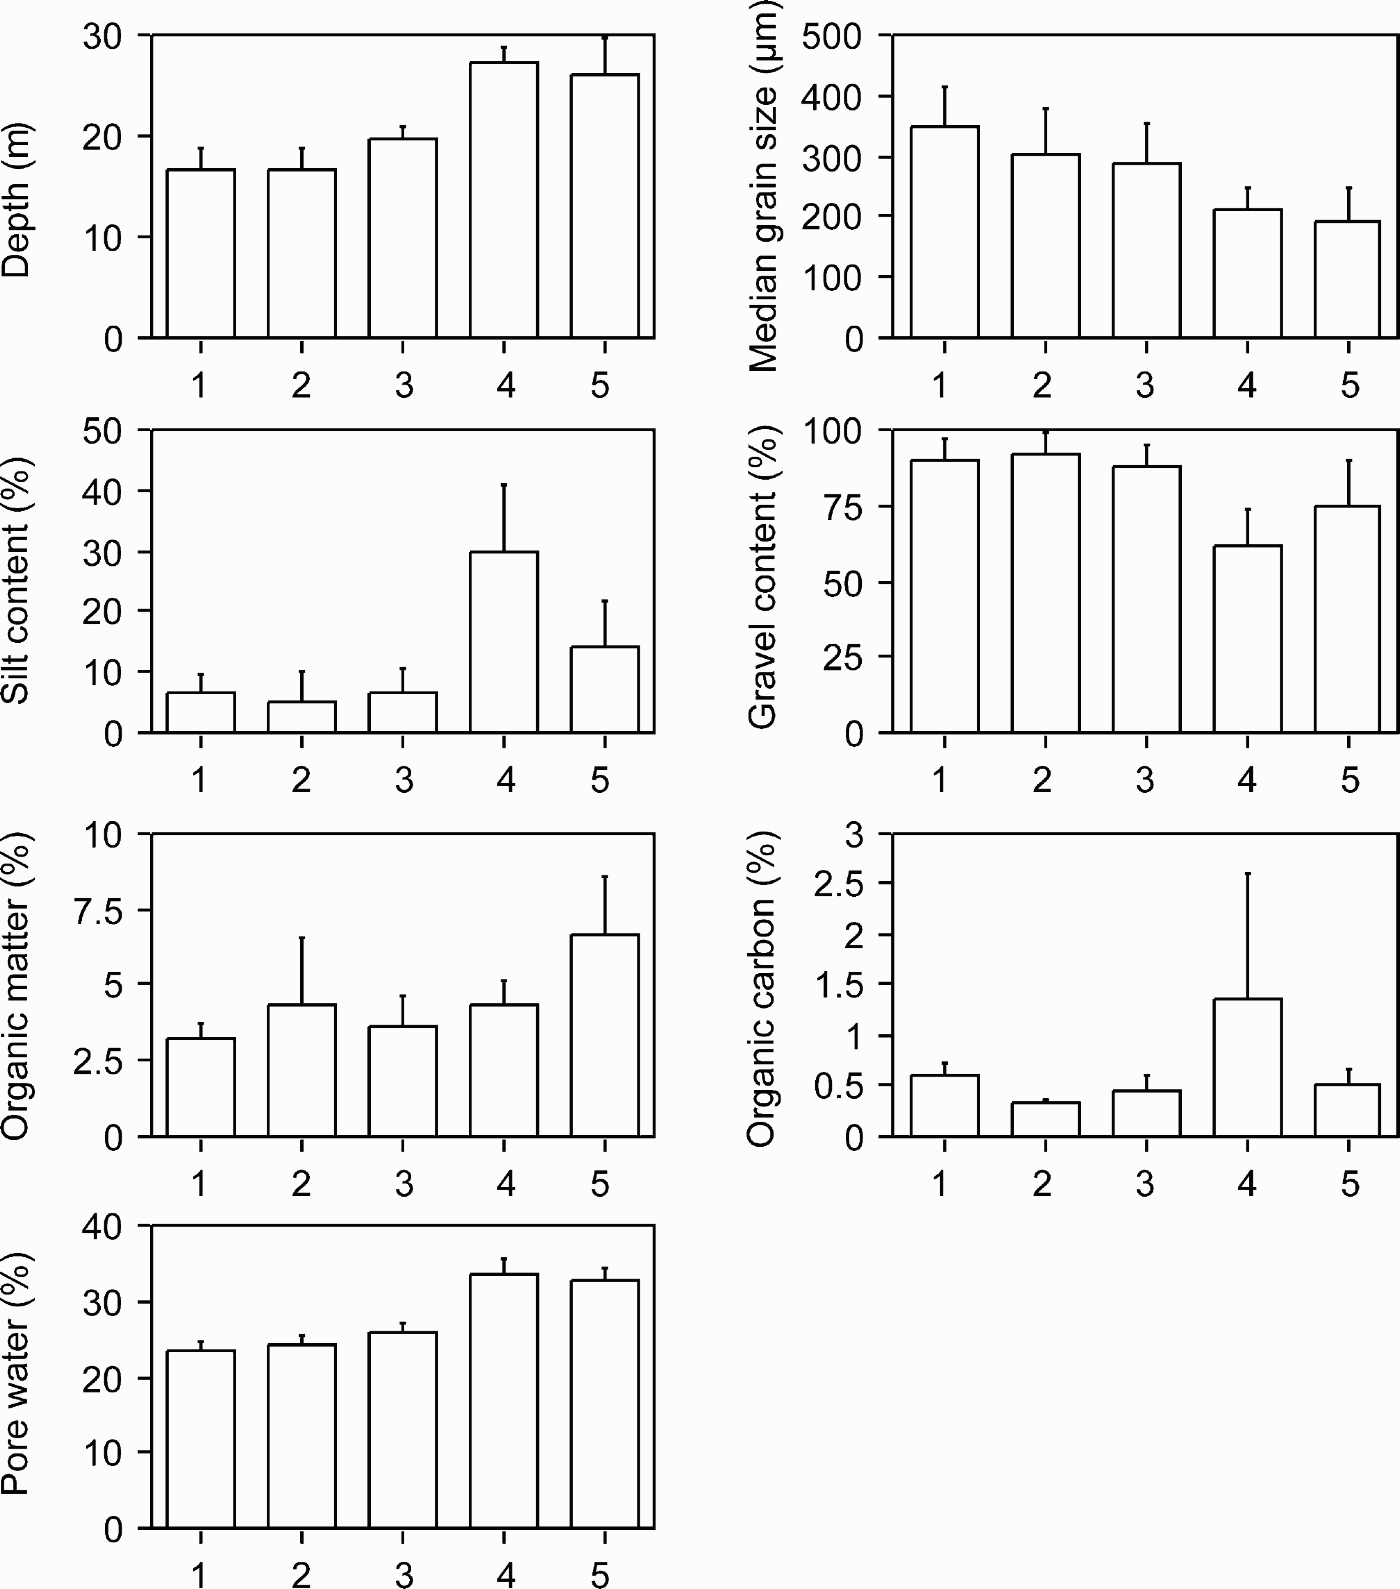
All environmental variables (except the organic carbon) showed significant differences between the MDS groups (Table 4): groups 4 and 5 were deeper and had more pore water than groups 1, 2 and 3; group 5 had smaller grain sizes than groups 1 and 3 and a higher silt content than group 3; group 4 had a higher silt content and a lower gravel content than groups 1, 2 and 3; group 5 had significantly more organic matter than groups 1 and 3 (Table 5; Figure 7).
Summary of the environmental variables according to the groups obtained in the MDS. See Figure 6 for an explanation of the MDS groups.
Results of the ANOVAs using the MDS groups (see Figure 6) as factors. NS, non significant.

Results of the Tukey HSD test based on environmental variables, showing the P values for the significant comparisons among the MDS groups (see Figure 6).

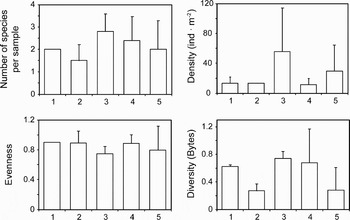
In contrast, only density and diversity showed significant differences between the MDS groups (Table 4), likely because the variability within groups was generally higher than between groups (Figure 8). Group 3 was responsible for the observed differences, showing significantly higher density and diversity than group 4 (Tukey test, P < 0.05) and group 5 (Tukey test, P < 0.04), respectively.
Summary of the cumacean assemblage descriptors according to the groups obtained in the MDS. See Figure 6 for an explanation of the MDS groups.

DISCUSSION
The most speciose family in the study area were the Bodotriidae. Among bodotriids, this paper presents the first data on the distribution of Eocuma carinocurvum, Cyclaspsis adiastolos, Heterocuma inerme and Pseudosympodomma persicum, which have been recently described (Corbera et al., Reference Corbera, Tirado and Martin2005). Cyclaspsis adiastolos, E. carinocurvum (only present in 2002), Iphinoe calmani (only present in 1998) and Eocuma longicorne showed very low abundances and occurred exclusively at the deepest stations, in association with the finest, organically richest sediments. Among the three most abundant species, H. inerme also tended to be more abundant in medium and deep stations (particularly in 2002), though its distribution was the widest. Conversely, P. persicum and E. travancoricum preferred medium to shallow depths, where sediments were rich in gravels. The resulting distribution pattern for the whole cumacean assemblage in the shallow waters off Asaluyeh was thus first conditioned by depth, mainly as a response to its related factors such as silt content (which increased with depth) and gravel content (which decreased with depth).
The few previous studies also reported a strong depth-dependence of the studied shallow water cumacean assemblages (e.g. Corbera & Cardell, Reference Corbera and Cardell1995 off the coasts of Barcelona, north-western Mediterranean, 5–70 m deep). Contrary to our results, however, lower cumacean densities occurred at the shallowest stations, together with increasing densities with the increasing depth. In turn, the bathymetric distribution in Assaluyeh matched the trends of the whole peracarid assemblage from shallow soft bottoms along the Italian coasts of the Tyrhenian Sea (8–53 m deep), where density and biodiversity decreased with depth (Scipione et al., Reference Scipione, Lattanzi, Tomassetti, Gusso Chimenz, Maggiori, Marinello, Cironi and Taramelli2005). Deep-sea cumacean assemblages also changed with depth (Rehm et al., Reference Rehm, Thatje, Mühlenthardt-Siegel and Brandt2007), but their abundance seemed to be high at intermediate depths, decreasing then with the increasing depth (e.g. Jones & Sanders, Reference Jones and Sanders1972; Cartes et al., Reference Cartes, Jaume and Madurell2003).
As already mentioned, the bathymetric distribution of the whole cumacean assemblages in Asaluyeh was influenced by the silt and gravel contents, whilst the organic matter content only affected the distribution of Eocuma travancoricum and Pseudosympodomma persicum, the most abundant species. However, the negative relationship between their densities and organic matter content found in Asaluyeh did not agree with that found off southern California, where Diastylopsis tenuis showed higher densities in bottoms with low sand and high silt percentages (Barnard & Given, 1960), or off Barcelona coasts, where the cumaceans tended to be more abundant in the most organically rich and muddy sediments (Corbera & Cardell, Reference Corbera and Cardell1995). At Barcelona, these sediments allowed the presence of two bathyal species of the genus Leucon, whose higher abundances were mainly responsible for the positive correlations with the organic matter, and, thus, with mud contents and depth. In the present study, however, we have no other information on the ecological preferences of the most abundant species, most of them known only from the area (see Corbera et al., Reference Corbera, Tirado and Martin2005). Thus, we may suggest that the observed distribution could be related to the trophic preferences of the dominant species, as previously reported both in laboratory experiments (Wieser, Reference Wieser1956) and in situ for instance in Puget Sound (Wieser, Reference Wieser1959), in shallow-water Thyrrenian Sea (Scipione et al., Reference Scipione, Lattanzi, Tomassetti, Gusso Chimenz, Maggiori, Marinello, Cironi and Taramelli2005) or in deep-sea Mediterranean (Cartes et al., Reference Cartes, Jaume and Madurell2003). Although little is known about the feeding preferences of cumaceans (Blazewicz-Paskowycz & Ligowski, Reference Blazewicz-Paskowycz and Ligowski2002), E. travancoricum and P. persicum could feed on epilitic diatoms grasping sand-grains as described by Foxon (Reference Foxon1936), which could explain their preference for shallower stations where silt content is lower. The Heterocuma species, like others with a long brush of plumose setae on the first pereopod, could be active suspension-feeders. This may imply a lesser dependency on the sediment type and, consequently, favour a wider distribution for these species, as observed for H. inerme in Assaluyeh.
The seasonality may also influence cumacean assemblages, which are usually more abundant in spring and summer, when they are more active in the water column (Corbera et al., Reference Corbera, San Vicente and Sorbe2000). However, a few studies reported higher cumacean densities in winter, which were explained according to different phenomena: (1) an increasing presence of mesohaline or oligohaline species of Coricuma and Spilocuma caused by winter decreases in salinity (Vargas, Reference Vargas1989; Modlin, Reference Modlin1992); and (2) an increase in abundance near the bottom sediments due to a reduction of the activity in the water column (Corbera et al., Reference Corbera, Brito and Núñez2002). In Ashaluyeh, the biological descriptors of the cumacean assemblages did not show significant differences between the 1998 and 2002 surveys, although the abundances tended to be higher in the latter. The influence of the organic contents, total and carbon (i.e. the only environmental parameters significantly differing between the two periods) is not clear, the former being higher (>1.6%) and the latter being lower (<0.4%) in 2002. Moreover, they were not correlated with the descriptors of the whole assemblage, while the relationships with the dominant species were negative. Conversely, there was a slight decrease in temperature (<3°C) and salinity (<2‰) in 2002. Thus, we may postulate that a possible combination of these factors (giving rise to a slight decrease of the activity in the water column and a dominance of low-salinity tolerant species) could have been influencing the studied assemblages, as revealed by the results of the MDS. However, the lack of a real seasonal survey (four years separate the two periods and the samples were collected in two different months) does not allow us to distinguish between seasonality and inter-annual variability, and our results may be considered as a preliminary assessment of the relative relevancy of the observed differences in environmental parameters on the cumacean assemblages of the study area.
The absence of significant differences between the 1998 and 2002 cumacean assemblages inhabiting medium depths in Ashaluyeh (i.e. group 3) must be pointed out. This could likely be the reason why the analyses of the biological descriptors were not discriminant enough and stresses the relevance of the transition assemblages often inhabiting intermediate depths, even in overall shallow-water environments (Scipione et al., Reference Scipione, Lattanzi, Tomassetti, Gusso Chimenz, Maggiori, Marinello, Cironi and Taramelli2005).
Cumacean distributions seemed always to be influenced by depth (and thus by the sediment characteristics and trophic constraints), although the specific depth-range (i.e. deeper or shallower), together with the particular environmental driving factors, such as water mass dynamics in deep-waters (Cartes et al., Reference Cartes, Jaume and Madurell2003) or sediment stability, low-tide exposure and grain size in shallow-waters (Wieser, Reference Wieser1959; Corey, Reference Corey1970; Corbera & Cardell, Reference Corbera and Cardell1995) may change the sense of this influence at each particular site. However, most of the species here reported have been recently described and are currently known only from the type location. Thus, there is no information about their ecology and distribution other than that in the present paper. This stresses that the cumacean fauna of the whole Persian Gulf is still poorly known and that future studies are needed to clarify the ecological constraints affecting their distribution patterns in this tropical region characterized by extreme environmental conditions (Price et al., Reference Price, Sheppard and Roberts1993).
ACKNOWLEDGEMENTS
The authors wish to thank M. Codina and João Gil for their help with the sorting of the macrofauna and identification of other faunal groups, and to the CRÉOCÉAN team that was responsible for the two field surveys. The study was carried out within the frame of a project financed by TOTAL E&P (HSE Division) and is a contribution to the research contract between the CEAB (CSIC) and the French company CRÉOCÉAN.